
Houses for sale & to rent in NG19 9QY, Spinney Close, Hornby, Mansfield
House Prices in NG19 9QY, Spinney Close, Hornby
Properties in NG19 9QY have no sales history available within the last 3 years. NG19 9QY is a postcode in Spinney Close located in Hornby, an area in Mansfield, Nottinghamshire, with 4 households².
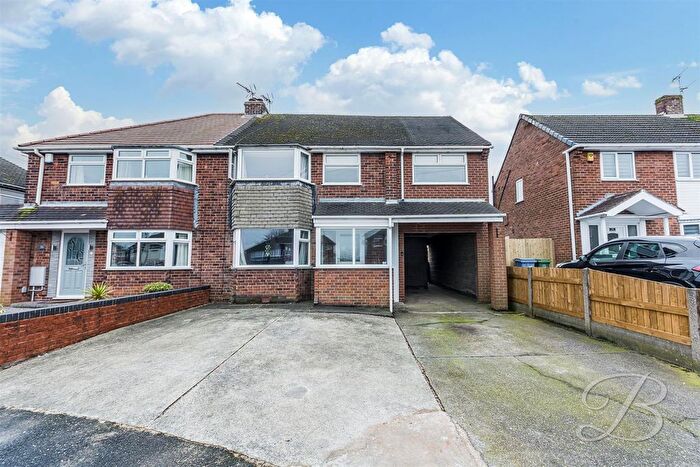
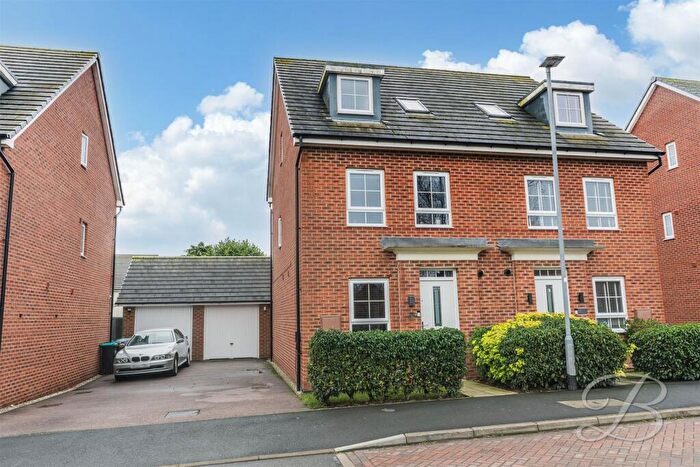
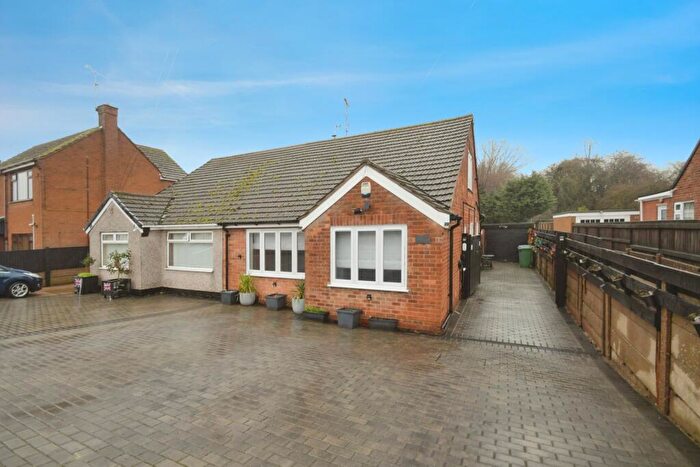
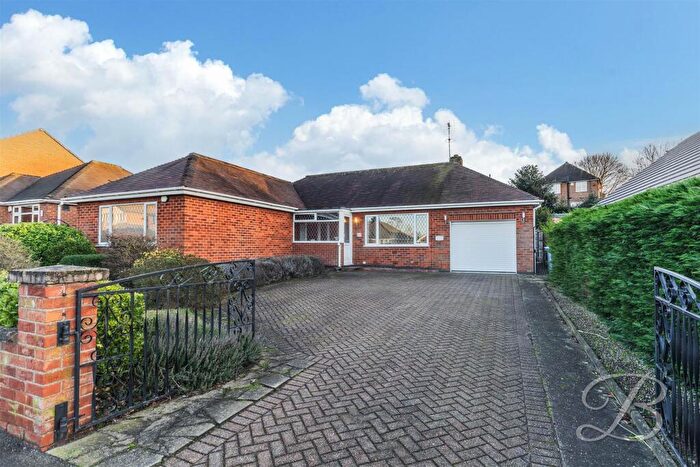
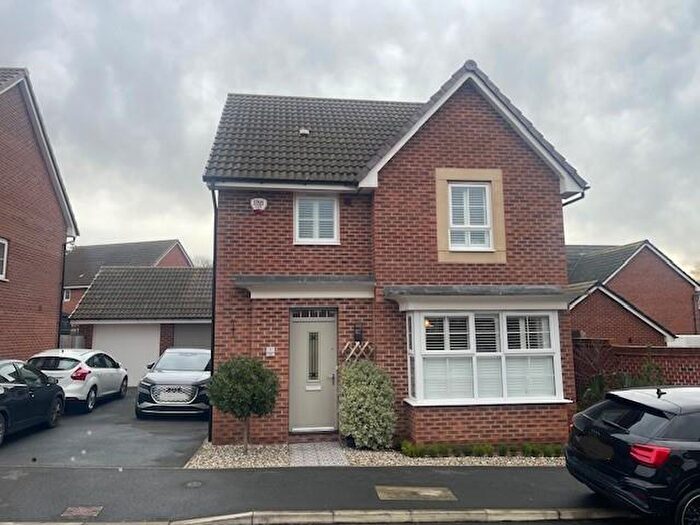
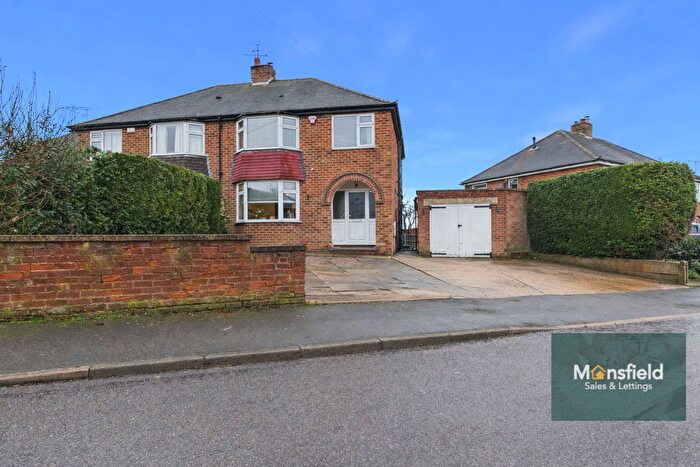
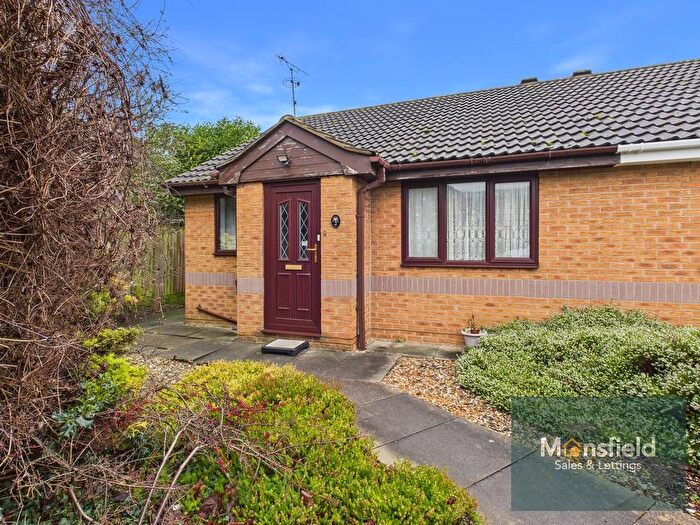
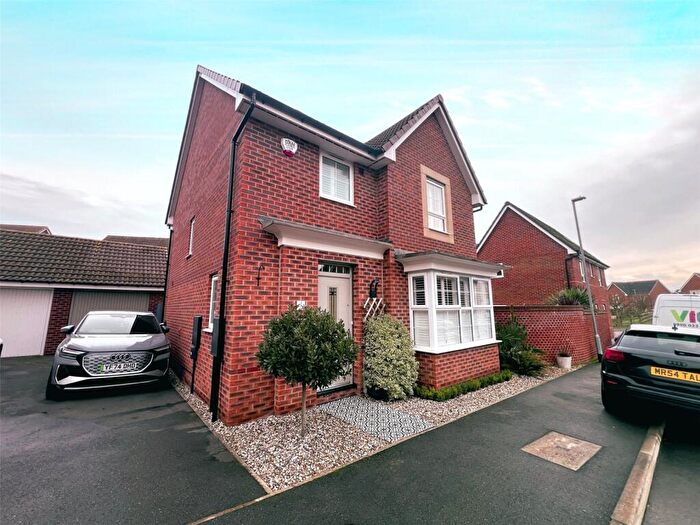
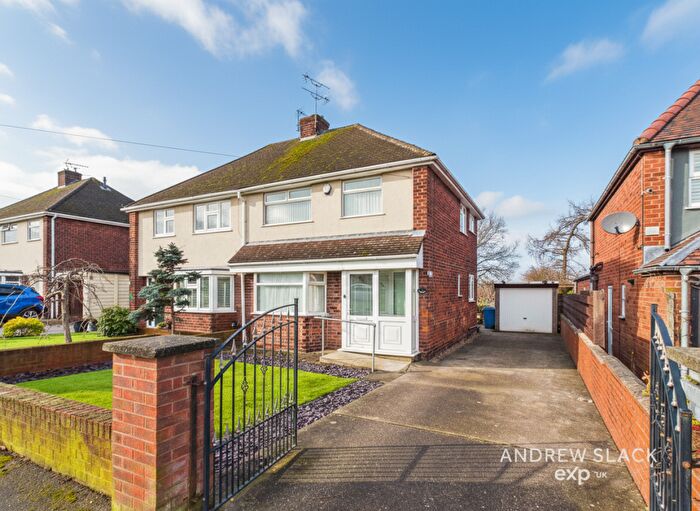
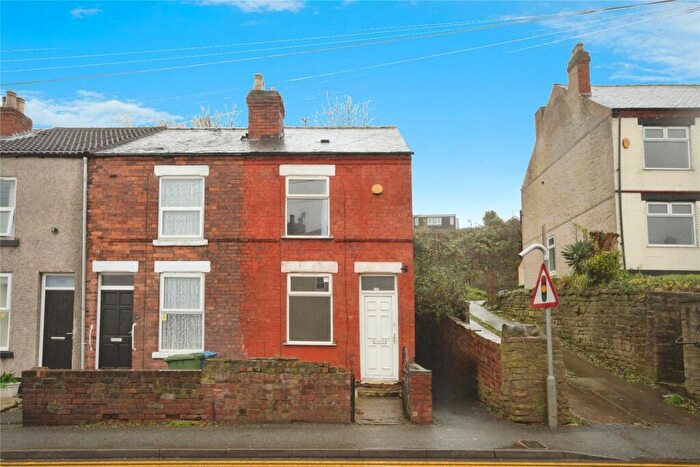
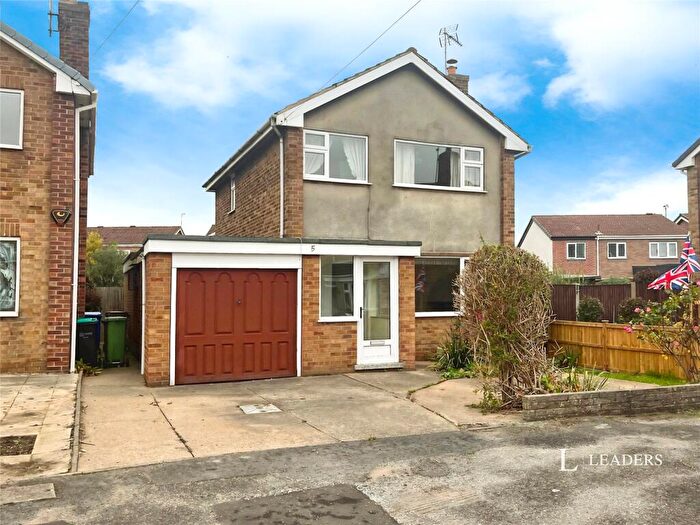
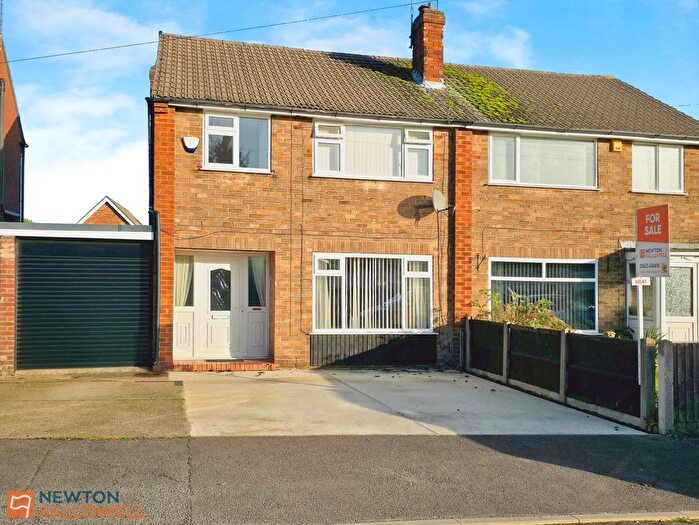
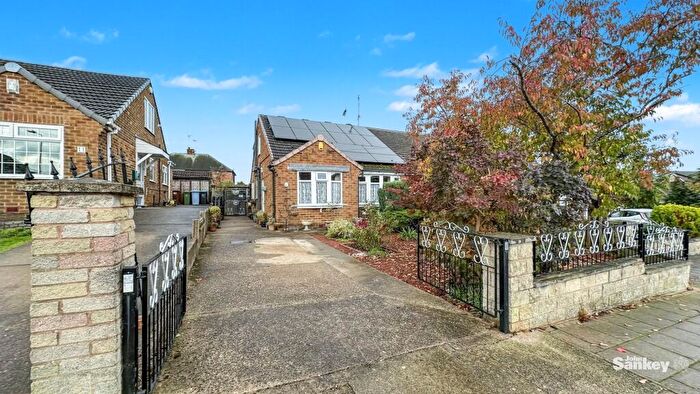
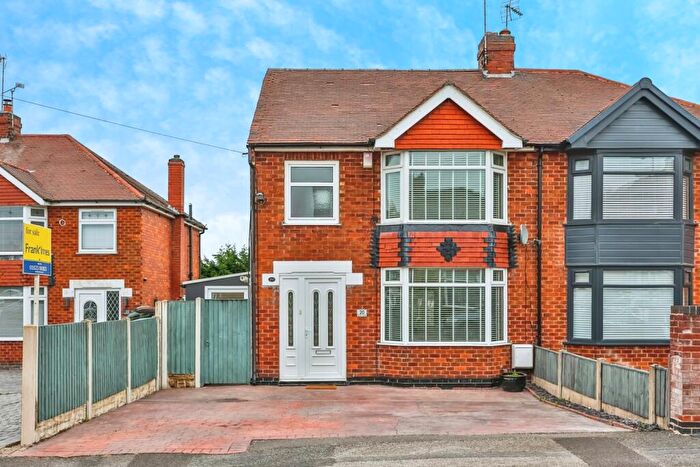
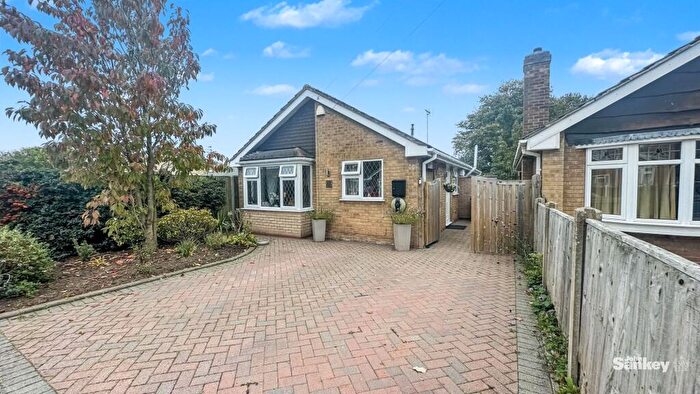
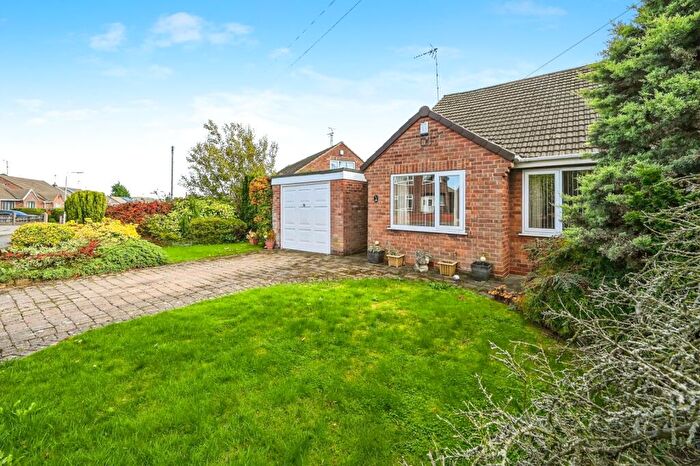
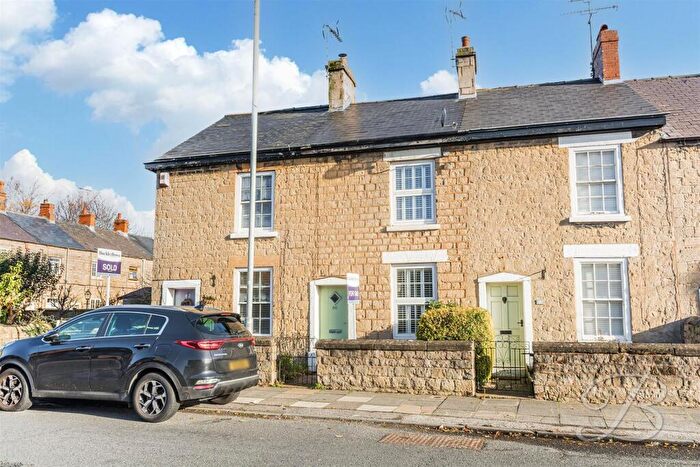
Properties for sale near NG19 9QY, Spinney Close

![]()
If you are looking to sell your house, let it out, or receive a property valuation, an expert can help you.
Click the button below to get started.

Price Paid in Spinney Close, NG19 9QY, Hornby
4 Spinney Close, NG19 9QY, Hornby Mansfield
Property 4 has been sold 2 times. The last time it was sold was in 07/06/2022 and the sold price was £235,000.00.
This detached house, sold as a freehold on 07/06/2022, is a 66 sqm detached bungalow with an EPC rating of D.
| Date | Price | Property Type | Tenure | Classification |
|---|---|---|---|---|
| 07/06/2022 | £235,000.00 | Detached House | freehold | Established Building |
| 01/03/2002 | £85,000.00 | Detached House | freehold | Established Building |
3 Spinney Close, NG19 9QY, Hornby Mansfield
Property 3 has been sold 1 time. The last time it was sold was in 30/10/2015 and the sold price was £170,000.00.
This detached house, sold as a freehold on 30/10/2015, is a 69 sqm detached bungalow with an EPC rating of D.
| Date | Price | Property Type | Tenure | Classification |
|---|---|---|---|---|
| 30/10/2015 | £170,000.00 | Detached House | freehold | Established Building |
2 Spinney Close, NG19 9QY, Hornby Mansfield
Property 2 has been sold 1 time. The last time it was sold was in 12/02/1999 and the sold price was £58,000.00.
This is a Detached House which was sold as a freehold in 12/02/1999
| Date | Price | Property Type | Tenure | Classification |
|---|---|---|---|---|
| 12/02/1999 | £58,000.00 | Detached House | freehold | Established Building |
Transport near NG19 9QY, Spinney Close

House price paid reports for NG19 9QY, Spinney Close
Click on the buttons below to see price paid reports by year or property price:
- Price Paid By Year
Property Price Paid in NG19 9QY, Spinney Close by Year
The average sold property price by year was:
| Year | Average Sold Price | Price Change |
Sold Properties
|
|---|---|---|---|
| 2022 | £235,000 | 28% |
1 Property |
| 2015 | £170,000 | 50% |
1 Property |
| 2002 | £85,000 | 32% |
1 Property |
| 1999 | £58,000 | - |
1 Property |