Houses for sale & to rent in Newgate, Mansfield
House Prices in Newgate
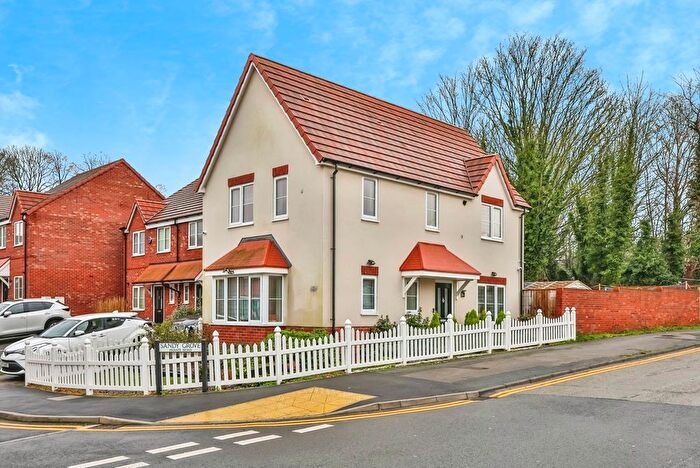
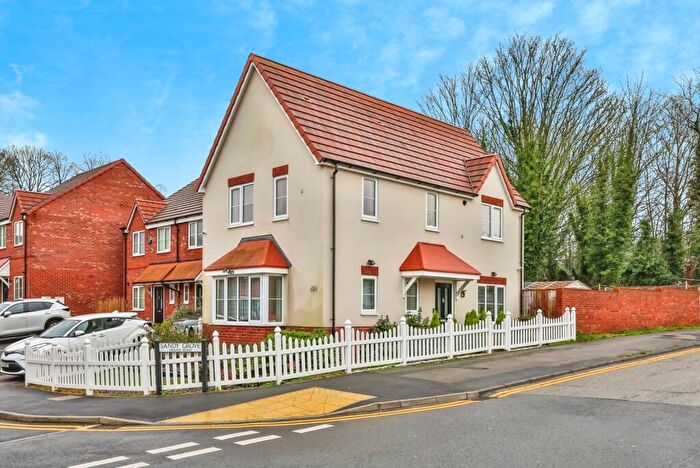
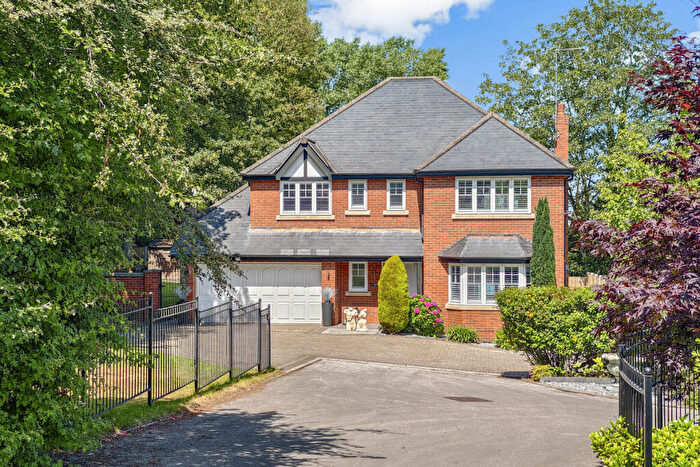
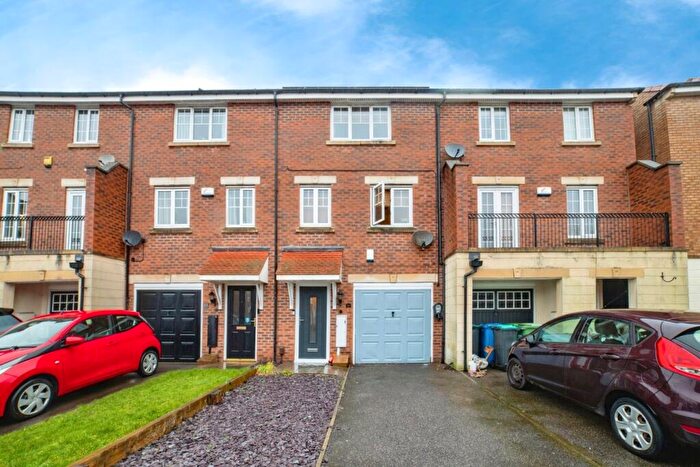
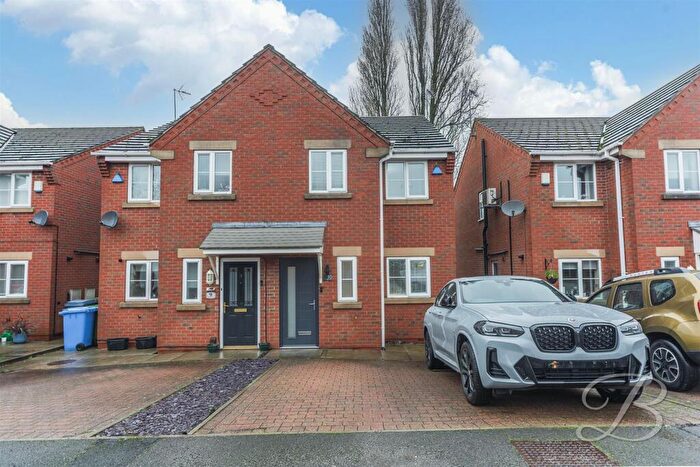
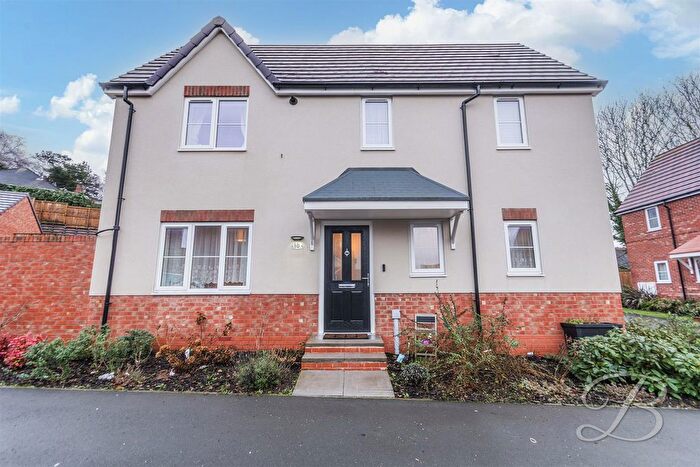
Properties in Newgate have an average house price of £119,840.00 and had 128 Property Transactions within the last 3 years¹.
Newgate is an area in Mansfield, Nottinghamshire with 1,381 households², where the most expensive property was sold for £440,000.00.
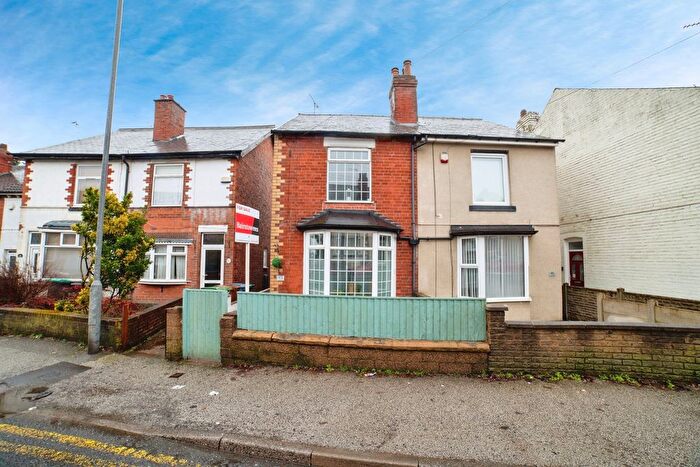
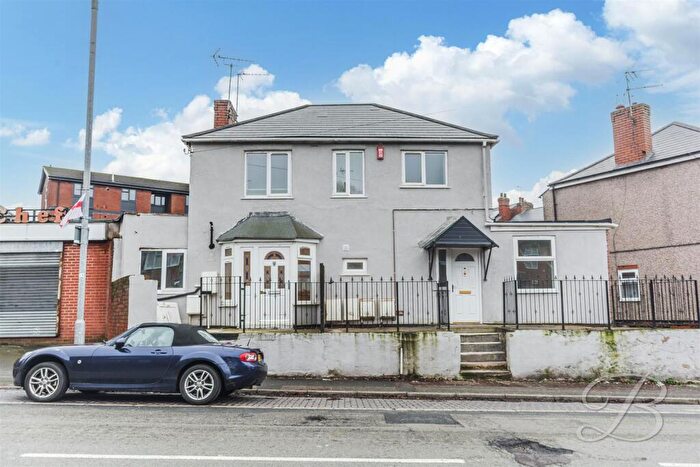
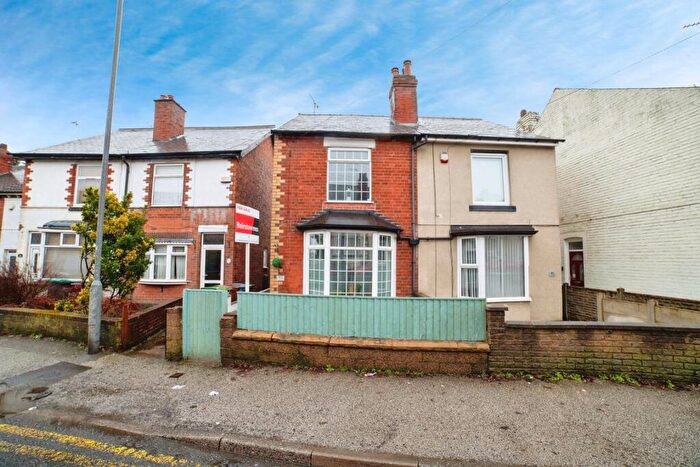
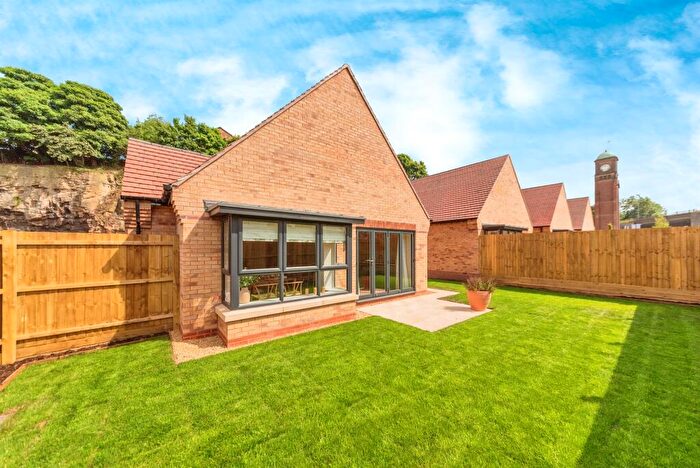
Properties for sale in Newgate
Roads and Postcodes in Newgate
Navigate through our locations to find the location of your next house in Newgate, Mansfield for sale or to rent.
| Streets | Postcodes |
|---|---|
| Arthur Street | NG18 2HG |
| Babworth Court | NG18 2NU |
| Belper Street | NG18 2LW |
| Belper Way | NG18 2PB |
| Bentinck Street | NG18 2QQ |
| Beresford Street | NG18 2PH |
| Bilborough Road | NG18 2NZ |
| Birkland Street | NG18 2QG |
| Bolsover Street | NG18 2PS NG18 2PT |
| Bowling Street | NG18 2LH |
| Broxtowe Drive | NG18 2JE NG18 2JF |
| Carter Lane | NG18 3DF NG18 3DH |
| Coronation Street | NG18 2QL |
| Cropwell Court | NG18 2NT |
| Empire Street | NG18 2QJ |
| Francis Street | NG18 2NW |
| Frederick Street | NG18 2HF |
| Gladstone Street | NG18 2LL NG18 2LN |
| Great Central Road | NG18 2RJ |
| Harcourt Street | NG18 2PY |
| Hardwick Street | NG18 2LP |
| Heywood Street | NG18 2LR |
| Hickling Court | NG18 2NY |
| Hope Street | NG18 2LJ |
| King Street | NG18 2PX |
| Little Carter Lane | NG18 3AB |
| Lunness Court | NG18 2JD |
| Mill Street | NG18 2PQ |
| Montague Street | NG18 2PL NG18 2PN |
| Mountview Close | NG18 2JS |
| Newgate Lane | NG18 2LG NG18 2LQ NG18 2QA NG18 2QB NG18 2QD NG18 2QF NG18 2LF |
| Ordsall Close | NG18 3DN |
| Pecks Hill | NG18 2NN NG18 2NS |
| Prospect Street | NG18 2JJ |
| Ratcliffe Gate | NG18 2JL NG18 2JB |
| Redcliffe Road | NG18 2QH NG18 2QN |
| Rock Hill | NG18 2JP NG18 2PG |
| Rock Hill Gardens | NG18 2JN |
| Rock Street | NG18 2PJ |
| Sandy Lane | NG18 2LS NG18 2LU |
| Scarcliffe Street | NG18 2PU |
| Shaw Street | NG18 2NP |
| Skerry Hill | NG18 2PR NG18 2PW |
| Stuart Street | NG18 2NR |
| The Broadway | NG18 2RL |
| Tideswell Court | NG18 2PD |
Transport near Newgate
-
Mansfield Town Station
-
Mansfield Woodhouse Station
-
Sutton Parkway Station
-
Kirkby in Ashfield Station
-
Shirebrook (Derbys) Station
- FAQ
- Price Paid By Year
- Property Type Price
Frequently asked questions about Newgate
What is the average price for a property for sale in Newgate?
The average price for a property for sale in Newgate is £119,840. This amount is 38% lower than the average price in Mansfield. There are 1,231 property listings for sale in Newgate.
What streets have the most expensive properties for sale in Newgate?
The streets with the most expensive properties for sale in Newgate are Little Carter Lane at an average of £213,250, Rock Hill at an average of £176,000 and Pecks Hill at an average of £153,465.
What streets have the most affordable properties for sale in Newgate?
The streets with the most affordable properties for sale in Newgate are Cropwell Court at an average of £55,000, Ratcliffe Gate at an average of £60,000 and Hope Street at an average of £70,837.
Which train stations are available in or near Newgate?
Some of the train stations available in or near Newgate are Mansfield Town, Mansfield Woodhouse and Sutton Parkway.
Property Price Paid in Newgate by Year
The average sold property price by year was:
| Year | Average Sold Price | Price Change |
Sold Properties
|
|---|---|---|---|
| 2025 | £97,843 | -24% |
32 Properties |
| 2024 | £121,104 | -8% |
39 Properties |
| 2023 | £131,324 | 11% |
57 Properties |
| 2022 | £116,242 | 14% |
55 Properties |
| 2021 | £99,835 | 12% |
60 Properties |
| 2020 | £87,859 | 5% |
48 Properties |
| 2019 | £83,474 | -1% |
48 Properties |
| 2018 | £83,932 | -8% |
61 Properties |
| 2017 | £91,019 | 9% |
46 Properties |
| 2016 | £82,490 | 3% |
62 Properties |
| 2015 | £80,197 | 10% |
43 Properties |
| 2014 | £72,540 | 3% |
49 Properties |
| 2013 | £70,605 | 17% |
39 Properties |
| 2012 | £58,611 | -33% |
22 Properties |
| 2011 | £77,741 | 3% |
29 Properties |
| 2010 | £75,434 | -22% |
32 Properties |
| 2009 | £92,023 | 11% |
17 Properties |
| 2008 | £82,023 | 1% |
41 Properties |
| 2007 | £81,153 | 4% |
76 Properties |
| 2006 | £77,775 | -8% |
71 Properties |
| 2005 | £83,969 | 21% |
94 Properties |
| 2004 | £65,920 | 23% |
121 Properties |
| 2003 | £50,800 | 29% |
79 Properties |
| 2002 | £36,256 | 13% |
112 Properties |
| 2001 | £31,527 | 1% |
76 Properties |
| 2000 | £31,262 | 3% |
55 Properties |
| 1999 | £30,351 | 8% |
42 Properties |
| 1998 | £27,936 | -2% |
48 Properties |
| 1997 | £28,538 | 12% |
58 Properties |
| 1996 | £25,156 | -12% |
65 Properties |
| 1995 | £28,070 | - |
47 Properties |
Property Price per Property Type in Newgate
Here you can find historic sold price data in order to help with your property search.
The average Property Paid Price for specific property types in the last three years are:
| Property Type | Average Sold Price | Sold Properties |
|---|---|---|
| Semi Detached House | £131,994.00 | 32 Semi Detached Houses |
| Detached House | £213,125.00 | 8 Detached Houses |
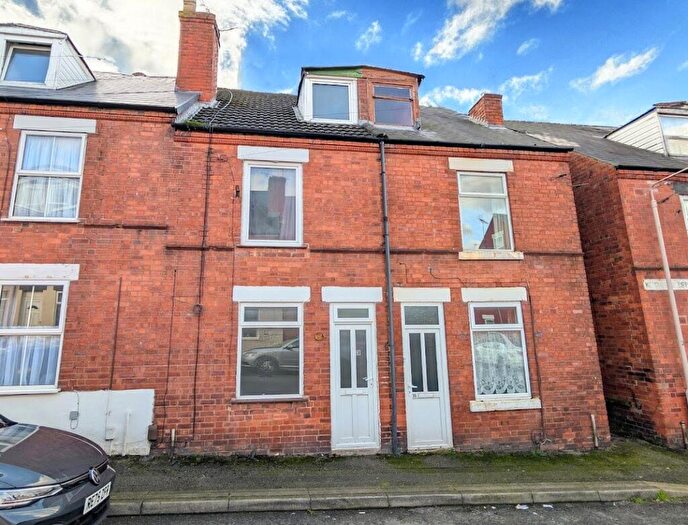
| Terraced House | £109,321.00 | 77 Terraced Houses |
| Flat | £90,272.00 | 11 Flats |

