
Houses for sale in Netherfield, Mansfield
House Prices in Netherfield
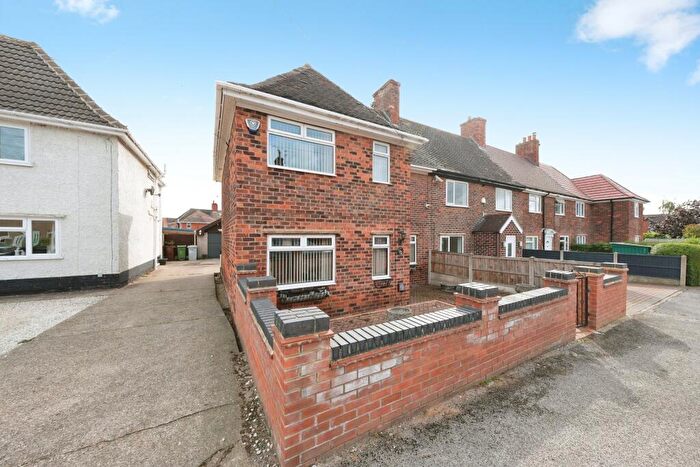
Properties in Netherfield have an average house price of £170k and had 97 Property Transactions within the last 3 years¹.
Netherfield is an area in Mansfield, Nottinghamshire with 1,304 households², where the most expensive property was sold for £500k.
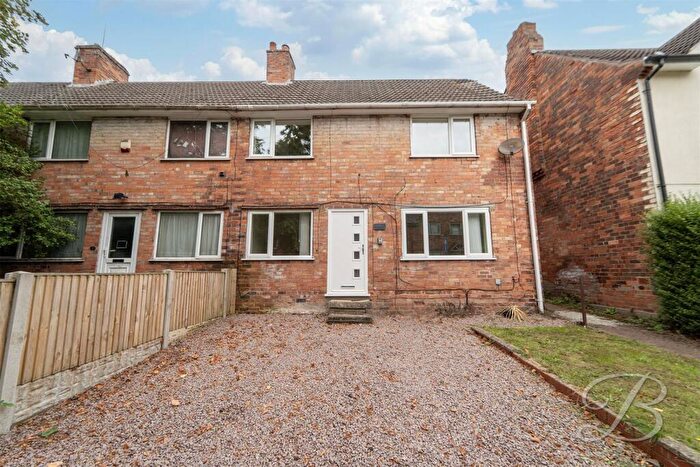
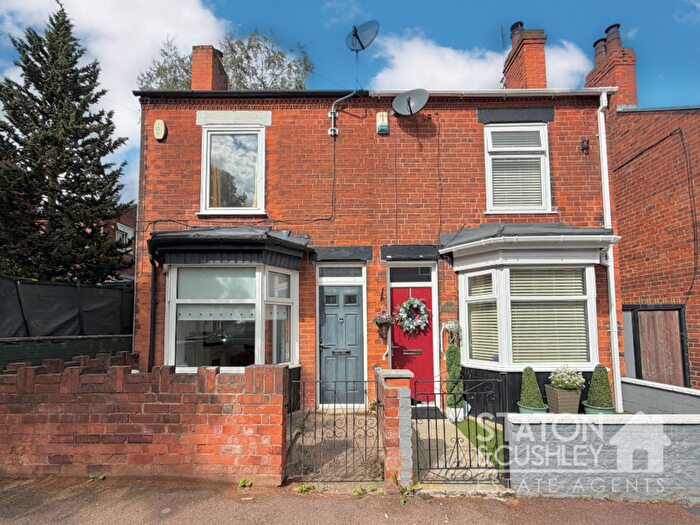
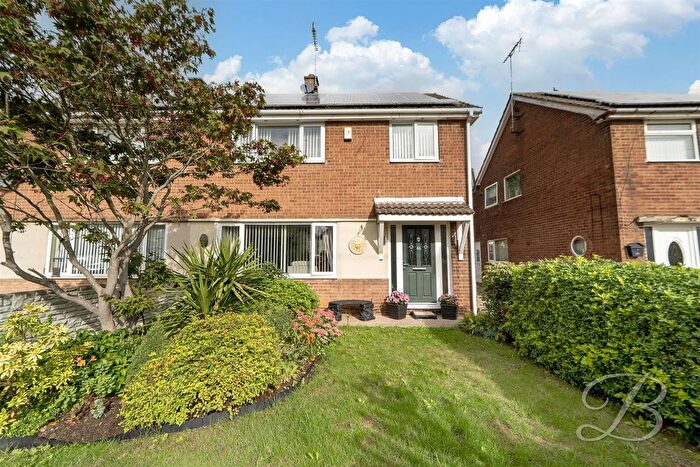
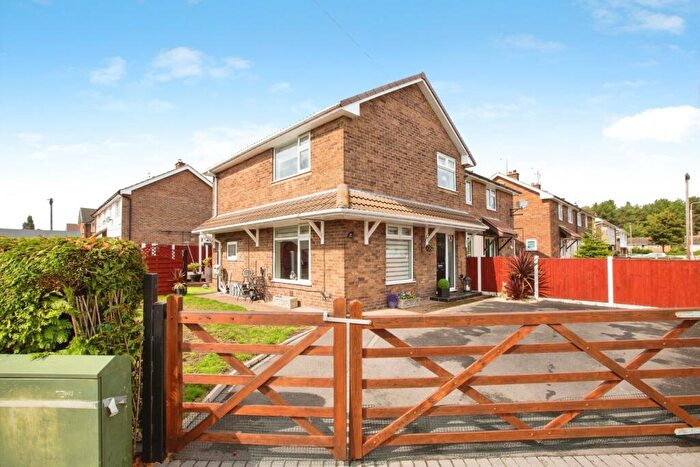
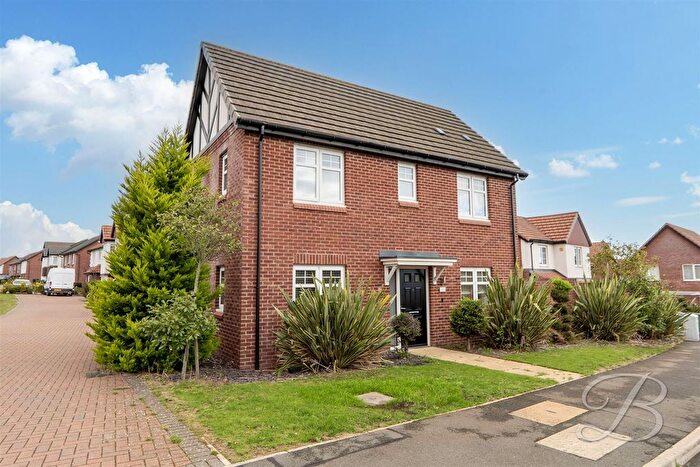
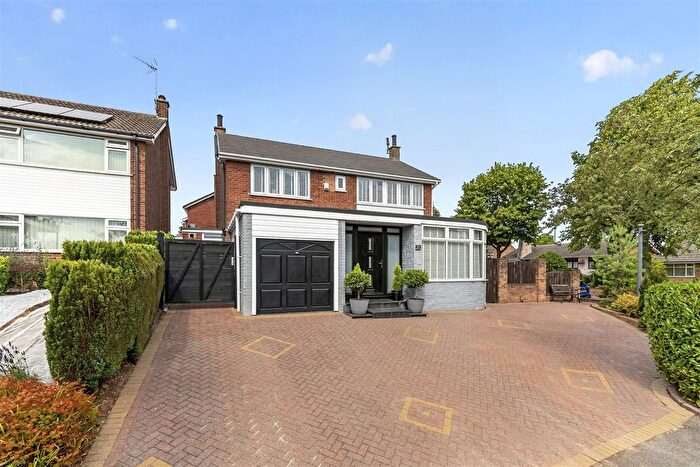
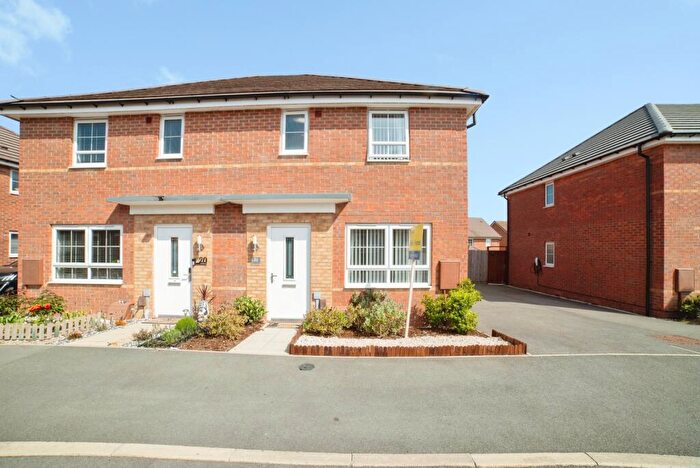
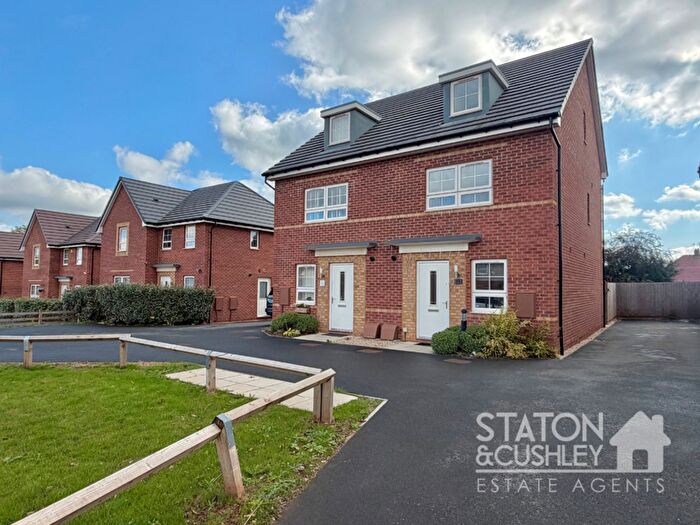
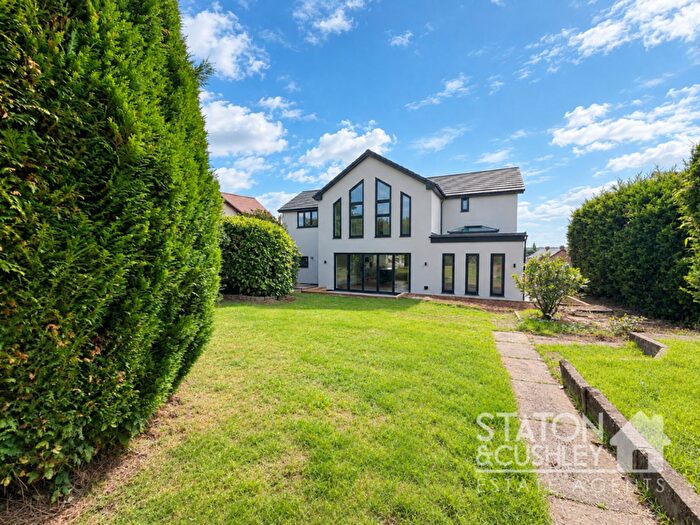
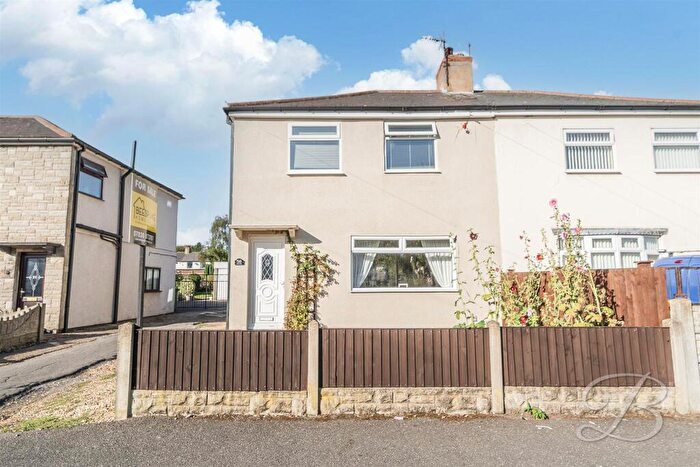
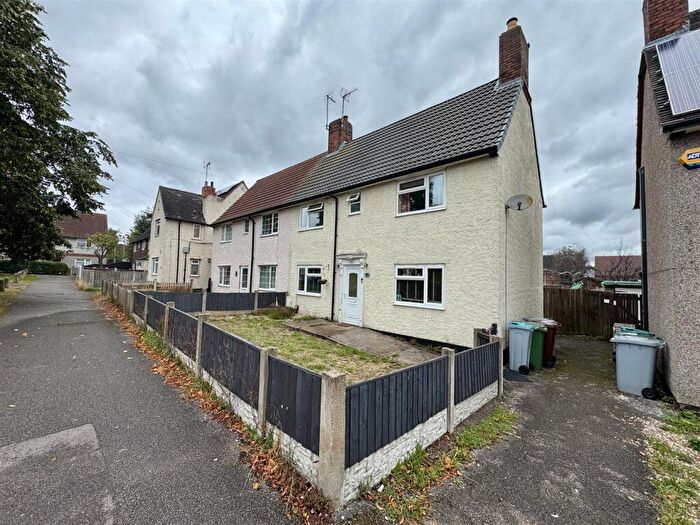
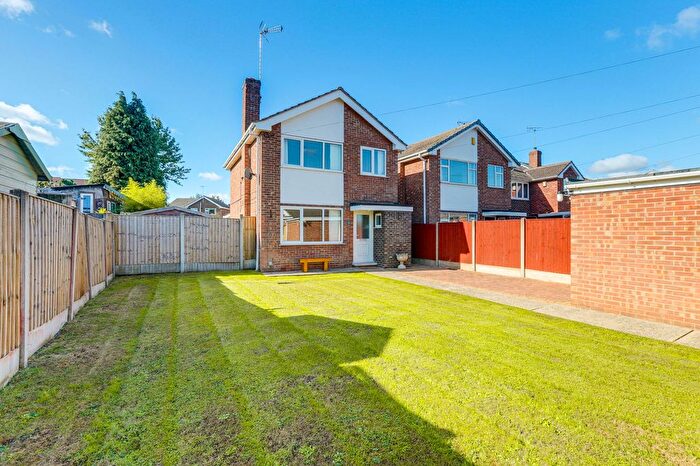
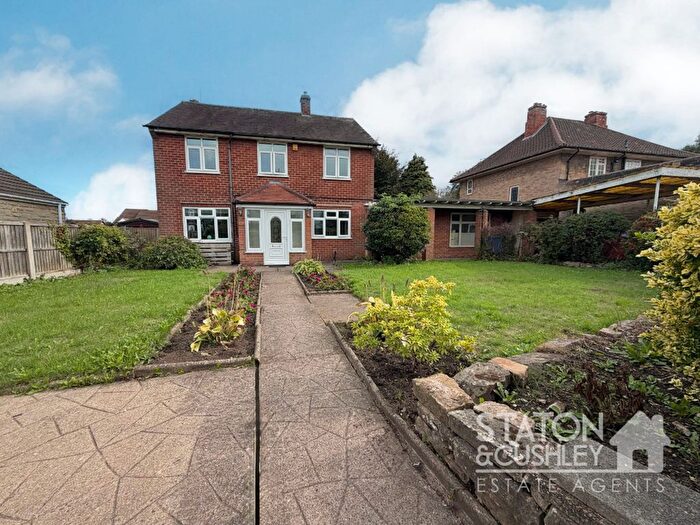
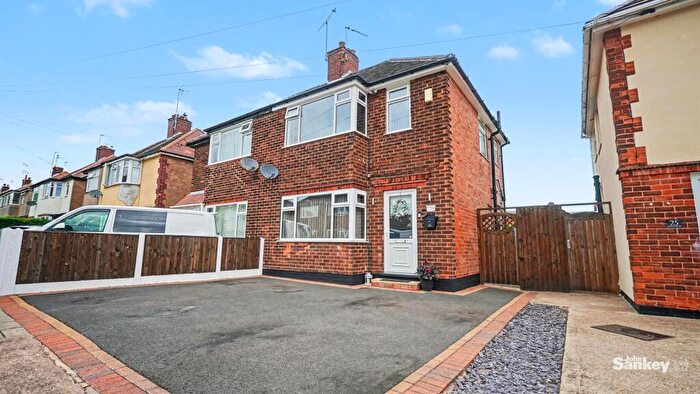
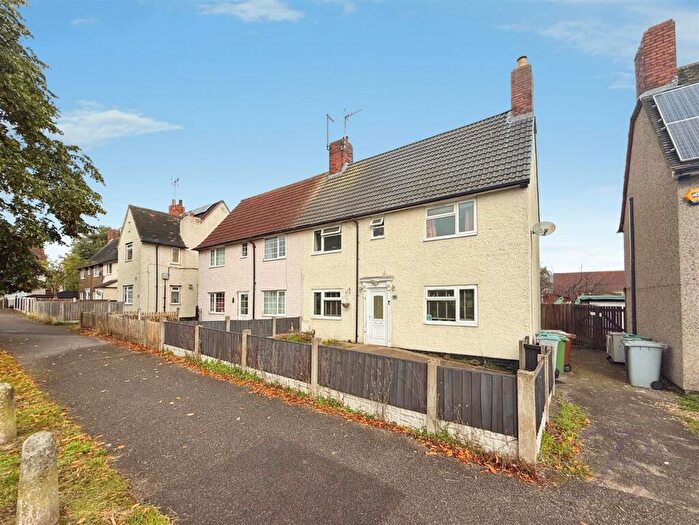
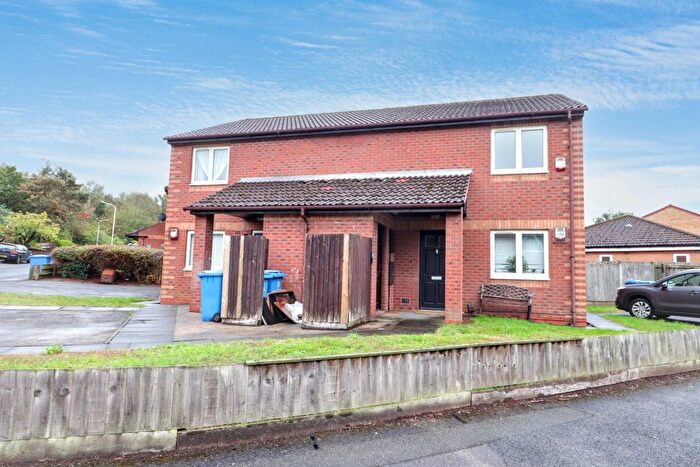
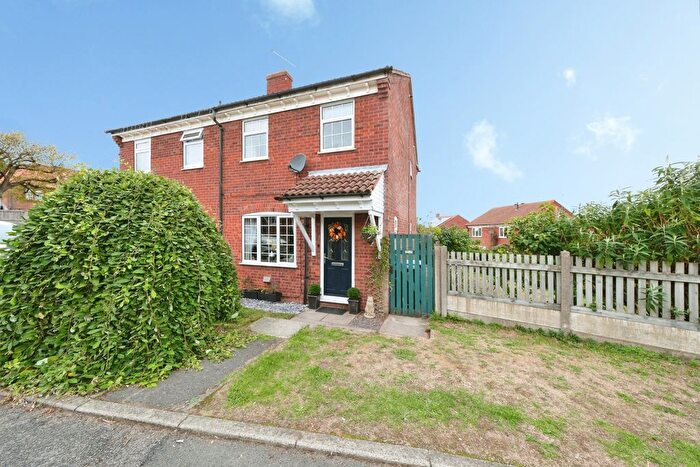
Properties for sale in Netherfield

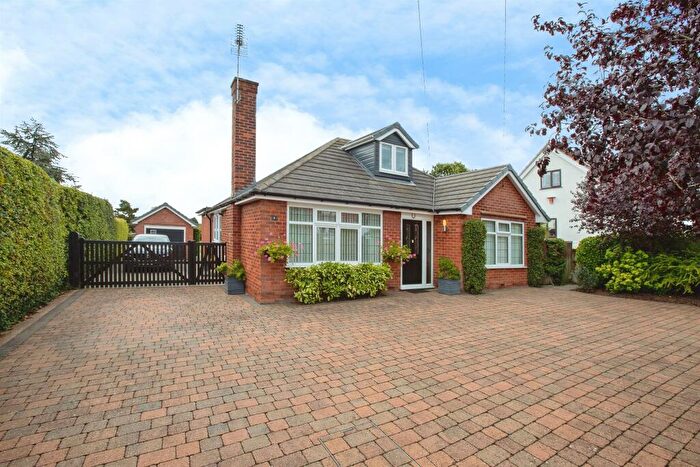

 3 Bedrooms
 2 Bathrooms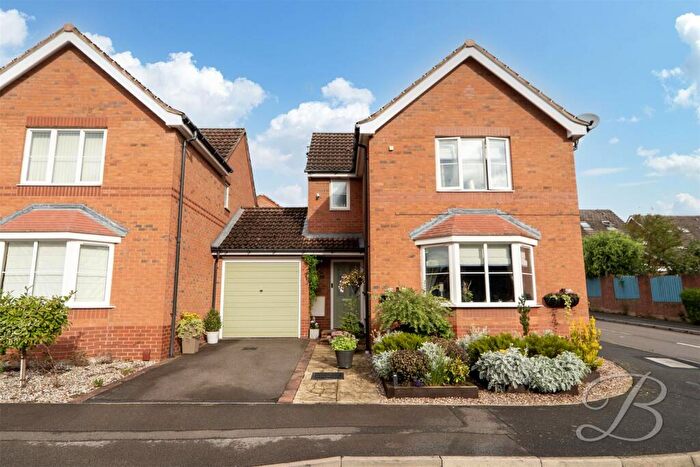

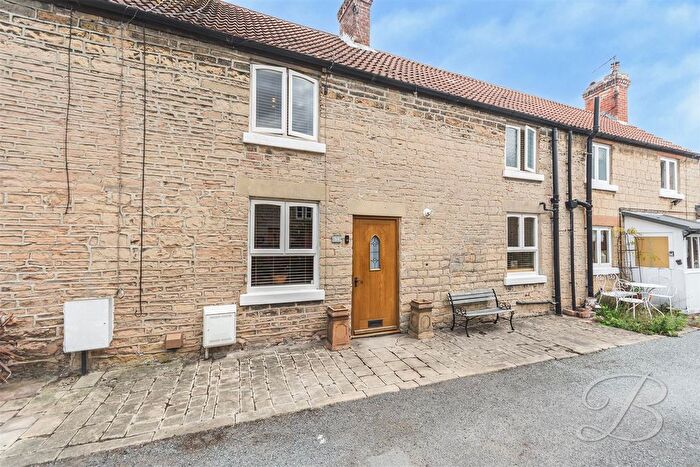
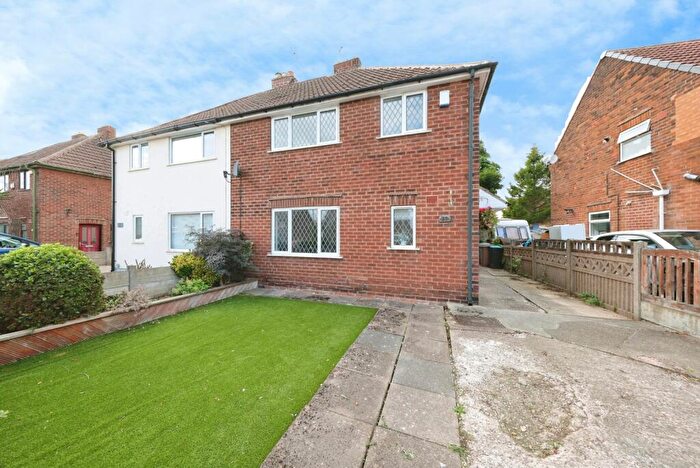

If you are looking to sell your house, let it out, or receive a property valuation, an expert can help you.
Click the button below to get started.
Roads and Postcodes in Netherfield
Navigate through our locations to find the location of your next house in Netherfield, Mansfield for sale or to rent.
| Streets | Postcodes |
|---|---|
| Bailey Court | NG4 2LD |
| Barn Owl Close | NG20 0SH |
| Blankleys Yard | NG20 0SE |
| Britannia Court | NG4 2GX |
| Budby Crescent | NG20 9PN NG20 9PW |
| Carburton Avenue | NG20 9QJ |
| Carlton Business Centre | NG4 3AA |
| Caunton Close | NG20 9QD |
| Caxton Close | NG4 2JL |
| Church Close | NG20 0SA |
| Church Road | NG20 0SF NG20 0SL |
| Coggins Lane | NG20 0RP |
| Cuckney Hill | NG20 0SJ |
| Cupar Close | NG20 0RL |
| Drake Road | NG4 2SQ |
| Dronley Drive | NG20 0RW |
| Dunstan Street | NG4 2NX NG4 2SL |
| Eastland Terrace | NG20 9PT |
| Eastlands Lane | NG20 0SD |
| Egmanton Road | NG20 9PY NG20 9QB NG20 9QG NG20 9QN NG20 9QQ |
| Elkesley Road | NG20 9PR NG20 9PS |
| Glannis Square | NG20 0RN |
| Great Northern Way | NG4 2HD |
| Hallifax Avenue | NG20 0RY |
| Hatfield Avenue | NG20 9PH |
| Jackson Terrace | NG20 9PP |
| Kenrick Street | NG4 2AA |
| Kirton Close | NG20 9QZ |
| Kneesall Close | NG20 9QE |
| Laxton Drive | NG20 9QL |
| Manby Court | NG20 9QT |
| Manor Court | NG20 0SG |
| Manor Road | NG20 0RH NG20 0RQ |
| Maplebeck Avenue | NG20 9QH |
| Marston Avenue | NG20 9QS |
| Meden Glen | NG20 0RJ |
| Medenside | NG20 9QU |
| Melville Court | NG20 9QP |
| Midland Avenue | NG4 2LG |
| Morris Street | NG4 2HS |
| Netherfield Close | NG20 9QR |
| Netherfield Lane | NG20 9PD NG20 0RR NG20 0RS NG20 9PA NG20 9PB NG20 9PE NG20 9PF NG20 9RA |
| Ossington Close | NG20 9PZ |
| Perlethorpe Avenue | NG20 9QF |
| Pintail Close | NG4 2SG |
| Portland Crescent | NG20 9PJ |
| Prest Avenue | NG20 9PQ |
| Rectory Road | NG20 0RU NG20 0RX |
| Rufford Avenue | NG20 9PL |
| St Peters Avenue | NG20 0RZ |
| Thoresby Close | NG20 9QA |
| Tissington Avenue | NG20 0RT |
| Tuxford Avenue | NG20 9QW |
| Victoria Business Park | NG4 2PE |
| Victoria Parkway | NG4 2PA |
| Victoria Road | NG4 2HU NG4 2PD |
| Weetman Avenue | NG20 0SB |
| Wright Street | NG4 2PG |
Property price trends in Netherfield
According to the latest Land Registry data, the average home in Netherfield sold for £166,459 in 2025. That figure comes from 1,136 sales logged over the past 30 years.
Prices have fallen back over the last three years. Compared with 2022, when the typical sale came in around £185,884, that's a fall of roughly 10.5%.
Looking back five years, average prices are up about 23.8% since 2020, a gain of around £31,955 in cash terms.
Zoom out to the past decade for the fuller picture. Back in 2015, homes here averaged £96,725, so the typical sold price has climbed about 72.1% since then, roughly 5.6% a year. Stretch the view to fifteen years and that annual pace eases back to about 2.7%.
Frequently asked questions about Netherfield
What is the average price for a property for sale in Netherfield?
The average price for a property for sale in Netherfield is £170,427. This amount is 12% lower than the average price in Mansfield. There are more than 10,000 property listings for sale in Netherfield.
What streets have the most expensive properties for sale in Netherfield?
The streets with the most expensive properties for sale in Netherfield are Eastlands Lane at an average of £382,500, Barn Owl Close at an average of £372,500 and Church Road at an average of £337,500.
What streets have the most affordable properties for sale in Netherfield?
The streets with the most affordable properties for sale in Netherfield are Ossington Close at an average of £80,000, Morris Street at an average of £103,333 and Jackson Terrace at an average of £112,750.
Which train stations are available in or near Netherfield?
Some of the train stations available in or near Netherfield are Mansfield Woodhouse, Mansfield Town and Shirebrook (Derbys).
Property Price Paid in Netherfield by Year
The average sold property price by year was:
| Year | Average Sold Price | Price Change |
Sold Properties

|
|---|---|---|---|
| 2025 | £166,459 | 
1% |
37 Properties |
| 2024 | £164,150 | 
-16% |
40 Properties |
| 2023 | £190,325 |
2% |
20 Properties |
| 2022 | £185,884 |
21% |
43 Properties |
| 2021 | £146,360 |
8% |
34 Properties |
| 2020 | £134,504 |
-7% |
28 Properties |
| 2019 | £144,208 |
10% |
36 Properties |
| 2018 | £129,314 |
16% |
45 Properties |
| 2017 | £108,983 |
4% |
49 Properties |
| 2016 | £104,945 |
8% |
46 Properties |
Property Price per Property Type in Netherfield
Here you can find historic sold price data in order to help with your property search.
The average Property Paid Price for specific property types in the last three years are:
| Property Type | Average Sold Price | Sold Properties |
|---|---|---|
| Semi Detached House | £149,871.00 | 39 Semi Detached Houses |
| Detached House | £283,309.00 | 21 Detached Houses |
| Terraced House | £132,787.00 | 33 Terraced Houses |
| Flat | £88,750.00 | 4 Flats |
