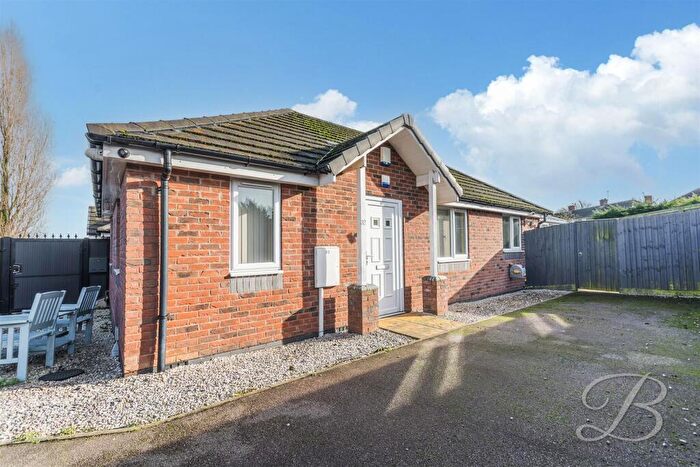
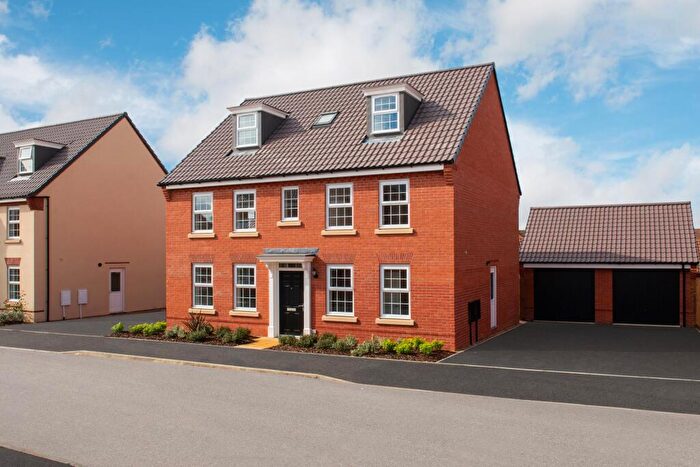
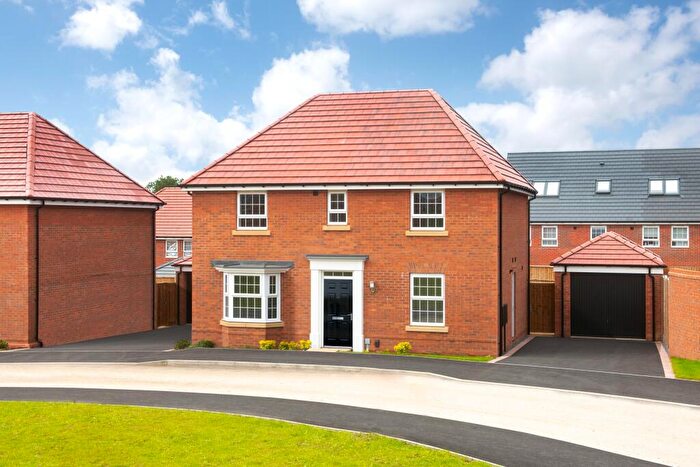
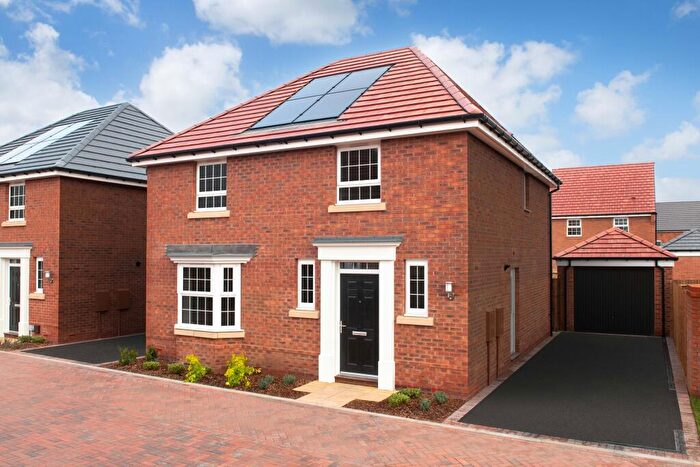
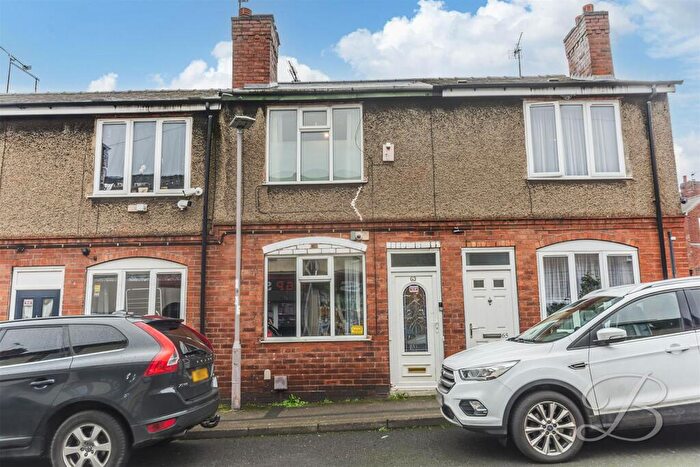
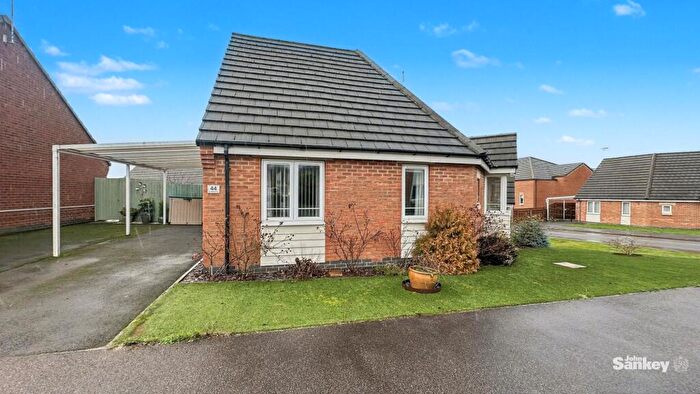
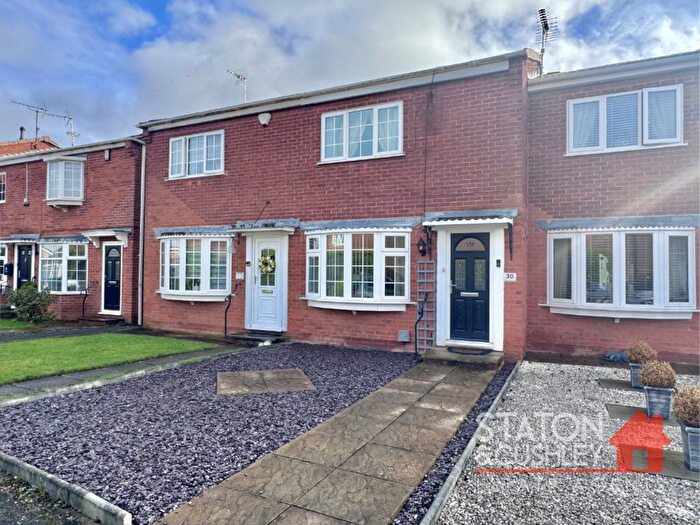
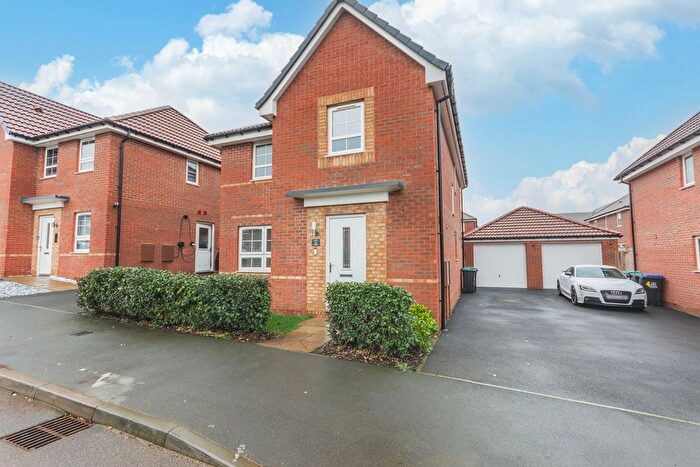
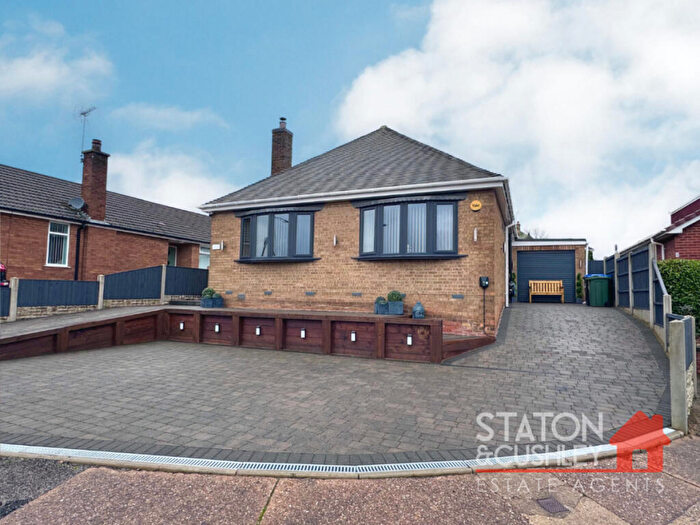
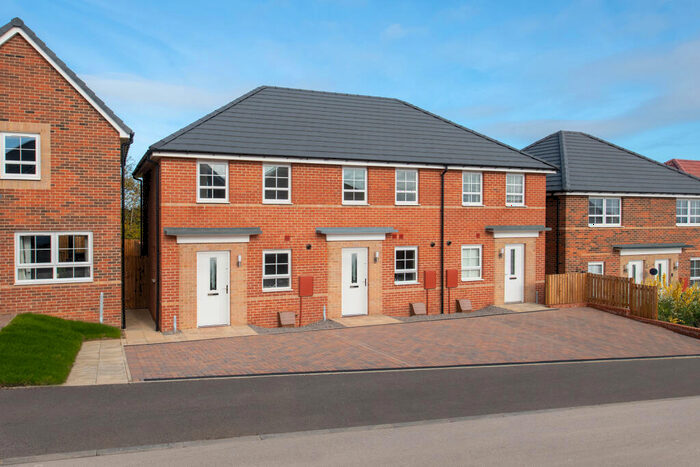
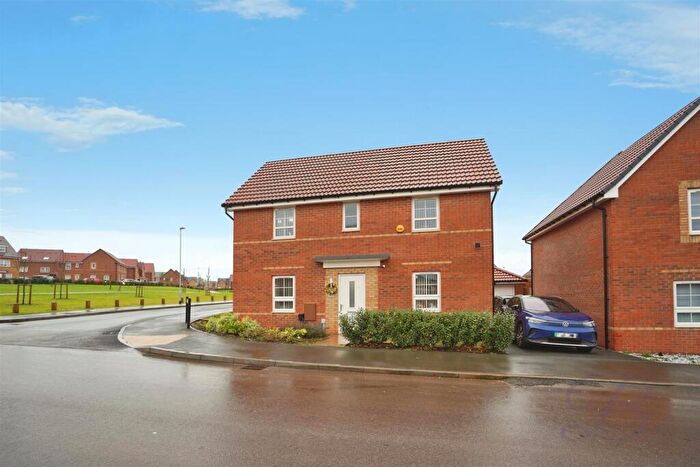
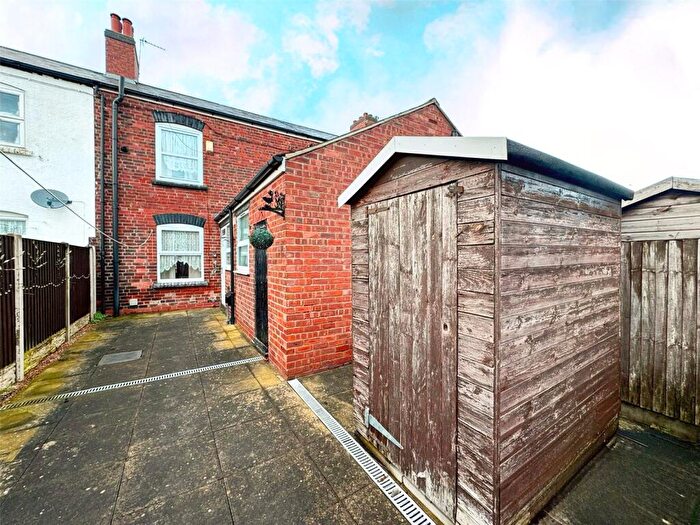
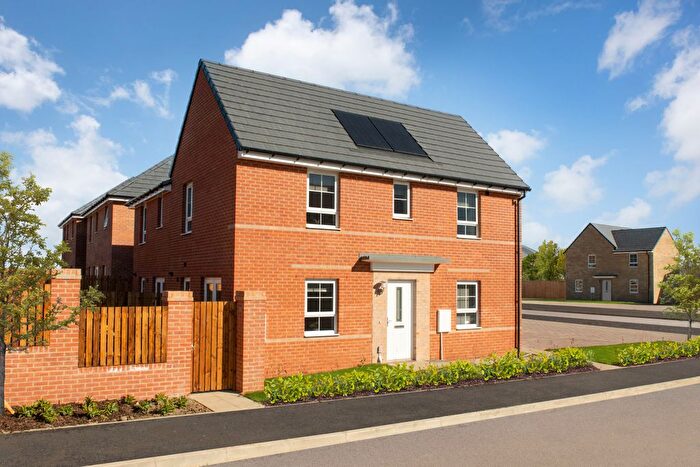
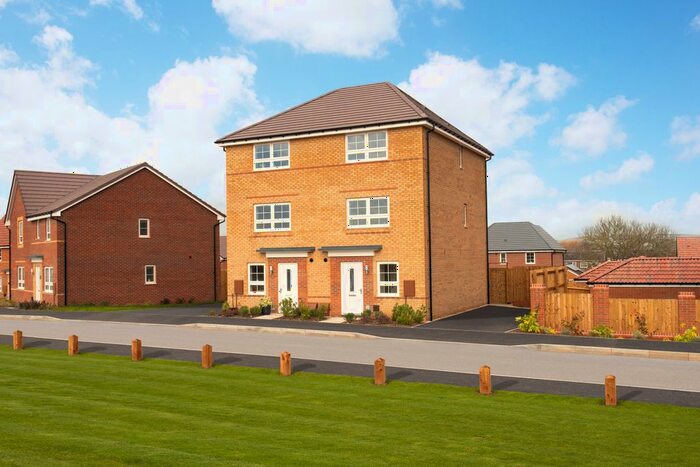
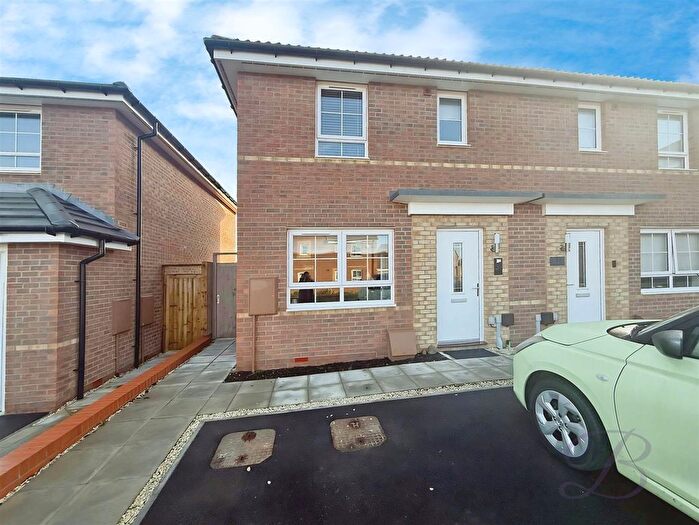
Houses for sale & to rent in Warsop Carrs, Mansfield
House Prices in Warsop Carrs
Properties in Warsop Carrs have an average house price of £193,302.00 and had 138 Property Transactions within the last 3 years¹.
Warsop Carrs is an area in Mansfield, Nottinghamshire with 1,269 households², where the most expensive property was sold for £525,000.00.
Properties for sale in Warsop Carrs
Roads and Postcodes in Warsop Carrs
Navigate through our locations to find the location of your next house in Warsop Carrs, Mansfield for sale or to rent.
| Streets | Postcodes |
|---|---|
| Argyle Close | NG20 0JH |
| Avocet Place | NG20 8XZ |
| Birch Street | NG20 0ST NG20 0TA NG20 0TD |
| Bishops Meadows | NG20 0SQ |
| Bishops Walk | NG20 0SN NG20 0SW |
| Carr Lane | NG20 0BN |
| Carter Lane | NG20 8XA NG20 8XD NG20 8XE NG20 8XF NG20 0SP NG20 8XB NG20 8XT |
| Church Street | NG20 0AU NG20 0AL NG20 0BP |
| Coral Crescent | NG20 0FP |
| Cumberland Avenue | NG20 0JJ |
| Dotterel Place | NG20 8XU |
| East Street | NG20 8YF |
| Elm Grove | NG20 0TW |
| Greendale Close | NG20 0EB |
| Greenshank Close | NG20 8YL |
| Greenshank Road | NG20 8YH |
| Grove Road | NG20 0TJ |
| Hamilton Drive | NG20 0EX NG20 0EY |
| Hewett Street | NG20 8XN |
| High Street | NG20 0BZ |
| King Road | NG20 0BH NG20 0BQ |
| King Street | NG20 8XW |
| Laurel Avenue | NG20 0TE NG20 0TF NG20 0TG |
| Lilac Grove | NG20 0SX |
| Lime Crescent | NG20 0SU NG20 0SY NG20 0SZ |
| New Villas | NG20 8XP |
| Norfolk Close | NG20 0EZ |
| North Street | NG20 8XQ |
| Ocean Drive | NG20 0FD |
| Oyster Way | NG20 0FG |
| Pearl Gardens | NG20 0FE |
| Poplar Grove | NG20 0TP |
| Red Oaks Court | NG20 0FB |
| Reef Close | NG20 0FL |
| River View | NG20 0BS |
| Riverside View | NG20 0FF |
| Rugby Park View | NG20 8GE |
| Rutland Close | NG20 0DY |
| Sandpiper Place | NG20 8XY |
| Saville Way | NG20 0DZ |
| Stonebridge Lane | NG20 0DS |
| Stonebridge Road | NG20 0DT NG20 0DU |
| Sycamore Street | NG20 0TH NG20 0TL NG20 0TN NG20 0TQ |
| The Carrs | NG20 0AT |
| The Rocks | NG20 8XG |
| The Willows | NG20 0BT |
| Vermont Close | NG20 0TR |
| Warsop Vale | NG20 8XR |
| Waterfield Avenue | NG20 0FH |
| West Street | NG20 8XL |
| Wheatsheaf Terrace | NG20 8XH |
| Windsor Drive | NG20 0DX |
| Wood Lane | NG20 0SR NG20 0SS |
| Wood Street | NG20 0AX |
| York Terrace | NG20 0BJ NG20 0BL |
Transport near Warsop Carrs
-
Shirebrook (Derbys) Station
-
Langwith Station
-
Mansfield Woodhouse Station
-
Creswell (Derbys) Station
-
Mansfield Town Station
- FAQ
- Price Paid By Year
- Property Type Price
Frequently asked questions about Warsop Carrs
What is the average price for a property for sale in Warsop Carrs?
The average price for a property for sale in Warsop Carrs is £193,302. This amount is 0.53% lower than the average price in Mansfield. There are 629 property listings for sale in Warsop Carrs.
What streets have the most expensive properties for sale in Warsop Carrs?
The streets with the most expensive properties for sale in Warsop Carrs are Bishops Meadows at an average of £454,000, Riverside View at an average of £348,200 and York Terrace at an average of £298,316.
What streets have the most affordable properties for sale in Warsop Carrs?
The streets with the most affordable properties for sale in Warsop Carrs are Carter Lane at an average of £92,500, Wood Lane at an average of £96,000 and Sycamore Street at an average of £101,357.
Which train stations are available in or near Warsop Carrs?
Some of the train stations available in or near Warsop Carrs are Shirebrook (Derbys), Langwith and Mansfield Woodhouse.
Property Price Paid in Warsop Carrs by Year
The average sold property price by year was:
| Year | Average Sold Price | Price Change |
Sold Properties
|
|---|---|---|---|
| 2025 | £191,541 | -2% |
45 Properties |
| 2024 | £195,721 | 2% |
49 Properties |
| 2023 | £192,409 | 6% |
44 Properties |
| 2022 | £180,003 | 6% |
68 Properties |
| 2021 | £168,596 | 8% |
72 Properties |
| 2020 | £154,961 | 9% |
56 Properties |
| 2019 | £140,799 | -7% |
65 Properties |
| 2018 | £150,899 | 17% |
55 Properties |
| 2017 | £125,481 | -2% |
59 Properties |
| 2016 | £128,297 | -13% |
110 Properties |
| 2015 | £144,454 | 18% |
102 Properties |
| 2014 | £118,746 | 8% |
94 Properties |
| 2013 | £109,800 | 17% |
59 Properties |
| 2012 | £91,100 | -16% |
50 Properties |
| 2011 | £105,835 | -21% |
57 Properties |
| 2010 | £128,213 | 8% |
65 Properties |
| 2009 | £117,456 | 9% |
59 Properties |
| 2008 | £107,038 | 13% |
84 Properties |
| 2007 | £93,382 | 3% |
37 Properties |
| 2006 | £90,986 | 16% |
63 Properties |
| 2005 | £76,771 | 7% |
52 Properties |
| 2004 | £71,575 | 21% |
66 Properties |
| 2003 | £56,402 | 32% |
45 Properties |
| 2002 | £38,230 | -3% |
69 Properties |
| 2001 | £39,251 | 13% |
50 Properties |
| 2000 | £34,284 | -17% |
41 Properties |
| 1999 | £39,994 | 17% |
41 Properties |
| 1998 | £33,273 | 16% |
42 Properties |
| 1997 | £28,043 | -18% |
37 Properties |
| 1996 | £32,987 | 7% |
30 Properties |
| 1995 | £30,721 | - |
24 Properties |
Property Price per Property Type in Warsop Carrs
Here you can find historic sold price data in order to help with your property search.
The average Property Paid Price for specific property types in the last three years are:
| Property Type | Average Sold Price | Sold Properties |
|---|---|---|
| Semi Detached House | £167,387.00 | 58 Semi Detached Houses |
| Detached House | £275,189.00 | 44 Detached Houses |
| Terraced House | £134,969.00 | 36 Terraced Houses |

