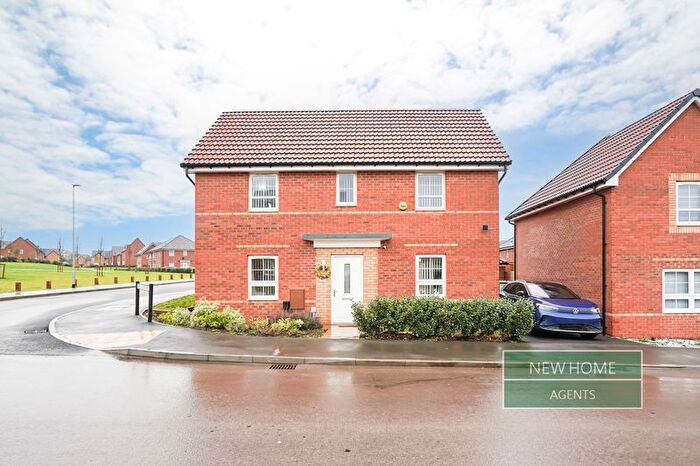
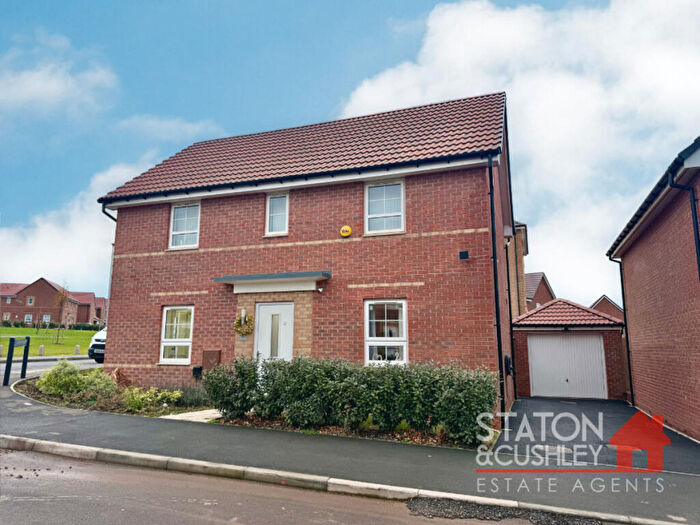
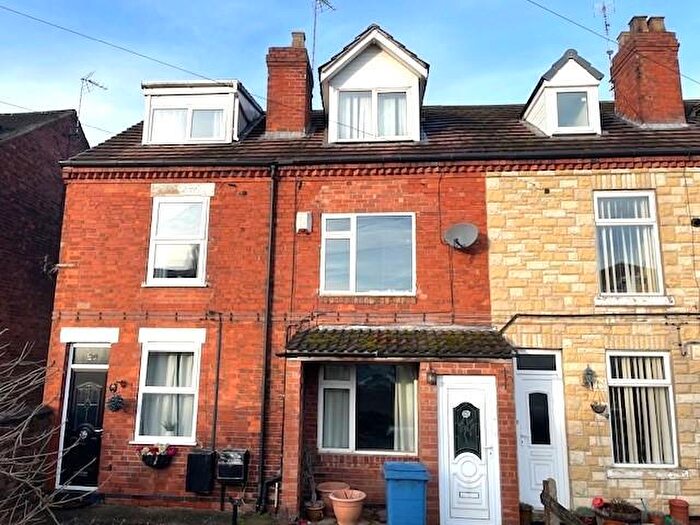
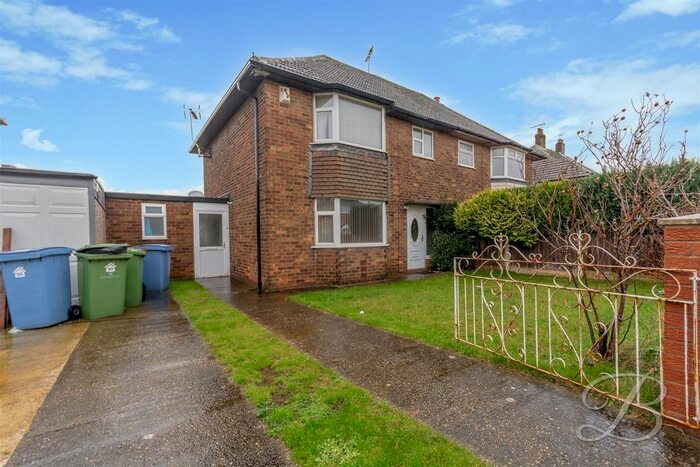
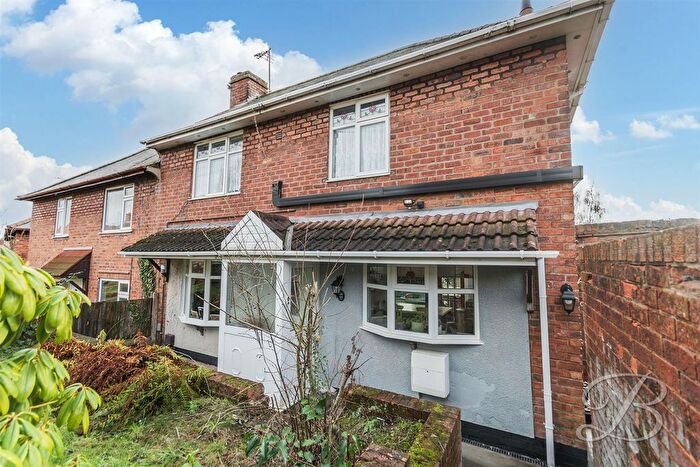
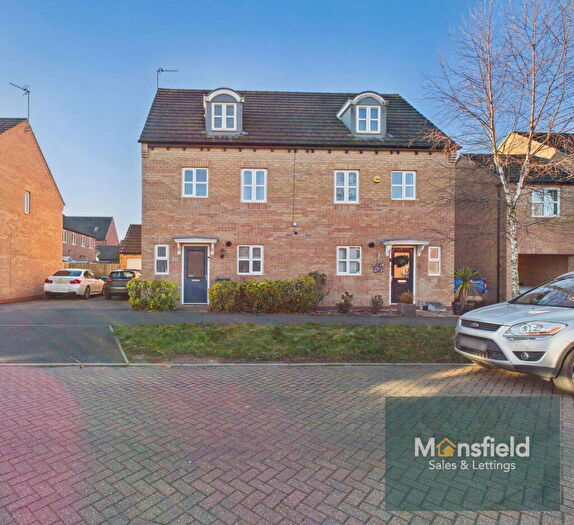
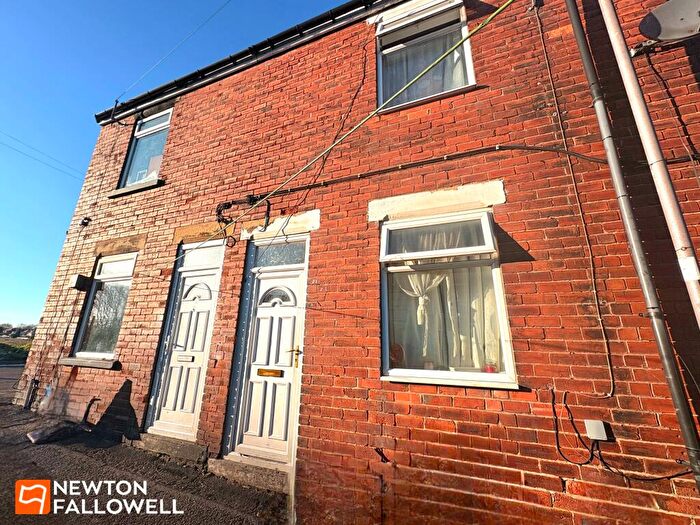
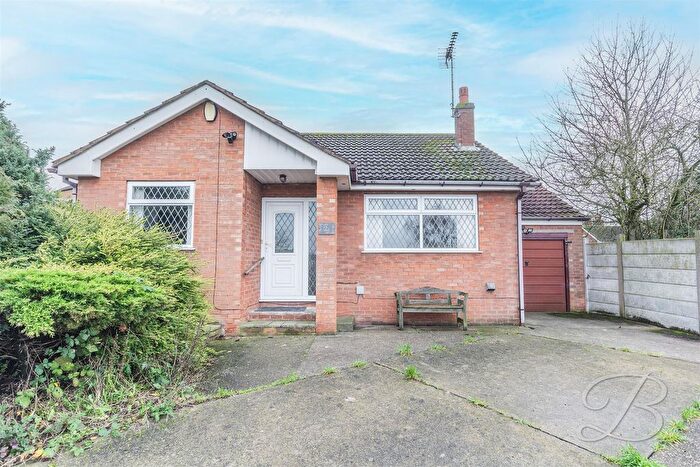
Houses for sale & to rent in Market Warsop, Mansfield
House Prices in Market Warsop
Properties in Market Warsop have an average house price of £140,596.00 and had 110 Property Transactions within the last 3 years¹.
Market Warsop is an area in Mansfield, Nottinghamshire with 1,247 households², where the most expensive property was sold for £395,000.00.
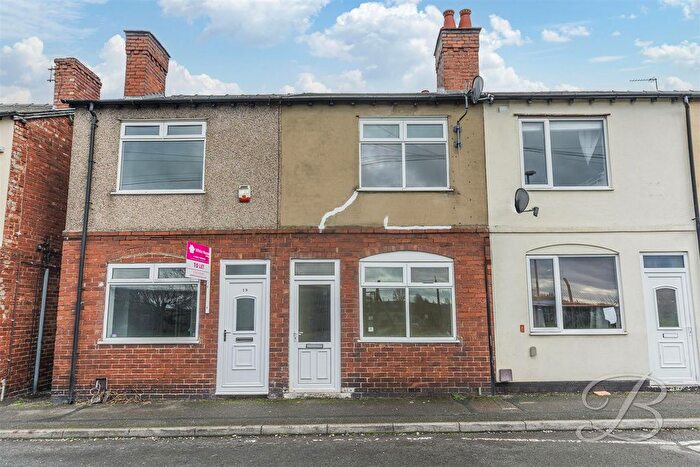
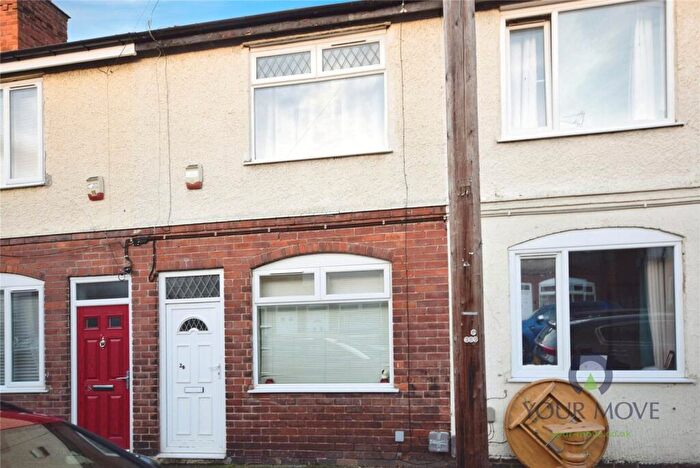
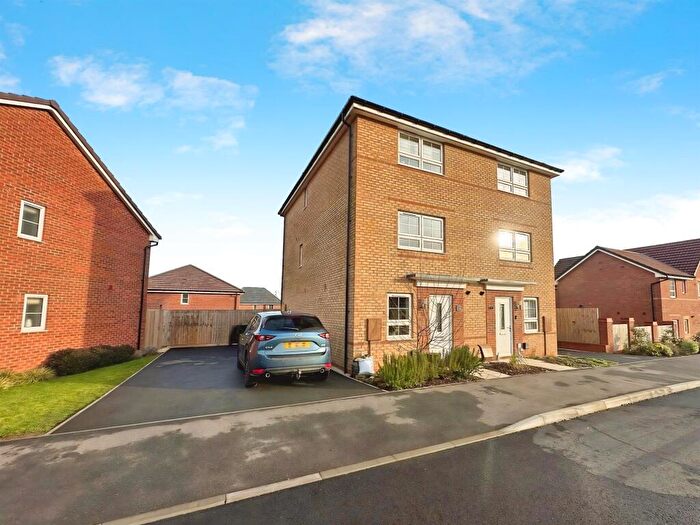
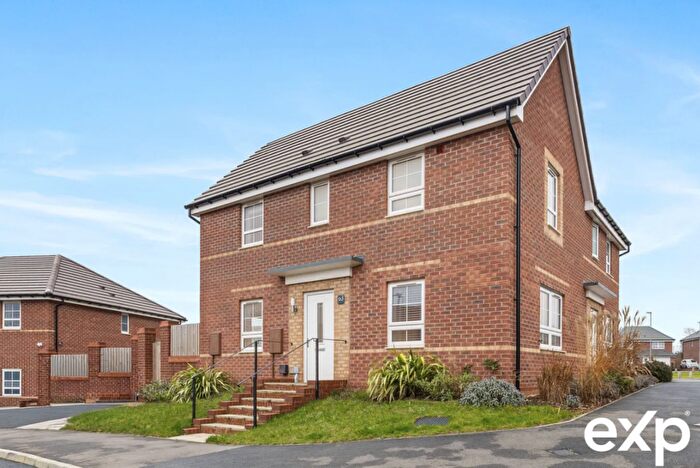
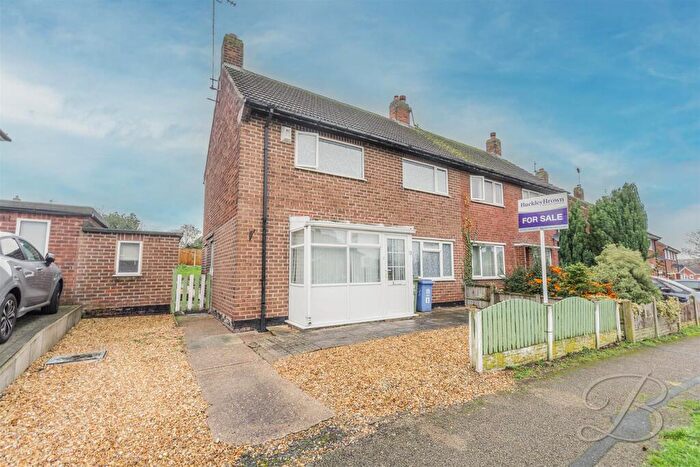
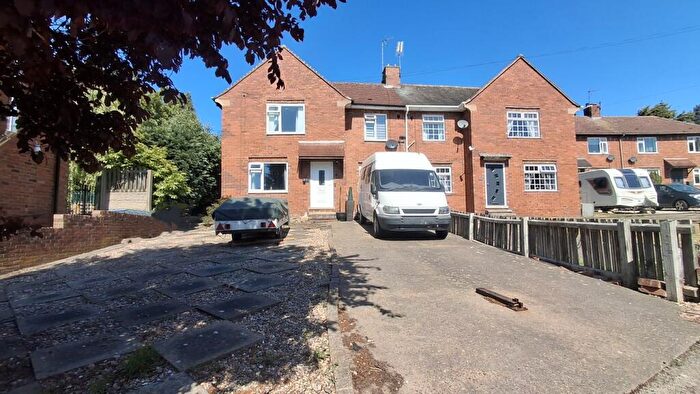
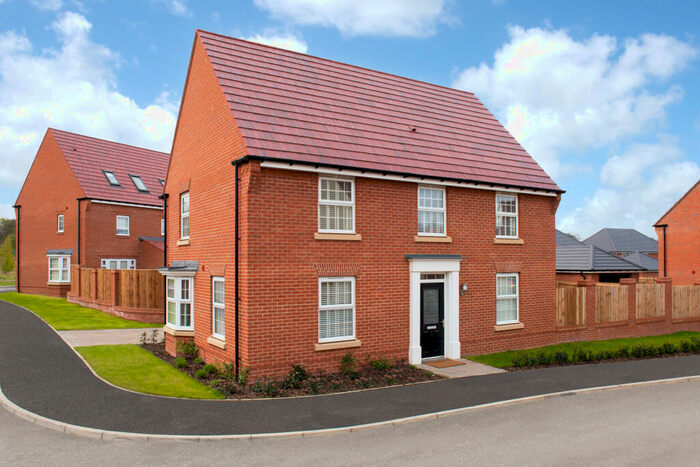
Properties for sale in Market Warsop
Roads and Postcodes in Market Warsop
Navigate through our locations to find the location of your next house in Market Warsop, Mansfield for sale or to rent.
| Streets | Postcodes |
|---|---|
| Asgard Avenue | NG20 0GA NG20 0GB |
| Askew Lane | NG20 0DD |
| Bainbridge Road | NG20 0ND NG20 0NE |
| Bentinck Terrace | NG20 0LF |
| Blackberry Way | NG20 0BU |
| Bradleys Yard | NG20 0AD |
| Cedars Close | NG20 0FJ |
| Church Street | NG20 0AQ |
| Clumber Court | NG20 0LP |
| Clumber Street | NG20 0LR NG20 0LS NG20 0LT NG20 0LU NG20 0LX |
| Coach Road | NG20 0HN |
| Cottage Lane | NG20 0HR |
| Day Street | NG20 0NG |
| Elmfield | NG20 0ED |
| Fenwick Street | NG20 0NH |
| Hammerwater Drive | NG20 0DJ NG20 0DL |
| High Street | NG20 0AA NG20 0AB NG20 0AG NG20 0BY NG20 0AE |
| Leeming Lane North | NG19 8LJ NG19 9EE |
| Little John Avenue | NG20 0HZ NG20 0JA |
| Longden Terrace | NG20 0NQ |
| Mansfield Road | NG20 0DB NG20 0DE NG20 0DF NG20 0DG NG20 0EA NG20 0EF NG20 0EG NG20 0EL NG20 0EQ NG20 0EN |
| Manvers Street | NG20 0NN |
| Mayfield Terrace | NG20 0LE |
| Meadow Place | NG20 0DH |
| Morven Terrace | NG20 0LG |
| Mosscar Close | NG20 0BW |
| Muschamp Terrace | NG20 0NL |
| Newcastle Street | NG20 0NF |
| Oakfield Avenue | NG20 0LH NG20 0LQ |
| Oakfield Lane | NG20 0JE NG20 0JF NG20 0JG NG20 0JQ |
| Oakfield Row | NG20 0GX |
| Osbourne Yard | NG20 0LY |
| Pavilion Close | NG20 0NT |
| Peafield Lane | NG20 0EW |
| Portland Street | NG20 0LZ |
| Ridgeway Lane | NG20 0LJ NG20 0NP |
| Ridgeway Terrace | NG20 0NW |
| Robin Hood Avenue | NG20 0HS NG20 0HT NG20 0JB NG20 0JD |
| Sherwood Street | NG20 0HQ NG20 0JN NG20 0JT NG20 0JW NG20 0JY |
| Sookholme Drive | NG20 0DN |
| Sookholme Lane | NG20 0DW |
| Sookholme Road | NG19 8GA NG19 8LL NG19 8LN |
| Spion Park Mews | NG20 0EH |
| The Hawthorns | NG20 0DP NG20 0DR |
| The Homesteads | NG20 0JS |
| The Wickets | NG20 0GY |
| Titchfield Street | NG20 0LB |
| Vale Avenue | NG20 0DQ |
| Vickers Street | NG20 0NJ |
| Watson Street | NG20 0NB |
| Welbeck Street | NG20 0NA |
| Wellington Close | NG20 0JL |
| Woodlands Way | NG20 0FN |
| NG19 8LP NG19 8LW NG20 0NS NG20 0YD |
Transport near Market Warsop
- FAQ
- Price Paid By Year
- Property Type Price
Frequently asked questions about Market Warsop
What is the average price for a property for sale in Market Warsop?
The average price for a property for sale in Market Warsop is £140,596. This amount is 27% lower than the average price in Mansfield. There are 624 property listings for sale in Market Warsop.
What streets have the most expensive properties for sale in Market Warsop?
The streets with the most expensive properties for sale in Market Warsop are Oakfield Avenue at an average of £225,750, The Wickets at an average of £215,750 and Sookholme Drive at an average of £194,000.
What streets have the most affordable properties for sale in Market Warsop?
The streets with the most affordable properties for sale in Market Warsop are Fenwick Street at an average of £72,892, Vickers Street at an average of £72,895 and Clumber Street at an average of £85,750.
Which train stations are available in or near Market Warsop?
Some of the train stations available in or near Market Warsop are Shirebrook (Derbys), Mansfield Woodhouse and Langwith.
Property Price Paid in Market Warsop by Year
The average sold property price by year was:
| Year | Average Sold Price | Price Change |
Sold Properties
|
|---|---|---|---|
| 2025 | £149,427 | 7% |
37 Properties |
| 2024 | £139,164 | 4% |
32 Properties |
| 2023 | £133,746 | -7% |
41 Properties |
| 2022 | £142,458 | 10% |
43 Properties |
| 2021 | £128,653 | 5% |
75 Properties |
| 2020 | £122,726 | 5% |
41 Properties |
| 2019 | £116,998 | -6% |
45 Properties |
| 2018 | £123,460 | 14% |
53 Properties |
| 2017 | £106,392 | 3% |
55 Properties |
| 2016 | £103,462 | -8% |
54 Properties |
| 2015 | £111,476 | 11% |
44 Properties |
| 2014 | £99,101 | -12% |
54 Properties |
| 2013 | £110,925 | 2% |
60 Properties |
| 2012 | £108,781 | -2% |
57 Properties |
| 2011 | £111,091 | 4% |
54 Properties |
| 2010 | £106,441 | 27% |
30 Properties |
| 2009 | £77,694 | -55% |
19 Properties |
| 2008 | £120,135 | 20% |
47 Properties |
| 2007 | £96,464 | 2% |
57 Properties |
| 2006 | £94,906 | 9% |
69 Properties |
| 2005 | £86,559 | 2% |
51 Properties |
| 2004 | £84,829 | 28% |
77 Properties |
| 2003 | £61,306 | 36% |
71 Properties |
| 2002 | £39,029 | 14% |
49 Properties |
| 2001 | £33,631 | 1% |
47 Properties |
| 2000 | £33,271 | -2% |
30 Properties |
| 1999 | £33,974 | -7% |
33 Properties |
| 1998 | £36,427 | 24% |
41 Properties |
| 1997 | £27,861 | 0,2% |
46 Properties |
| 1996 | £27,795 | -29% |
37 Properties |
| 1995 | £35,981 | - |
30 Properties |
Property Price per Property Type in Market Warsop
Here you can find historic sold price data in order to help with your property search.
The average Property Paid Price for specific property types in the last three years are:
| Property Type | Average Sold Price | Sold Properties |
|---|---|---|
| Semi Detached House | £148,646.00 | 48 Semi Detached Houses |
| Detached House | £254,041.00 | 12 Detached Houses |
| Terraced House | £107,391.00 | 45 Terraced Houses |
| Flat | £89,900.00 | 5 Flats |

