Houses for sale & to rent in Farndon, Newark
House Prices in Farndon
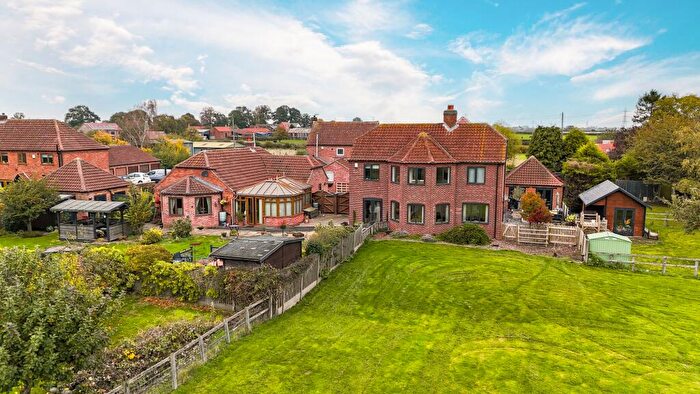
Properties in Farndon have an average house price of £275,242.00 and had 323 Property Transactions within the last 3 years¹.
Farndon is an area in Newark, Nottinghamshire with 2,379 households², where the most expensive property was sold for £1,250,000.00.
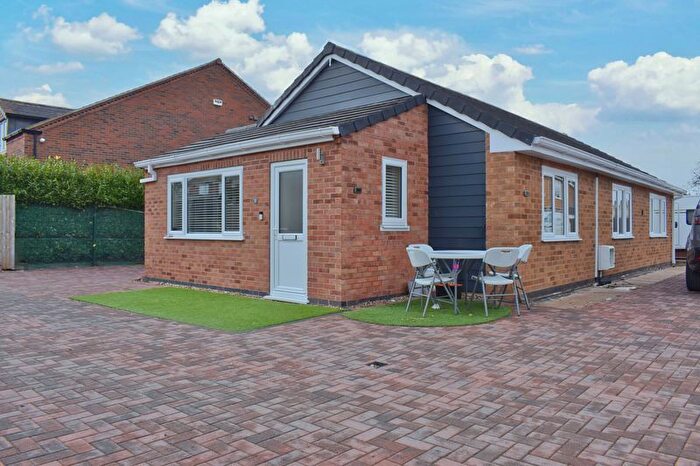
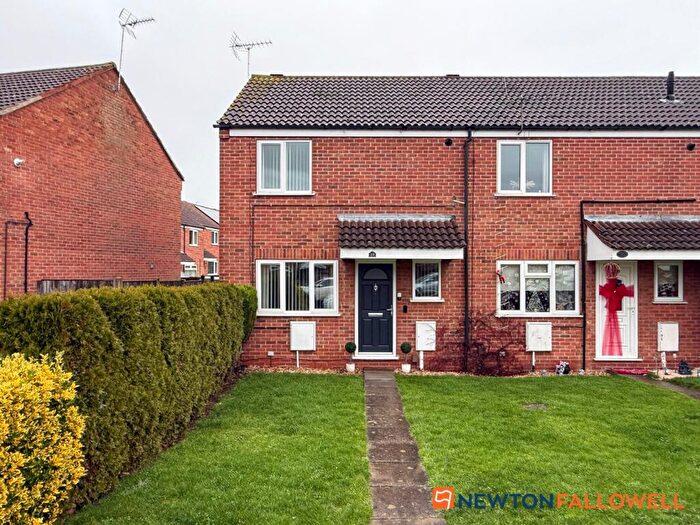
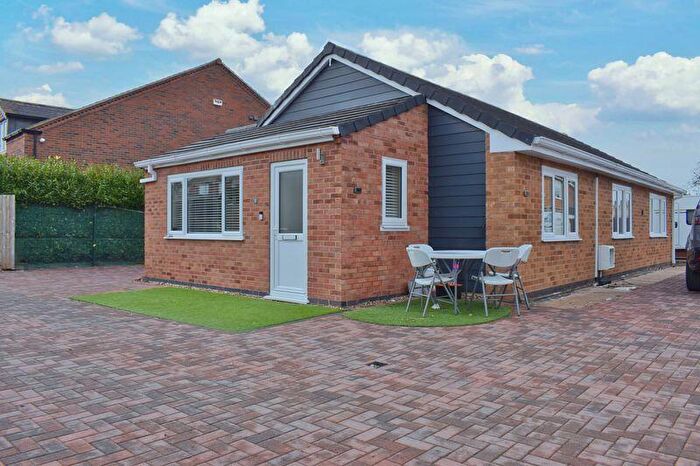
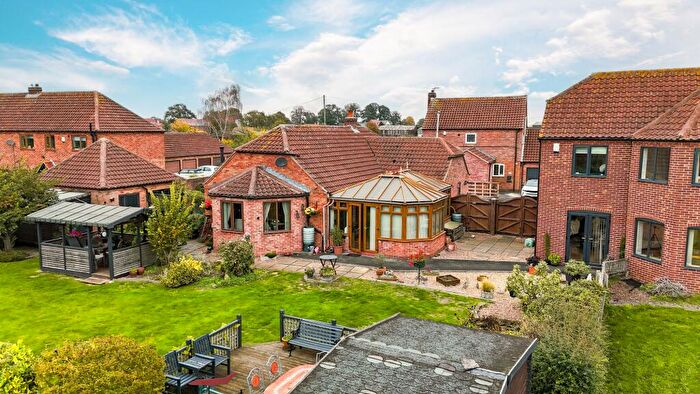
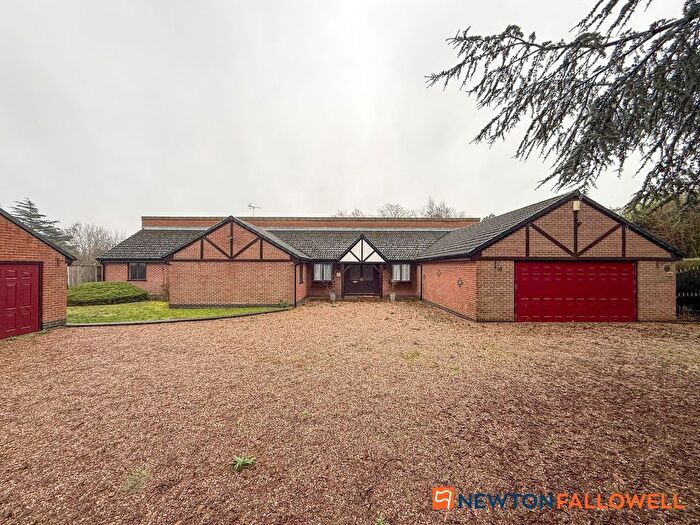
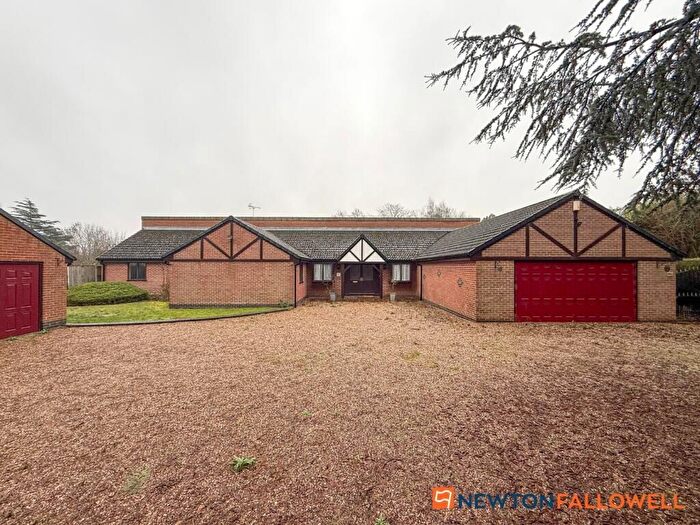
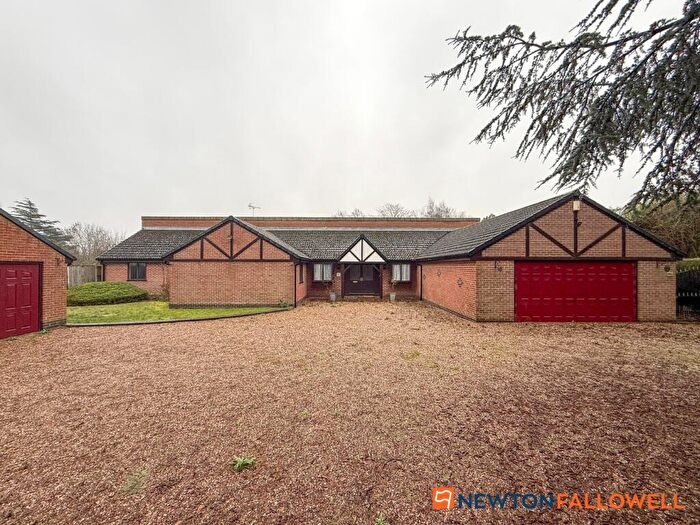
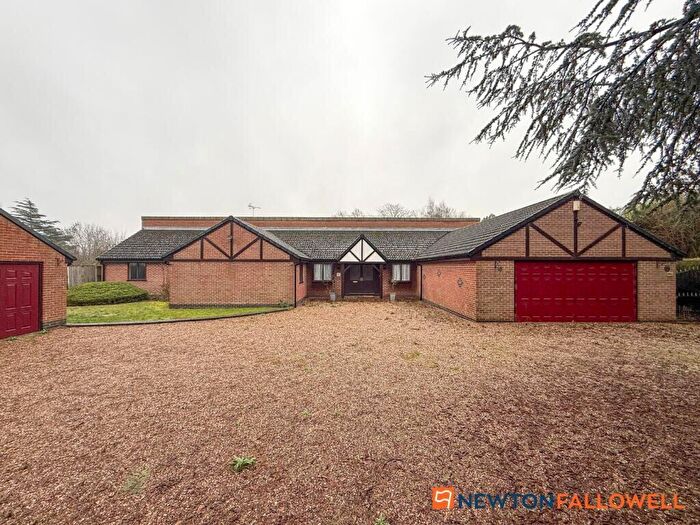
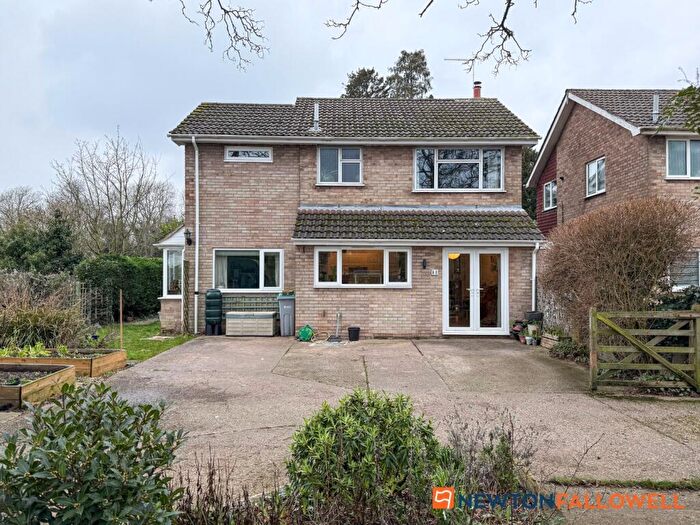
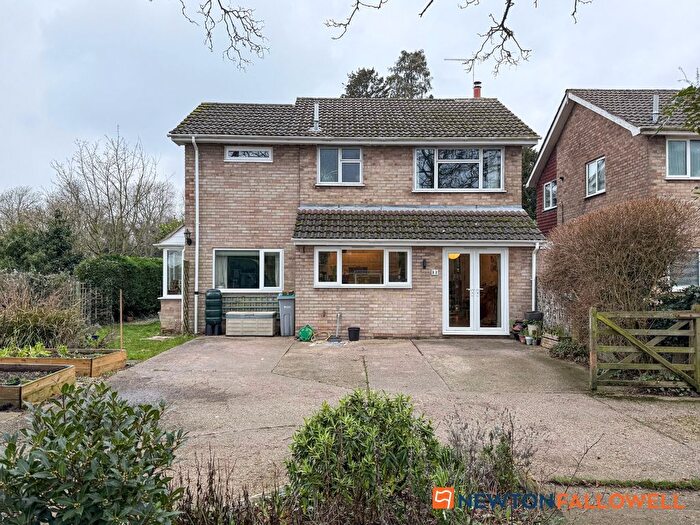
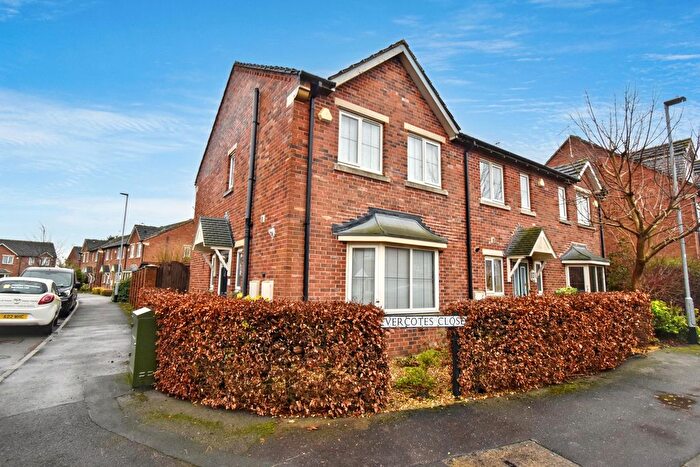
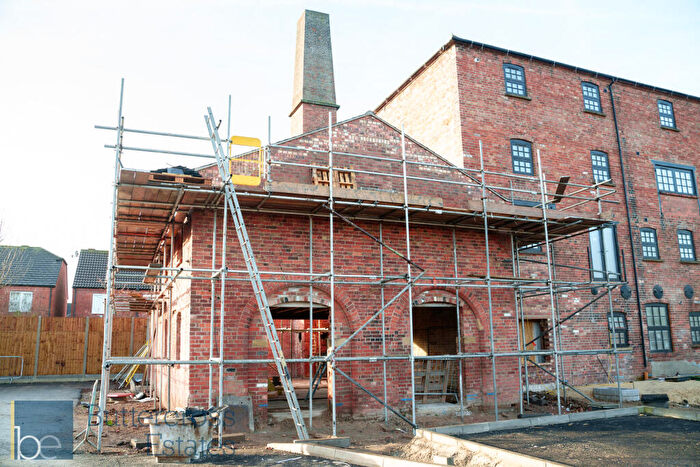
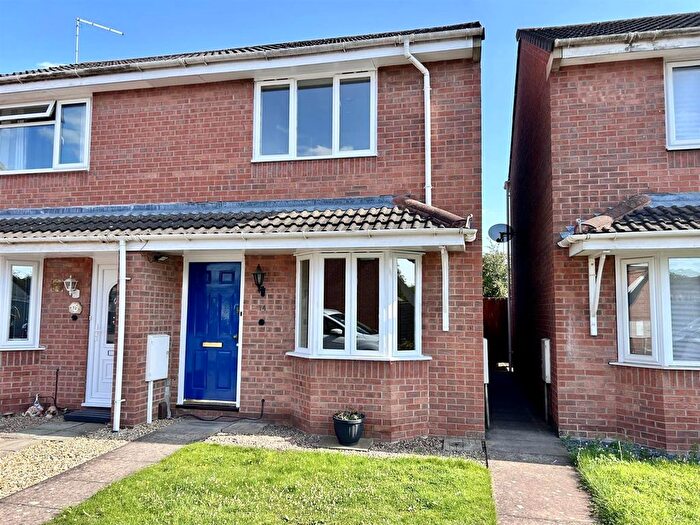
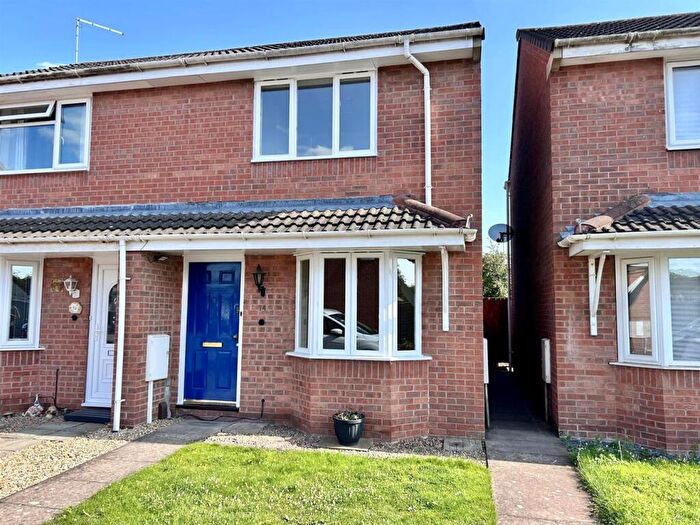
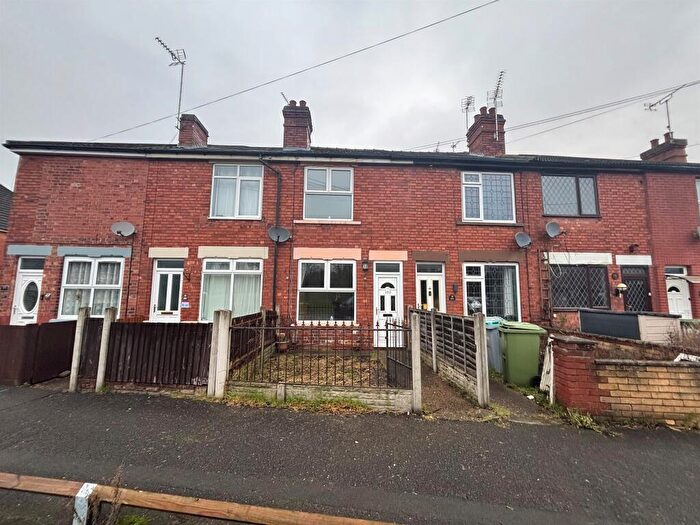
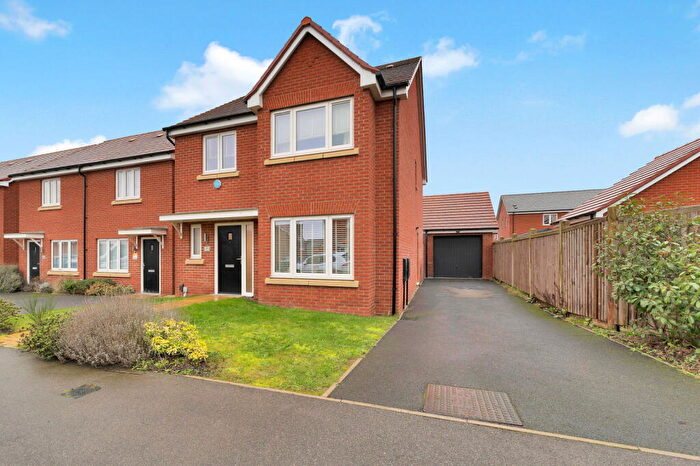
Properties for sale in Farndon
Roads and Postcodes in Farndon
Navigate through our locations to find the location of your next house in Farndon, Newark for sale or to rent.
| Streets | Postcodes |
|---|---|
| Ainsdale Close | NG24 3FP |
| Almond Grove | NG24 3TD |
| Apple Avenue | NG24 3US |
| Birchenall Court | NG24 3TR |
| Blackberry Way | NG24 3UN |
| Bowbridge Lane | NG24 3BZ |
| Brockton Avenue | NG24 4TH |
| Brownlow Close | NG23 5QN |
| California Road | NG24 3SB |
| Camdale Lane | NG24 3RH |
| Cameron Lane | NG24 3GE |
| Carmelita Avenue | NG24 3WE |
| Carnell Lane | NG24 3FS |
| Carrgate Lane | NG23 5NU |
| Central Drive | NG23 5NT |
| Chapel Lane | NG24 3SR |
| Chestnut Grove | NG24 3TW |
| Chilton Cottages | NG24 3SW |
| Church Lane | NG23 5QF |
| Claypole Lane | NG24 3JN |
| Collinson Lane | NG24 3GJ |
| Cormack Lane | NG24 3GF |
| Cross Lane | NG24 3SH |
| Dale Crescent | NG24 3JT |
| Dale Way | NG24 3GH |
| Deeke Road | NG24 3UF |
| Dovedale Terrace | NG24 3UU |
| Elston Lane | NG23 5PB NG23 5QJ |
| Farndon Lane | NG24 3RT |
| Fell Croft | NG24 3TB |
| Fosse Court | NG24 4TL |
| Fosse Road | NG23 5NG NG23 5NQ NG23 5QH NG23 5QQ NG24 3SE NG24 3SF NG24 3TJ NG24 3TL NG24 4ST |
| Gardiner Avenue | NG24 3RG |
| Gilbert Way | NG24 3FX |
| Gilmores Lane | NG24 3GX |
| Goldstraw Lane | NG24 3FD NG24 3FF NG24 3FQ NG24 3RZ |
| Goodwin Lane | NG24 3GW |
| Grays Court | NG24 3UD |
| Great North Road | NG24 3JU NG24 3JW |
| Green Gate | NG23 5NF |
| Hawksworth Lane | NG23 5NB |
| Hawthorne Crescent | NG24 3TG |
| Hawton Lane | NG24 3SD |
| Holmefield | NG24 3TZ |
| Honey Lane | NG23 5PU |
| Howitts Field | NG24 3TU |
| Humber Lane | NG23 5QG |
| Hunters Road | NG24 3WB |
| Jackson Court | NG24 3TS |
| Johnsons Road | NG24 3RF |
| Linton Close | NG24 4TQ |
| Long Lane | NG24 4SU NG24 4TX |
| Longhedge Lane | NG23 5NH |
| Low Street | NG23 5PA |
| Main Street | NG23 5NE NG23 5PX NG24 3SA |
| Marrison Court | NG24 3UJ |
| Marron Close | NG24 3UR |
| Marron Court | NG24 3WT |
| Marsh Lane | NG24 3SS NG24 3SZ NG24 3TA NG24 4SZ NG24 4TA NG24 4TF NG24 4TG |
| Mill Road | NG23 5NR |
| Moor Lane | NG23 5NA NG23 5PY NG23 5PZ NG23 5QD |
| Naysfield Mews | NG24 3RY |
| Newark Road | NG23 5JS NG24 3RP NG24 3RW |
| North End | NG24 3SX |
| Nursery Avenue | NG24 3SY |
| Oak Avenue | NG24 3TQ |
| Oakfield Road | NG24 3FT |
| Old Chapel Lane | NG23 5NY |
| Old Hall Close | NG24 3SQ |
| Orchid Drive | NG24 3TX |
| Pach Way | NG24 3UP |
| Paddocks Close | NG23 5PJ |
| Parsons Close | NG24 3UX |
| Phoenix Lane | NG24 3UA |
| Pine Close | NG24 3FR |
| Pinfold Lane | NG23 5PD |
| Plum Way | NG24 3JH |
| Pond Close | NG24 3RU |
| Prebend Close | NG24 3SJ |
| Primrose Avenue | NG24 3TY |
| Read Close | NG24 3FY |
| Rosefield Close | NG24 3FW |
| Rubys Avenue | NG24 3RS |
| Rubys Walk | NG24 3FA NG24 3FZ |
| Sandhill Road | NG24 4TE |
| School Lane | NG23 5QL NG24 3SL |
| Spring Drive | NG24 3JS |
| St Peters Close | NG24 3SN |
| Station Road | NG23 5JY |
| Staveley Court | NG24 3UB |
| Sycamore Close | NG24 3RL |
| Syerston Hall Park | NG23 5NL |
| The Cedars | NG23 5ND |
| The Copse | NG24 3TF |
| The Green | NG23 5PF |
| The Lane | NG23 5JT |
| The Meadows | NG24 3TH |
| The Orchard | NG23 5PL |
| The Paddocks | NG23 5PH |
| The Row | NG23 5JU |
| The Spinney | NG23 5PE |
| The Willows | NG24 3TE |
| Thomas Road | NG24 3FU |
| Toad Lane | NG23 5NS |
| Top Street | NG23 5NP |
| Tow Court | NG24 3TT |
| Townhill Square | NG24 3WF |
| Tudor Oaks | NG23 5NW |
| Tutt Close | NG24 3UL |
| Village Close | NG24 4SY |
| Village Way | NG24 4SX |
| Walters Close | NG24 3UE |
| West End | NG24 3SG |
| Westfield Way | NG24 3TP |
| Williams Lane | NG24 3FN |
| Winston Drive | NG23 5NX |
| Wisdom Close | NG24 3WJ |
| Woodcock Terrace | NG24 3UW |
| Wyke Lane | NG24 3SP |
| Youngs Avenue | NG24 3FG |
| NG23 5NZ NG24 3RN |
Transport near Farndon
- FAQ
- Price Paid By Year
- Property Type Price
Frequently asked questions about Farndon
What is the average price for a property for sale in Farndon?
The average price for a property for sale in Farndon is £275,242. This amount is 11% higher than the average price in Newark. There are 3,934 property listings for sale in Farndon.
What streets have the most expensive properties for sale in Farndon?
The streets with the most expensive properties for sale in Farndon are Tudor Oaks at an average of £680,000, Syerston Hall Park at an average of £632,333 and School Lane at an average of £626,666.
What streets have the most affordable properties for sale in Farndon?
The streets with the most affordable properties for sale in Farndon are Hawthorne Crescent at an average of £97,250, Ainsdale Close at an average of £100,000 and Parsons Close at an average of £126,833.
Which train stations are available in or near Farndon?
Some of the train stations available in or near Farndon are Newark Castle, Newark North Gate and Rolleston.
Property Price Paid in Farndon by Year
The average sold property price by year was:
| Year | Average Sold Price | Price Change |
Sold Properties
|
|---|---|---|---|
| 2025 | £265,504 | -4% |
103 Properties |
| 2024 | £275,039 | -4% |
116 Properties |
| 2023 | £285,114 | 4% |
104 Properties |
| 2022 | £272,653 | 11% |
167 Properties |
| 2021 | £243,395 | 2% |
171 Properties |
| 2020 | £239,738 | 10% |
126 Properties |
| 2019 | £216,549 | 7% |
124 Properties |
| 2018 | £200,883 | 1% |
145 Properties |
| 2017 | £199,697 | -5% |
144 Properties |
| 2016 | £210,642 | 11% |
131 Properties |
| 2015 | £187,394 | -5% |
160 Properties |
| 2014 | £197,214 | 3% |
188 Properties |
| 2013 | £190,385 | 7% |
162 Properties |
| 2012 | £177,414 | -4% |
123 Properties |
| 2011 | £183,974 | 3% |
106 Properties |
| 2010 | £178,863 | -1% |
107 Properties |
| 2009 | £180,909 | -2% |
131 Properties |
| 2008 | £185,091 | 0,3% |
142 Properties |
| 2007 | £184,607 | -1% |
248 Properties |
| 2006 | £185,784 | 13% |
234 Properties |
| 2005 | £161,838 | -7% |
232 Properties |
| 2004 | £172,975 | 5% |
223 Properties |
| 2003 | £164,681 | 8% |
137 Properties |
| 2002 | £151,475 | 17% |
163 Properties |
| 2001 | £125,050 | 21% |
113 Properties |
| 2000 | £99,117 | 17% |
106 Properties |
| 1999 | £82,227 | -3% |
79 Properties |
| 1998 | £84,501 | 23% |
81 Properties |
| 1997 | £65,464 | -17% |
85 Properties |
| 1996 | £76,780 | 9% |
49 Properties |
| 1995 | £70,236 | - |
67 Properties |
Property Price per Property Type in Farndon
Here you can find historic sold price data in order to help with your property search.
The average Property Paid Price for specific property types in the last three years are:
| Property Type | Average Sold Price | Sold Properties |
|---|---|---|
| Semi Detached House | £239,866.00 | 66 Semi Detached Houses |
| Detached House | £386,458.00 | 139 Detached Houses |
| Terraced House | £192,790.00 | 77 Terraced Houses |
| Flat | £109,993.00 | 41 Flats |

