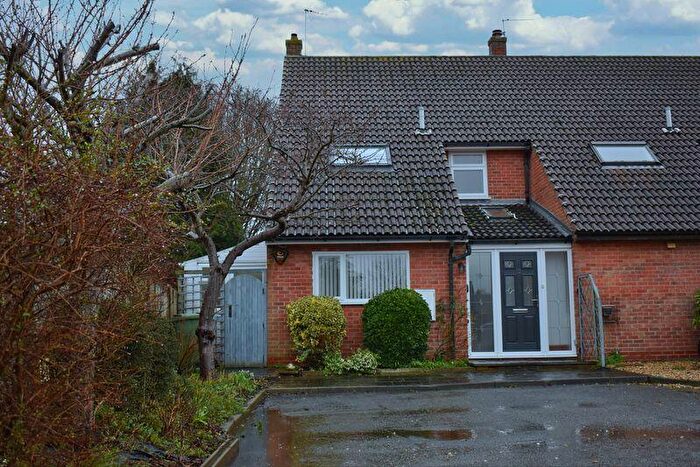
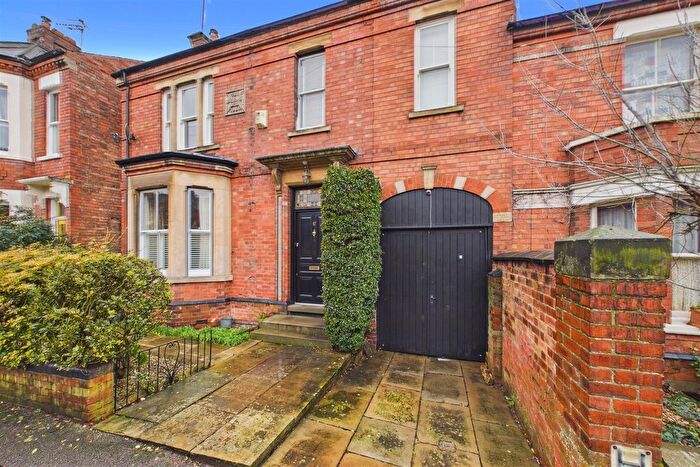
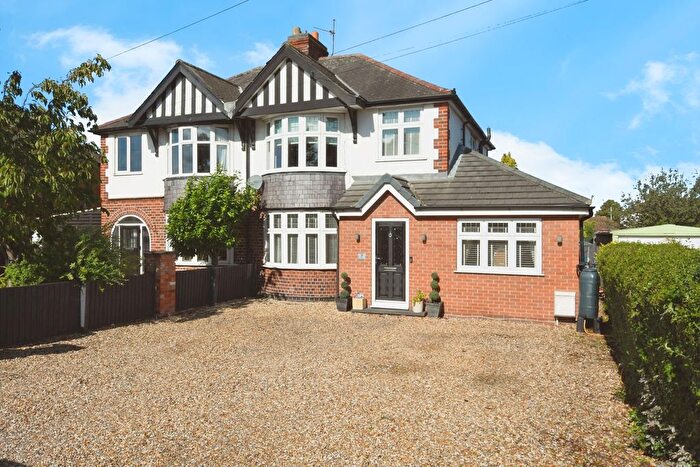
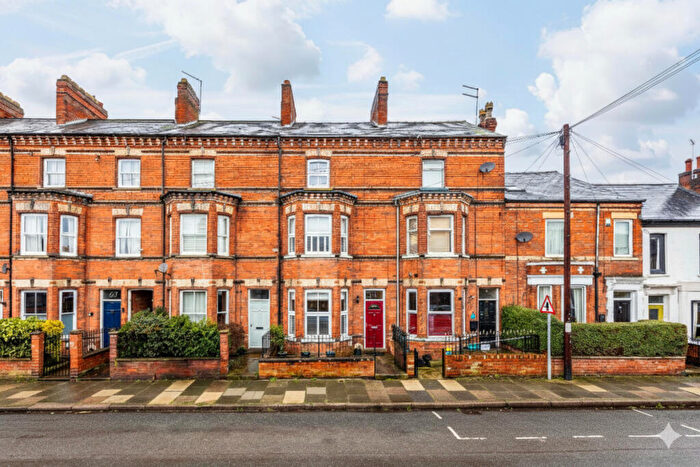
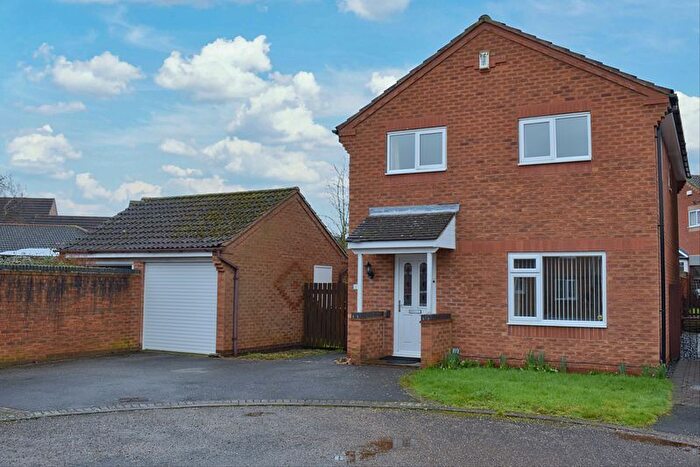
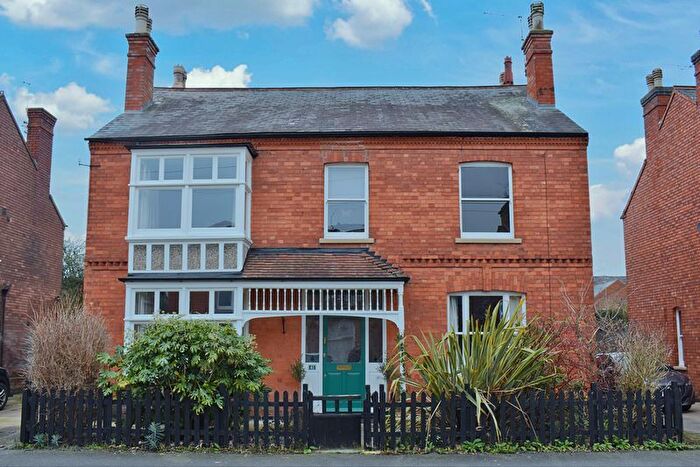
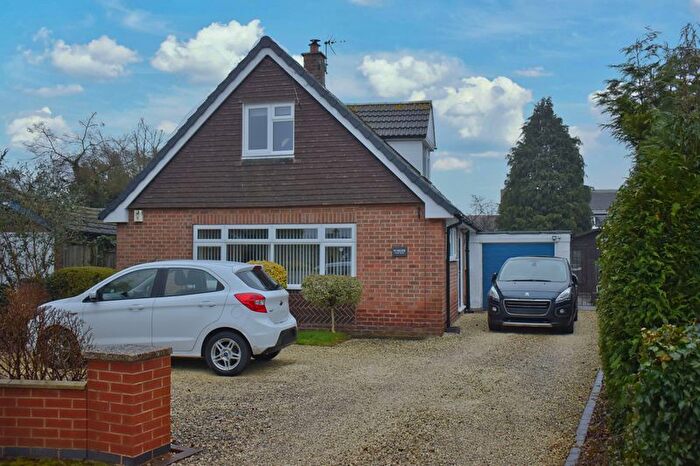
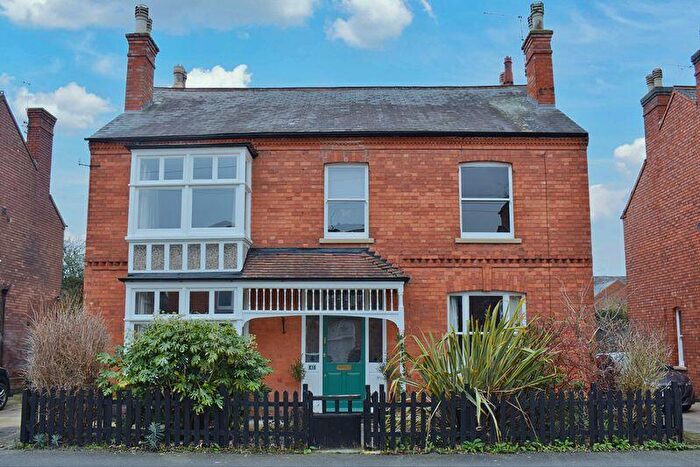
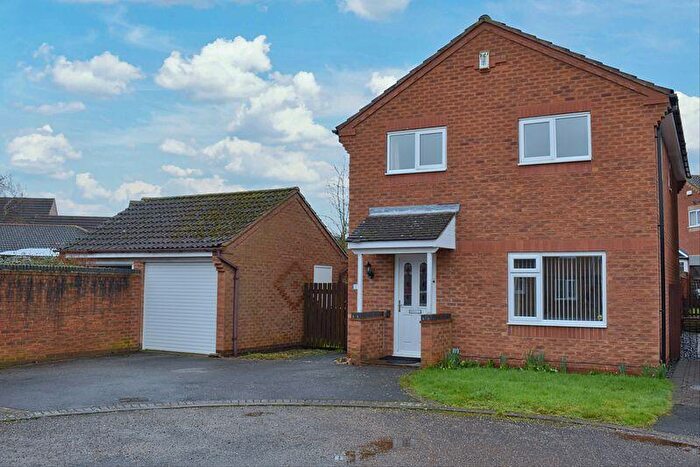
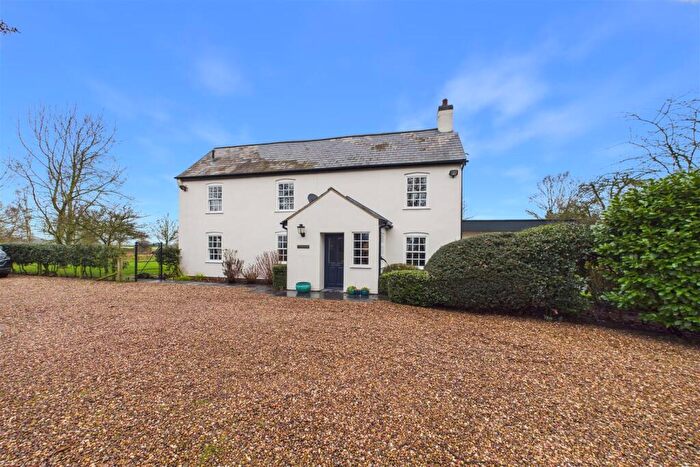
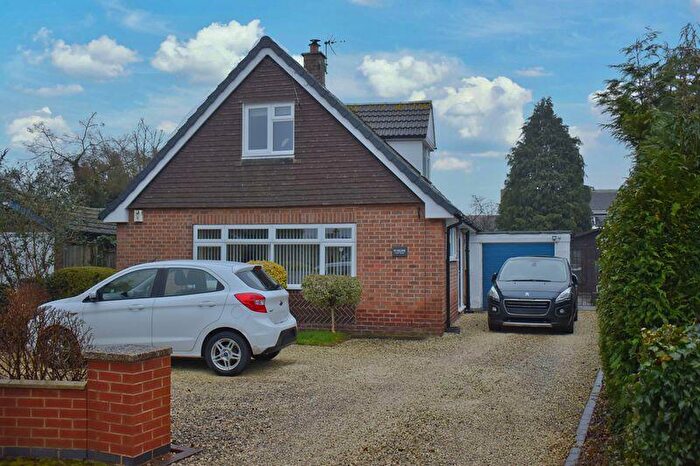
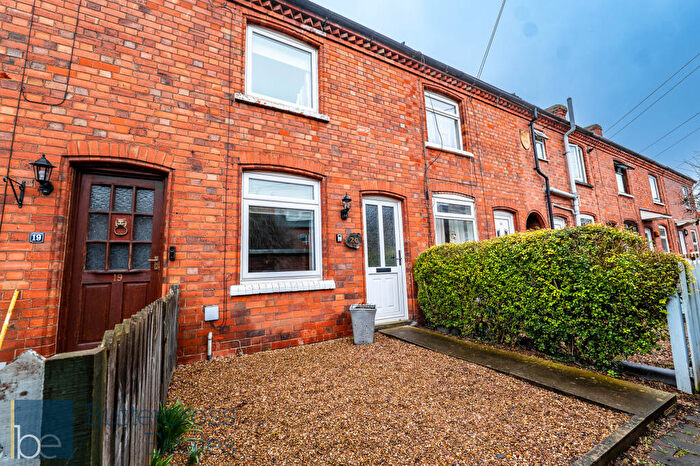
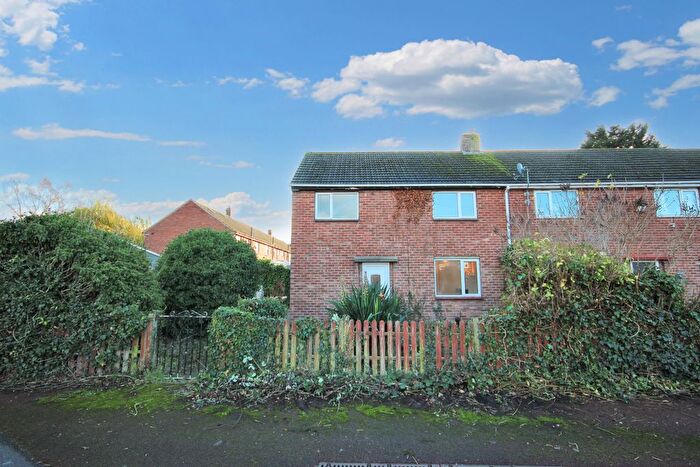
Houses for sale & to rent in Muskham, Newark
House Prices in Muskham
Properties in Muskham have an average house price of £368,426.00 and had 88 Property Transactions within the last 3 years¹.
Muskham is an area in Newark, Nottinghamshire with 1,049 households², where the most expensive property was sold for £790,000.00.
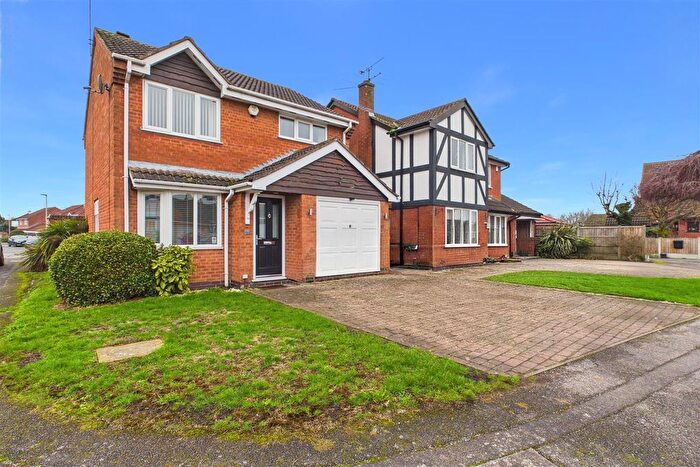
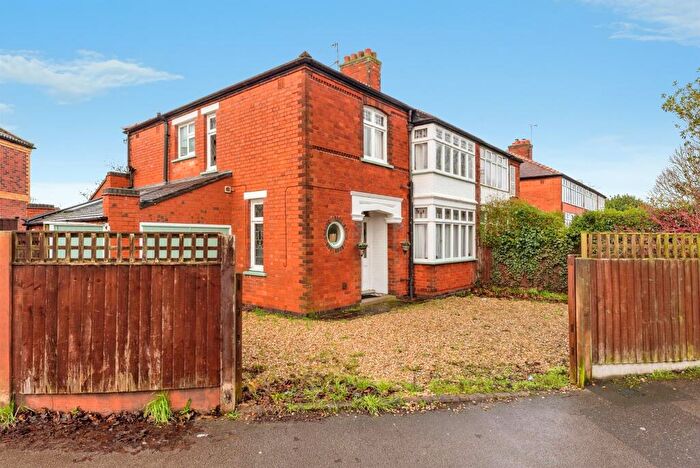
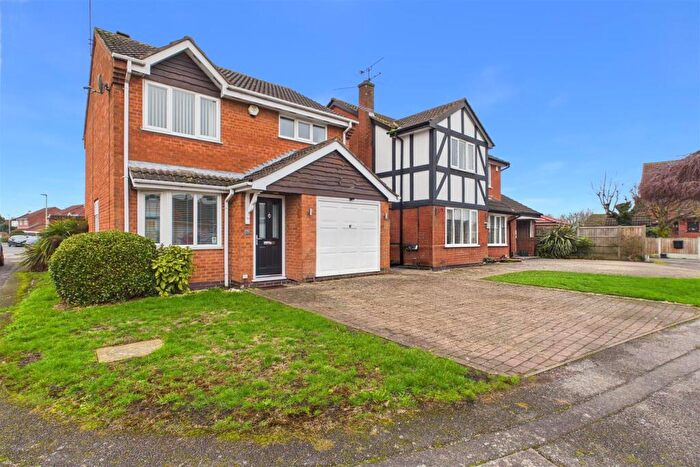
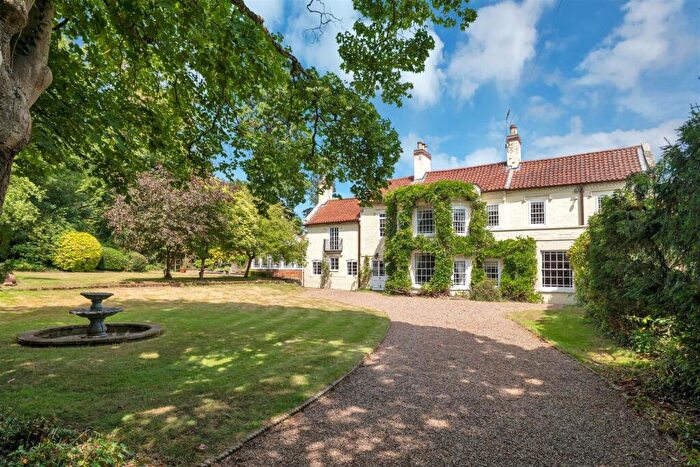
Properties for sale in Muskham
Roads and Postcodes in Muskham
Navigate through our locations to find the location of your next house in Muskham, Newark for sale or to rent.
| Streets | Postcodes |
|---|---|
| Averham Park Farm Cottages | NG23 5RU |
| Ayrshire Way | NG23 5FW |
| Bathley Lane | NG23 6BY NG23 6DT NG23 6HR |
| Behay Gardens | NG23 5RL |
| Blacksmiths Lane | NG23 5QT |
| Brammersack Close | NG23 6BZ |
| Broadgate Lane | NG23 5RZ |
| Caunton Road | NG23 6DL NG23 6DN NG23 6LB |
| Chapel Lane | NG23 6DF NG23 6EP |
| Church Lane | NG23 5RB NG23 6EQ |
| Church Row | NG23 6HF |
| Cogley Lane | NG23 6DH |
| Crab Lane | NG23 6HH |
| Cromwell Farm Close | NG23 6JD |
| Crow Lane | NG23 6DZ |
| Debdale Hill | NG23 6BQ NG23 6BG NG23 6BH |
| Dickinson Way | NG23 6FF |
| Eastfield | NG23 6HE |
| Edge Close | NG23 6FG |
| Farm Close | NG23 6DS |
| Ferry Lane | NG23 6HB |
| Fledborough Road | NG23 6FR |
| Forge Close | NG23 6EG |
| Forge Cottages | NG23 6EF |
| Glebelands | NG23 6FH |
| Goldson Way | NG23 6JA |
| Great North Road | NG23 6DY NG23 6EA NG23 6JE NG23 6JF NG23 6EB NG23 6ED |
| Green Lane | NG23 6DE |
| Hatton Close | NG23 6EL |
| Hedge Row | NG23 6FL |
| Home Farm Close | NG23 5QB |
| Hopwas Close | NG23 5UA |
| Hopyard Lane | NG23 6DQ |
| Hughs Close | NG23 5RE |
| Kelham Lane | NG23 6BT |
| Laurels Close | NG23 6GH |
| Lock Lane | NG23 6JG |
| Mackleys Lane | NG23 6EY |
| Main Street | NG23 5QP NG23 6DA NG23 6DG NG23 6DJ NG23 6EE NG23 6ER NG23 6EZ NG23 6HD NG23 6HQ NG23 6JT |
| Manor Farm Cottages | NG23 6BX |
| Manor House Drive | NG23 6FE |
| Manor Road | NG23 6AR |
| Marsh Lane | NG23 6HG |
| Meadow Close | NG23 6HY |
| Mill Lane | NG23 6HJ NG23 6HW |
| Moorlands Close | NG23 6LE |
| Muskham Lane | NG23 6DB NG23 6DD |
| Nelson Lane | NG23 6HL |
| North Road | NG23 6HN NG23 6HP NG23 6HS NG23 6HT NG23 6HU |
| Norwell Lane | NG23 6JQ NG23 6JH |
| Norwell Woodhouse | NG23 6NQ |
| Old Great North Road | NG23 6ET |
| Ollerton Road | NG23 6BP NG23 6AU NG23 6BB NG23 6BS NG23 6BU |
| Orchard Close | NG23 6EH |
| Ossington Road | NG23 6LA |
| Peets Drive | NG23 6GD |
| Pinfold Lane | NG23 5RD |
| Pingley Close | NG23 5RJ |
| Pingley Lane | NG23 5RH |
| Sleath Drive | NG23 6DP |
| St Wilfreds Close | NG23 6HZ |
| Staythorpe Road | NG23 5QZ NG23 5RA NG23 5RG |
| The Close | NG23 5RP |
| The Grange | NG23 6EN |
| The Park | NG23 6EW |
| The Rutlands | NG23 5QU |
| Thomas Place | NG23 6DR |
| Trent Close | NG23 6HA |
| Trent Cottages | NG23 5QR |
| Vicarage Lane | NG23 6DU NG23 6ES |
| Waltons Lane | NG23 6EU |
| Waterside | NG23 6FD |
| Willow Drive | NG23 6EX |
| NG23 6DX NG23 6AT NG23 6BD NG23 6BE NG23 6DW NG23 6FP NG23 6HX NG23 6JY |
Transport near Muskham
- FAQ
- Price Paid By Year
- Property Type Price
Frequently asked questions about Muskham
What is the average price for a property for sale in Muskham?
The average price for a property for sale in Muskham is £368,426. This amount is 48% higher than the average price in Newark. There are 2,327 property listings for sale in Muskham.
What streets have the most expensive properties for sale in Muskham?
The streets with the most expensive properties for sale in Muskham are Green Lane at an average of £752,500, Broadgate Lane at an average of £610,250 and The Close at an average of £525,000.
What streets have the most affordable properties for sale in Muskham?
The streets with the most affordable properties for sale in Muskham are Ferry Lane at an average of £155,250, Forge Close at an average of £190,000 and Church Lane at an average of £265,875.
Which train stations are available in or near Muskham?
Some of the train stations available in or near Muskham are Newark Castle, Newark North Gate and Collingham.
Property Price Paid in Muskham by Year
The average sold property price by year was:
| Year | Average Sold Price | Price Change |
Sold Properties
|
|---|---|---|---|
| 2025 | £357,448 | 4% |
28 Properties |
| 2024 | £342,748 | -20% |
33 Properties |
| 2023 | £411,194 | 15% |
27 Properties |
| 2022 | £351,474 | -11% |
39 Properties |
| 2021 | £389,545 | 14% |
51 Properties |
| 2020 | £336,428 | 12% |
42 Properties |
| 2019 | £295,562 | -10% |
28 Properties |
| 2018 | £325,515 | 21% |
33 Properties |
| 2017 | £257,773 | 2% |
49 Properties |
| 2016 | £251,798 | -2% |
57 Properties |
| 2015 | £257,223 | -14% |
54 Properties |
| 2014 | £294,020 | 20% |
43 Properties |
| 2013 | £235,409 | -3% |
35 Properties |
| 2012 | £241,579 | 2% |
25 Properties |
| 2011 | £236,350 | 6% |
25 Properties |
| 2010 | £221,664 | -5% |
38 Properties |
| 2009 | £231,764 | -13% |
51 Properties |
| 2008 | £260,763 | 2% |
39 Properties |
| 2007 | £254,355 | 3% |
60 Properties |
| 2006 | £246,350 | 2% |
49 Properties |
| 2005 | £242,508 | 1% |
41 Properties |
| 2004 | £239,525 | 14% |
46 Properties |
| 2003 | £204,824 | 12% |
52 Properties |
| 2002 | £179,692 | 24% |
71 Properties |
| 2001 | £135,734 | 16% |
52 Properties |
| 2000 | £114,603 | 0,4% |
57 Properties |
| 1999 | £114,147 | 10% |
66 Properties |
| 1998 | £102,817 | 13% |
37 Properties |
| 1997 | £89,263 | 11% |
53 Properties |
| 1996 | £79,004 | 12% |
49 Properties |
| 1995 | £69,790 | - |
32 Properties |
Property Price per Property Type in Muskham
Here you can find historic sold price data in order to help with your property search.
The average Property Paid Price for specific property types in the last three years are:
| Property Type | Average Sold Price | Sold Properties |
|---|---|---|
| Semi Detached House | £282,621.00 | 16 Semi Detached Houses |
| Detached House | £404,485.00 | 65 Detached Houses |
| Terraced House | £229,714.00 | 7 Terraced Houses |

