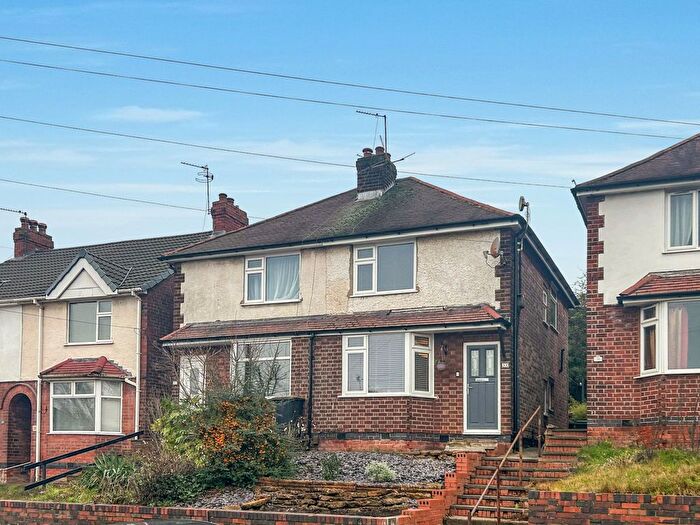
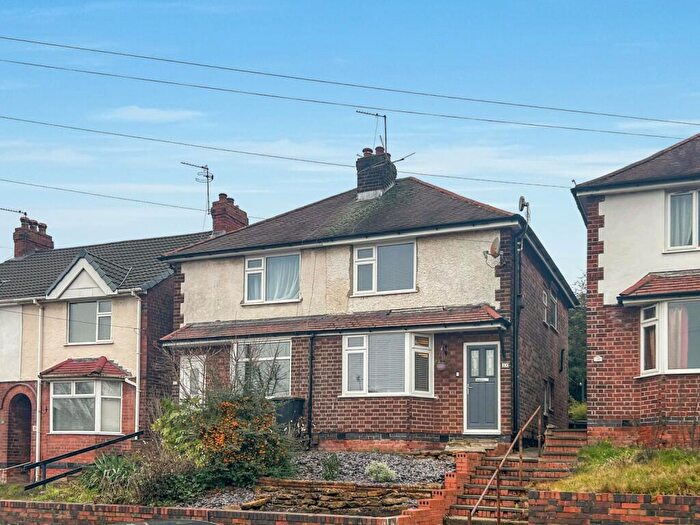
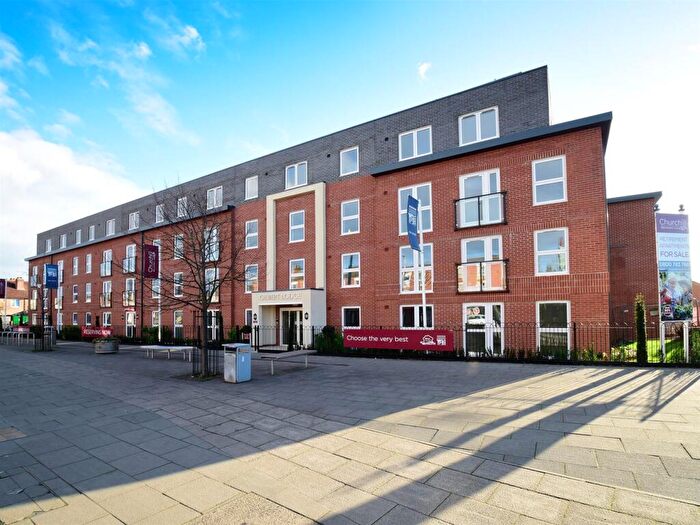
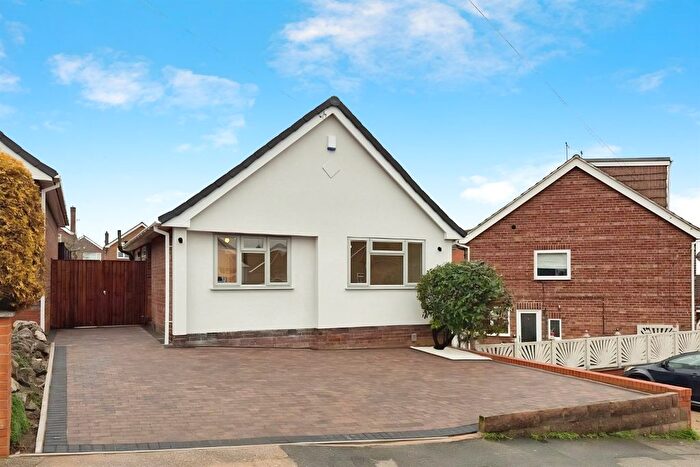
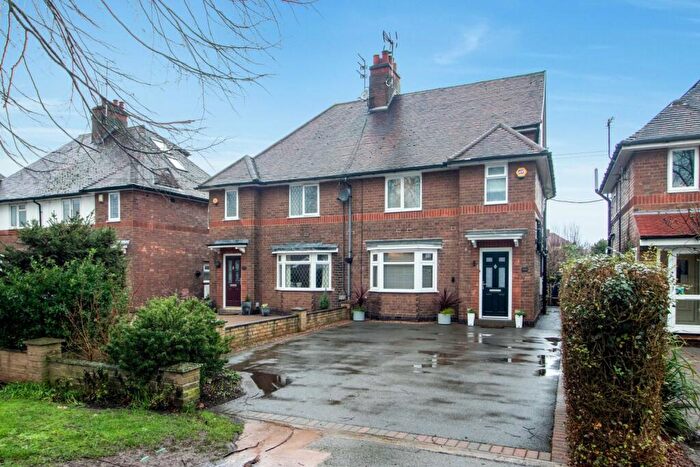
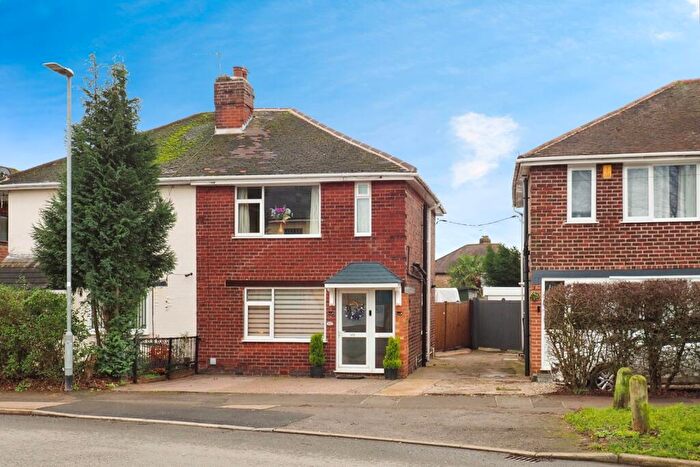
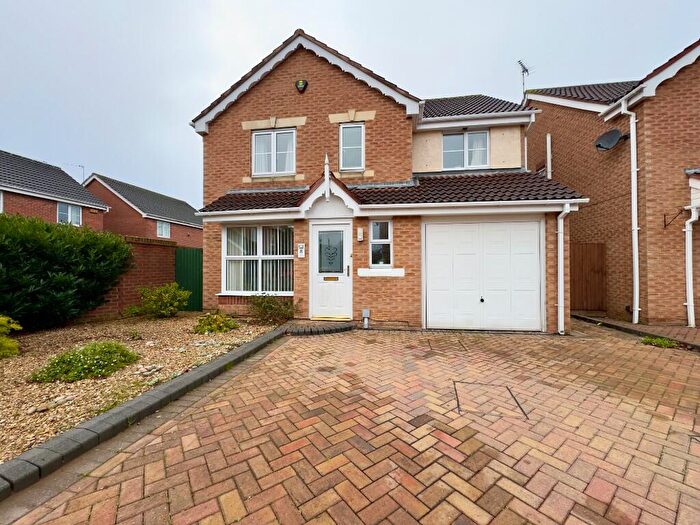
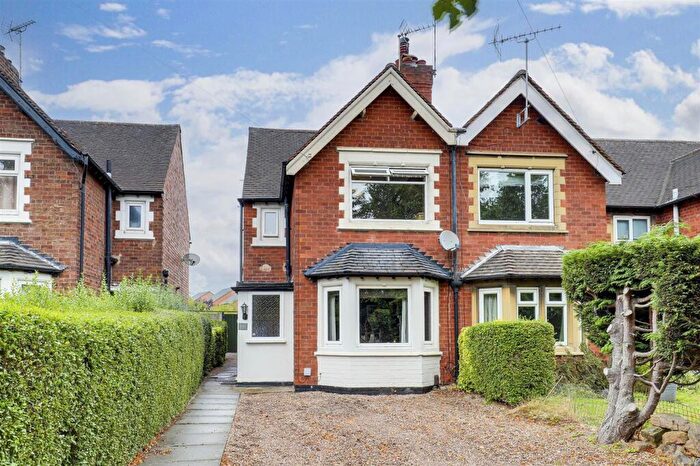
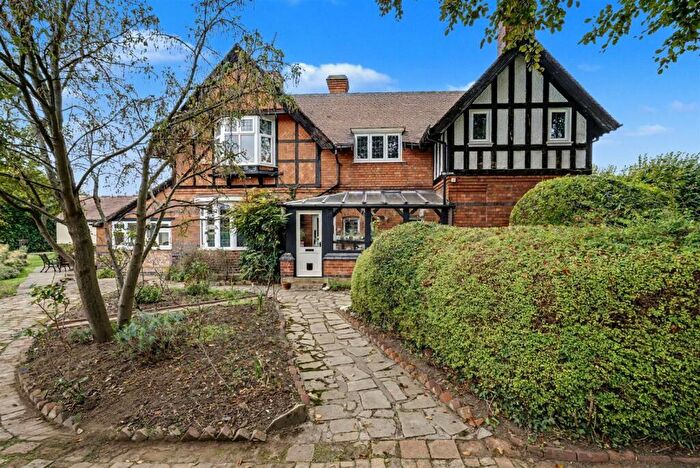
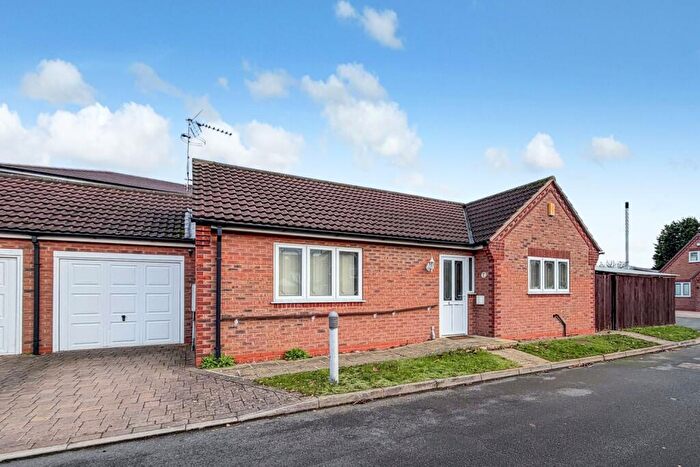
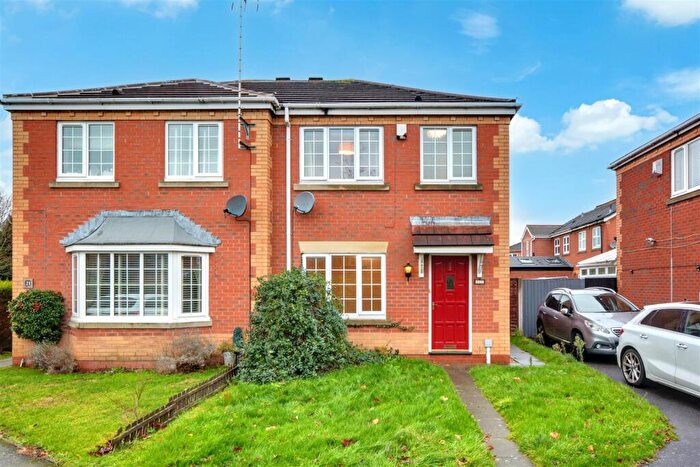
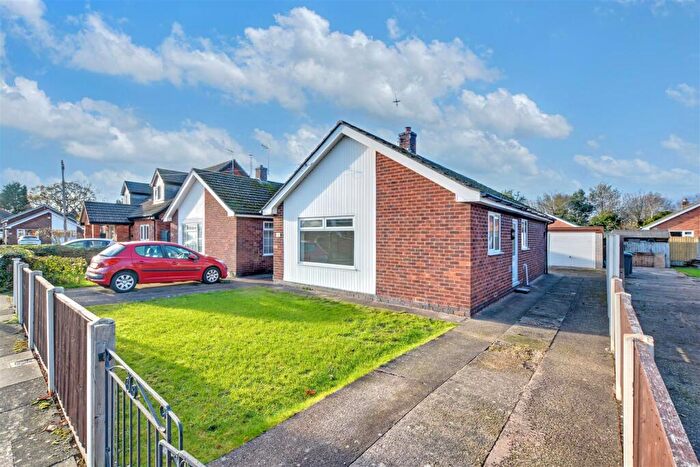
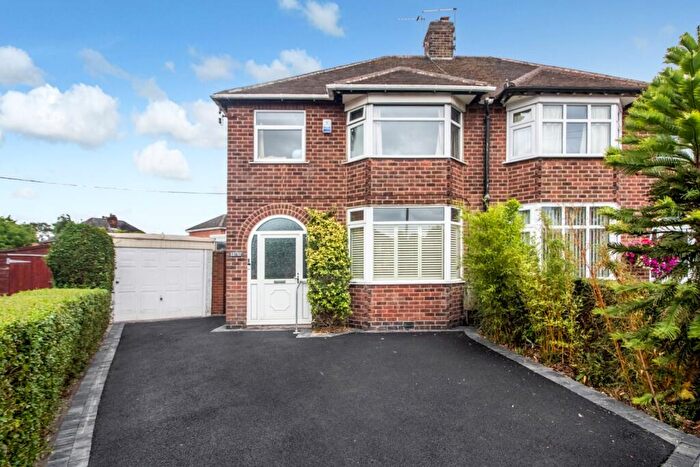
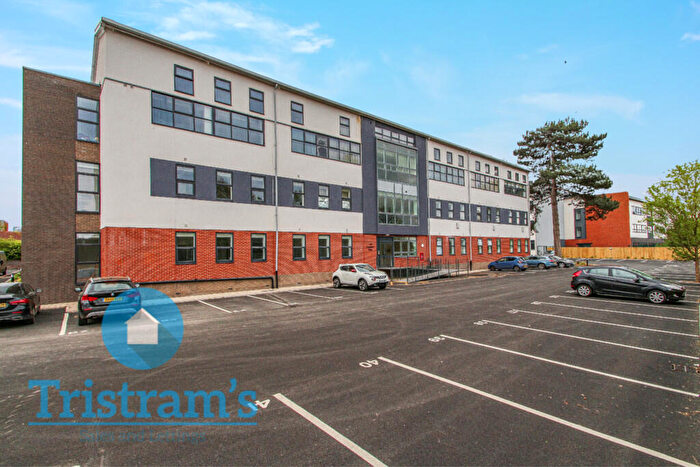
Houses for sale & to rent in Attenborough, Nottingham
House Prices in Attenborough
Properties in Attenborough have an average house price of £335,480.00 and had 98 Property Transactions within the last 3 years¹.
Attenborough is an area in Nottingham, Nottinghamshire with 999 households², where the most expensive property was sold for £1,000,000.00.
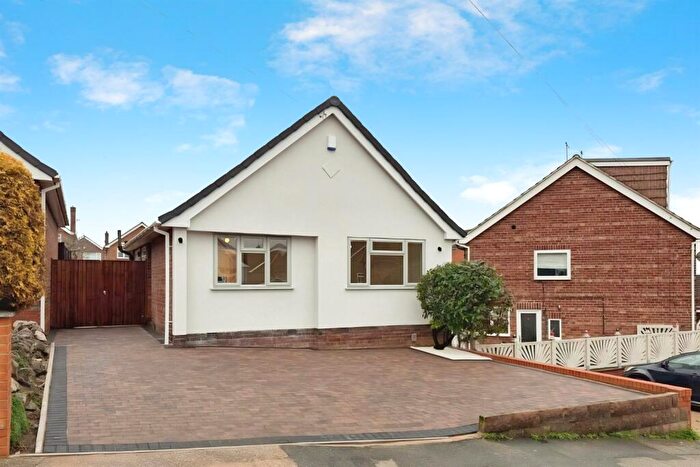
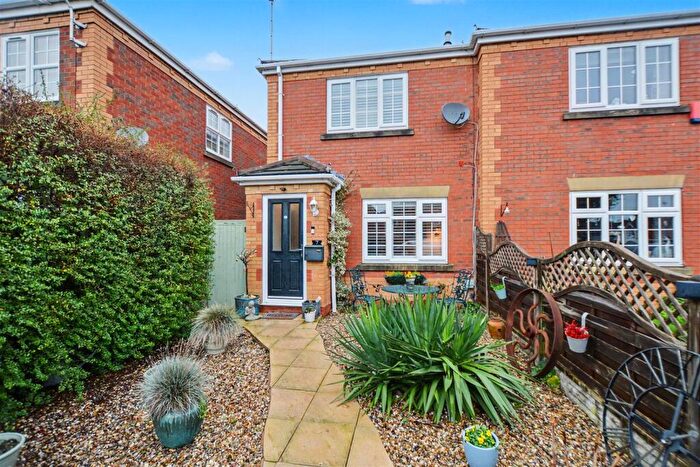
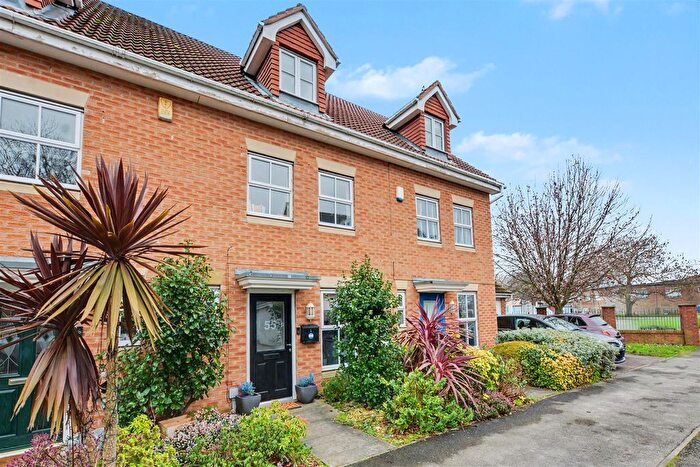
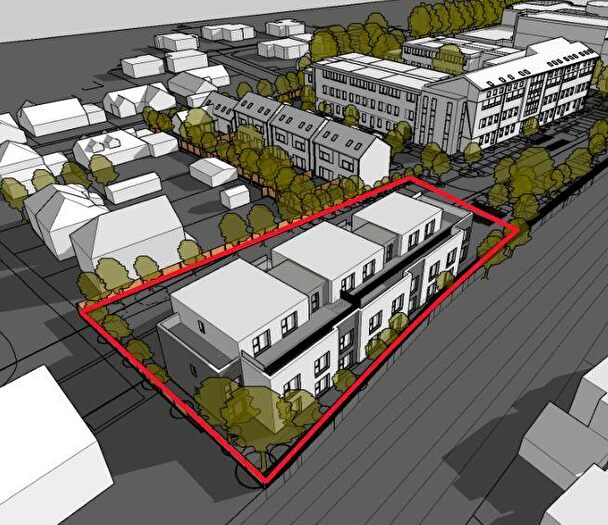
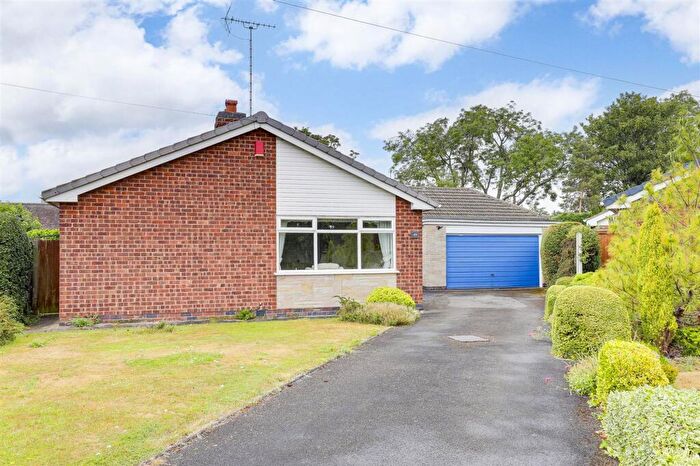
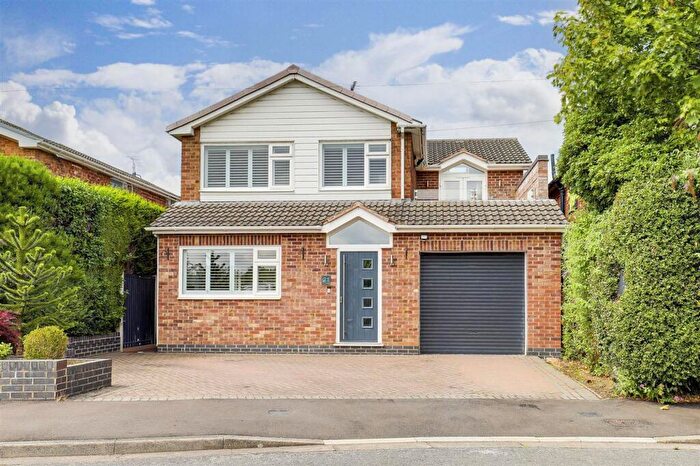
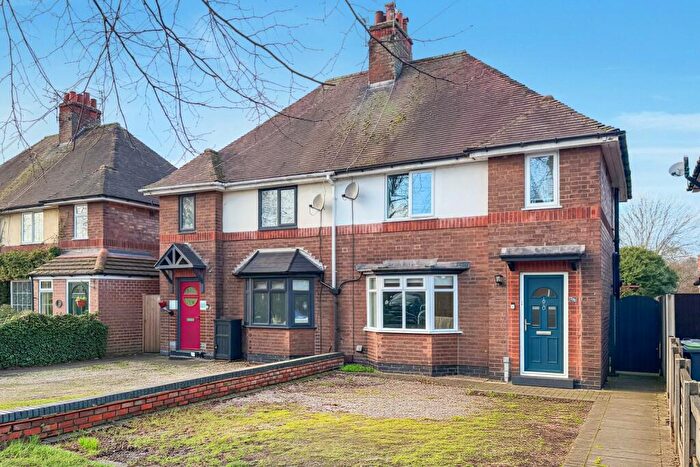
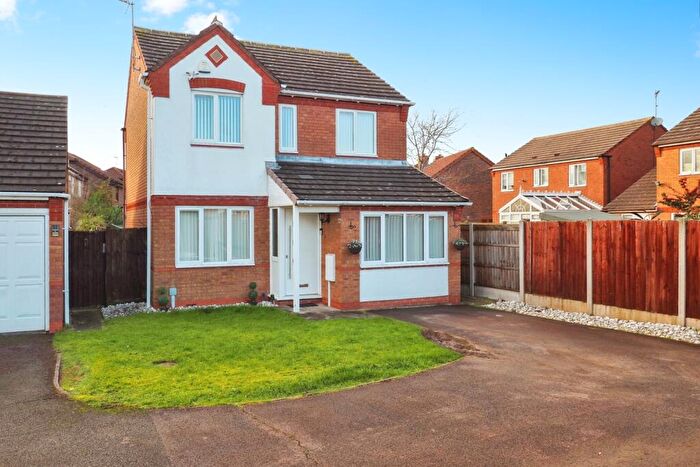
Properties for sale in Attenborough
Roads and Postcodes in Attenborough
Navigate through our locations to find the location of your next house in Attenborough, Nottingham for sale or to rent.
| Streets | Postcodes |
|---|---|
| Adenburgh Drive | NG9 6AZ |
| Allendale Avenue | NG9 6AN |
| Attenborough Lane | NG9 6AA NG9 6AB NG9 6AL |
| Barkers Lane | NG9 5AF |
| Barratt Close | NG9 6AE |
| Barratt Crescent | NG9 6AH |
| Barratt Lane | NG9 6AD NG9 6AF |
| Barton Lane | NG9 6DY |
| Bramble Close | NG9 6EA |
| Burnham Avenue | NG9 5AH |
| Bye Pass Road | NG9 5HR NG9 5HS |
| Charlton Grove | NG9 1GY |
| Church Lane | NG9 6AS |
| Clarence Road | NG9 5HY |
| Clifton Crescent | NG9 6DA |
| Crofton Close | NG9 5HX |
| Crofton Road | NG9 5HT NG9 5HW |
| Derwent Close | NG9 6BX |
| Elm Avenue | NG9 6BH |
| Ferndale Close | NG9 6AQ |
| George Avenue | NG9 1HD |
| Glendale Court | NG9 5AN |
| Gloucester Avenue | NG9 1HE |
| Gordon Close | NG9 6AP |
| Ireton Grove | NG9 6BJ |
| Kelsey Close | NG9 6BA |
| Kent Avenue | NG9 1HA |
| Ladybridge Close | NG9 6BS |
| Long Lane | NG9 6BG NG9 6BN NG9 6BQ NG9 6BW NG9 6BZ NG9 6DB |
| Lune Close | NG9 6BT |
| Manor Avenue | NG9 6BP |
| Marina Avenue | NG9 1HB |
| Meadow Lane | NG9 5AE NG9 5AJ |
| Milton Crescent | NG9 6BE |
| Nottingham Road | NG9 6DN |
| Queens Road West | NG9 1GX NG9 5AD |
| Quorn Close | NG9 6BU |
| Reigate Close | NG9 6AY |
| Reigate Drive | NG9 6AX |
| Riverdale Road | NG9 5HU |
| Shady Lane | NG9 6AW |
| St Marys Close | NG9 6AT |
| Tennyson Drive | NG9 6BD |
| The Paddock | NG9 6AR |
| The Strand | NG9 6AU |
| Trent Crescent | NG9 6BY |
| Wheatley Grove | NG9 5AG |
| York Avenue | NG9 1GZ |
Transport near Attenborough
-
Attenborough Station
-
Beeston Station
-
Long Eaton Station
-
East Midlands Parkway Station
-
Nottingham Station
- FAQ
- Price Paid By Year
- Property Type Price
Frequently asked questions about Attenborough
What is the average price for a property for sale in Attenborough?
The average price for a property for sale in Attenborough is £335,480. This amount is 19% higher than the average price in Nottingham. There are 849 property listings for sale in Attenborough.
What streets have the most expensive properties for sale in Attenborough?
The streets with the most expensive properties for sale in Attenborough are Attenborough Lane at an average of £593,333, Elm Avenue at an average of £567,500 and Reigate Drive at an average of £532,500.
What streets have the most affordable properties for sale in Attenborough?
The streets with the most affordable properties for sale in Attenborough are Barton Lane at an average of £120,000, Gloucester Avenue at an average of £204,700 and Trent Crescent at an average of £206,916.
Which train stations are available in or near Attenborough?
Some of the train stations available in or near Attenborough are Attenborough, Beeston and Long Eaton.
Property Price Paid in Attenborough by Year
The average sold property price by year was:
| Year | Average Sold Price | Price Change |
Sold Properties
|
|---|---|---|---|
| 2025 | £345,751 | - |
36 Properties |
| 2024 | £345,692 | 13% |
39 Properties |
| 2023 | £302,086 | -32% |
23 Properties |
| 2022 | £399,647 | 13% |
54 Properties |
| 2021 | £345,870 | 13% |
47 Properties |
| 2020 | £299,825 | 14% |
28 Properties |
| 2019 | £257,708 | 8% |
31 Properties |
| 2018 | £238,206 | 0,3% |
37 Properties |
| 2017 | £237,437 | 14% |
39 Properties |
| 2016 | £204,340 | -35% |
38 Properties |
| 2015 | £276,741 | 30% |
46 Properties |
| 2014 | £193,006 | 4% |
43 Properties |
| 2013 | £185,791 | 18% |
36 Properties |
| 2012 | £152,258 | -20% |
36 Properties |
| 2011 | £182,318 | 6% |
29 Properties |
| 2010 | £171,800 | -23% |
42 Properties |
| 2009 | £211,707 | 5% |
34 Properties |
| 2008 | £201,995 | 19% |
24 Properties |
| 2007 | £164,491 | -12% |
34 Properties |
| 2006 | £184,332 | -9% |
49 Properties |
| 2005 | £201,545 | 15% |
38 Properties |
| 2004 | £171,417 | 7% |
49 Properties |
| 2003 | £158,845 | 14% |
50 Properties |
| 2002 | £135,974 | 20% |
50 Properties |
| 2001 | £108,734 | 28% |
52 Properties |
| 2000 | £78,807 | 9% |
37 Properties |
| 1999 | £71,688 | -0,3% |
61 Properties |
| 1998 | £71,937 | 8% |
39 Properties |
| 1997 | £66,413 | -10% |
62 Properties |
| 1996 | £73,005 | 25% |
40 Properties |
| 1995 | £55,110 | - |
25 Properties |
Property Price per Property Type in Attenborough
Here you can find historic sold price data in order to help with your property search.
The average Property Paid Price for specific property types in the last three years are:
| Property Type | Average Sold Price | Sold Properties |
|---|---|---|
| Semi Detached House | £279,816.00 | 45 Semi Detached Houses |
| Detached House | £428,598.00 | 41 Detached Houses |
| Terraced House | £226,066.00 | 12 Terraced Houses |

