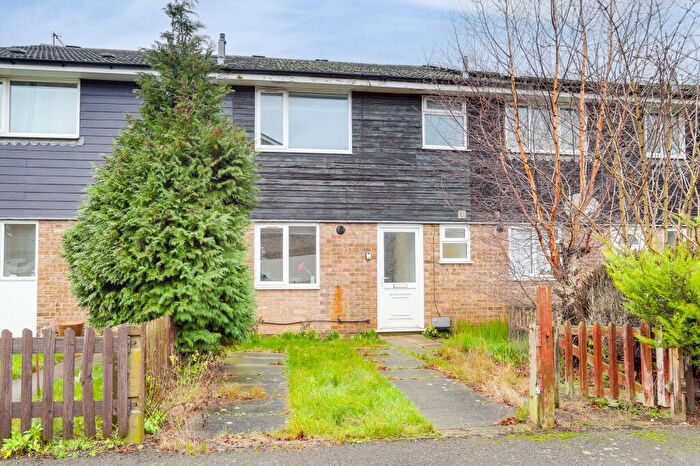
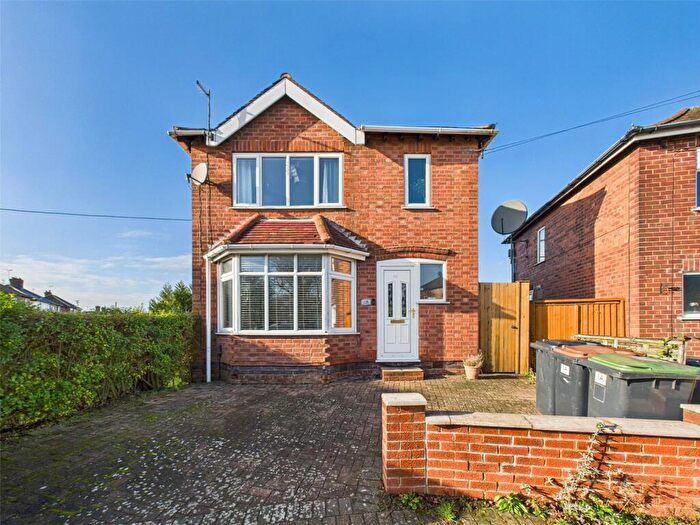
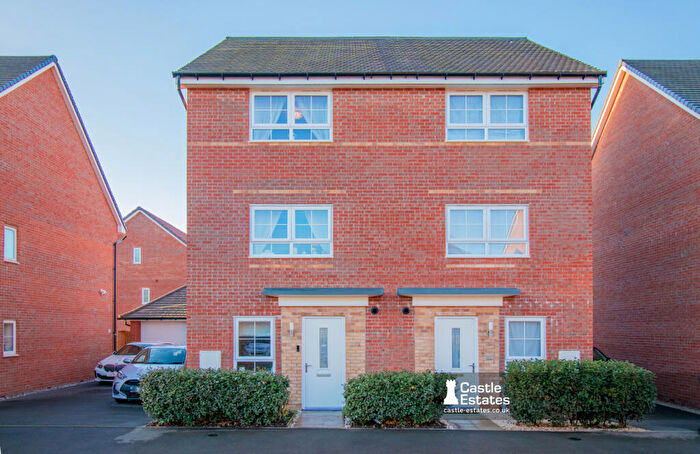
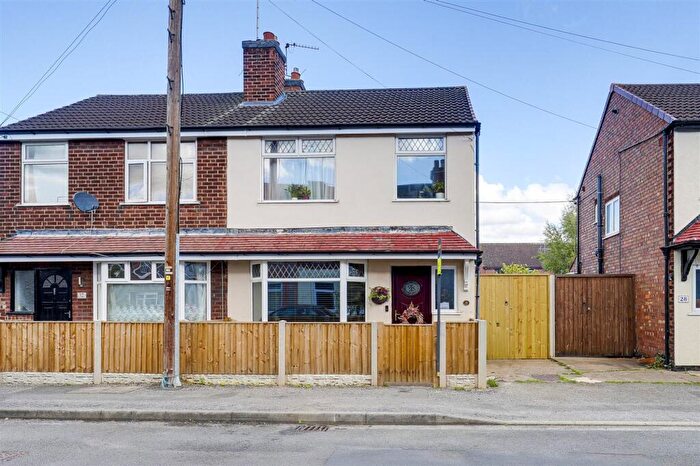
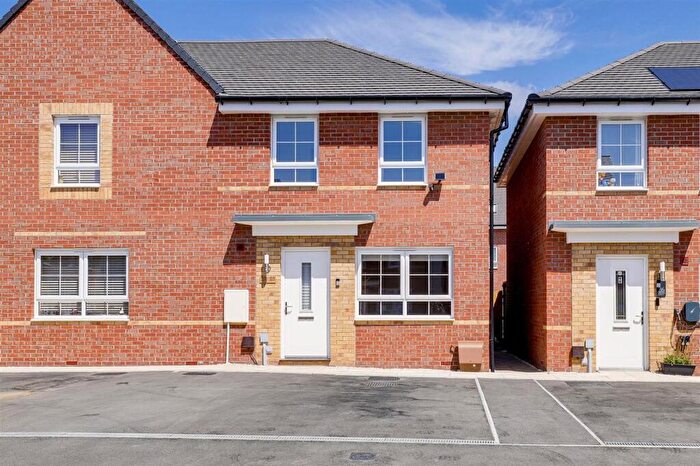
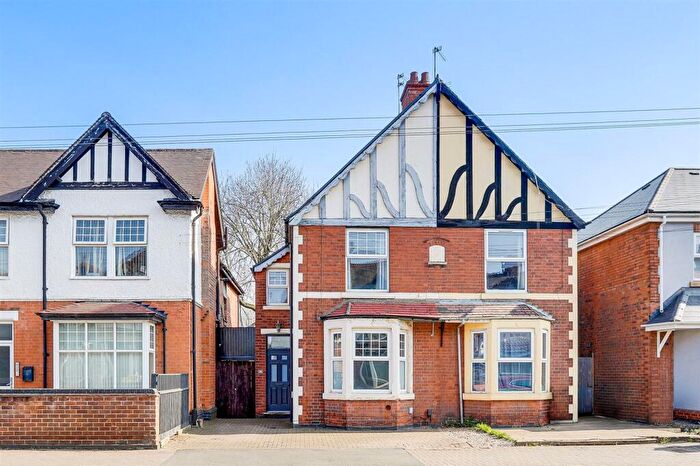
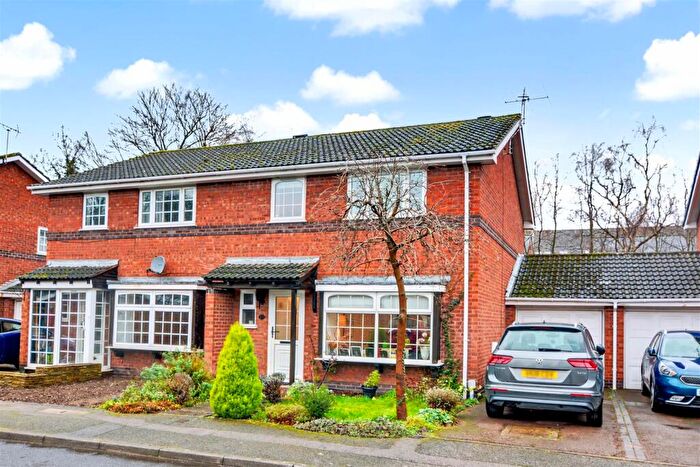
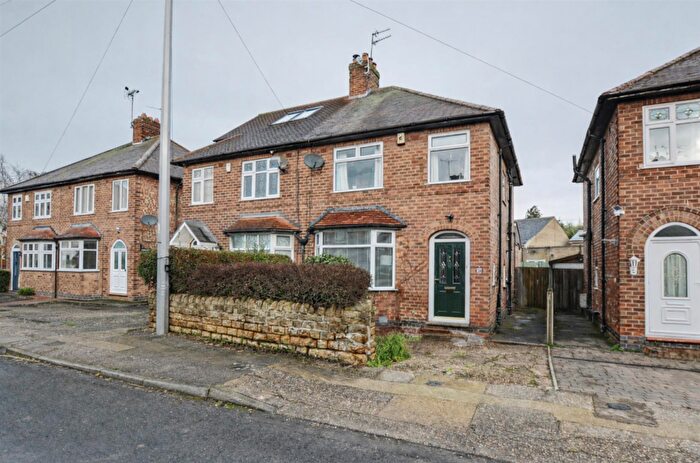
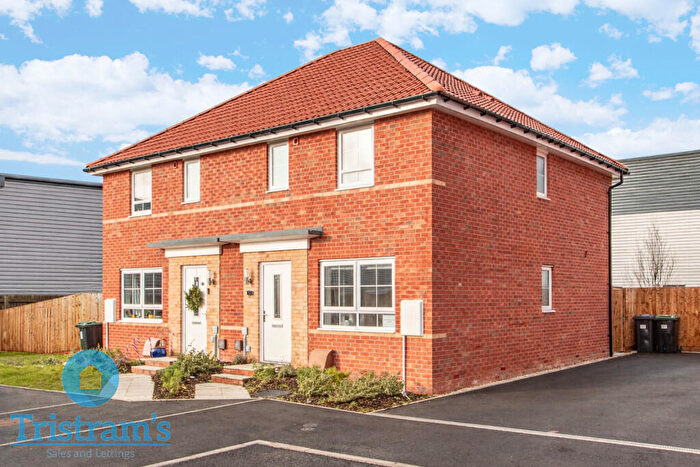
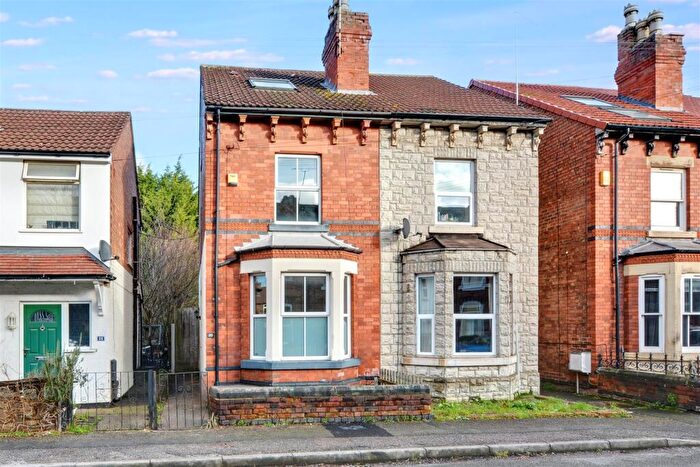
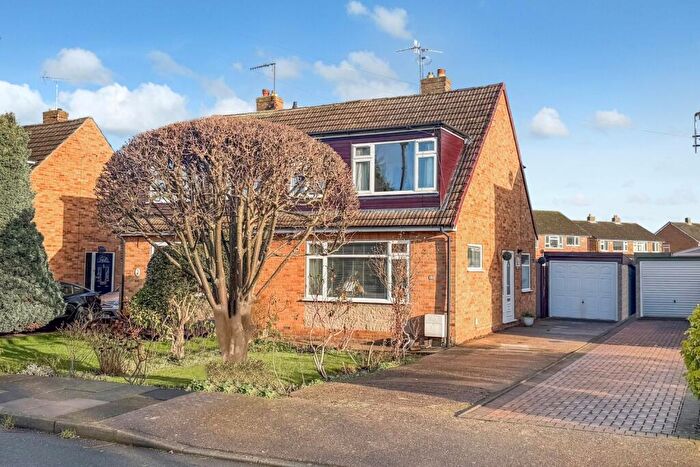
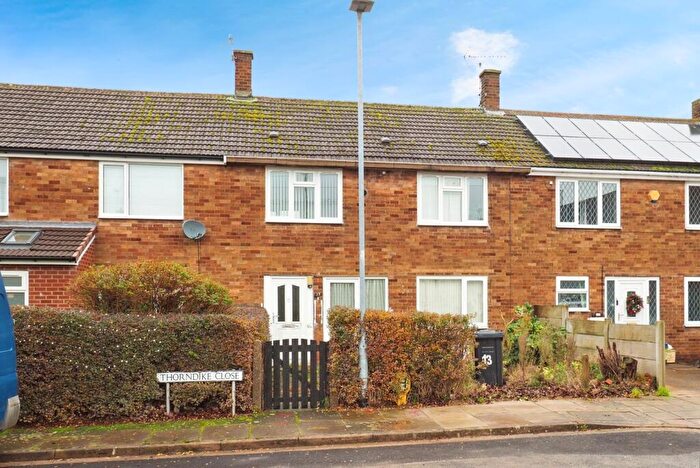
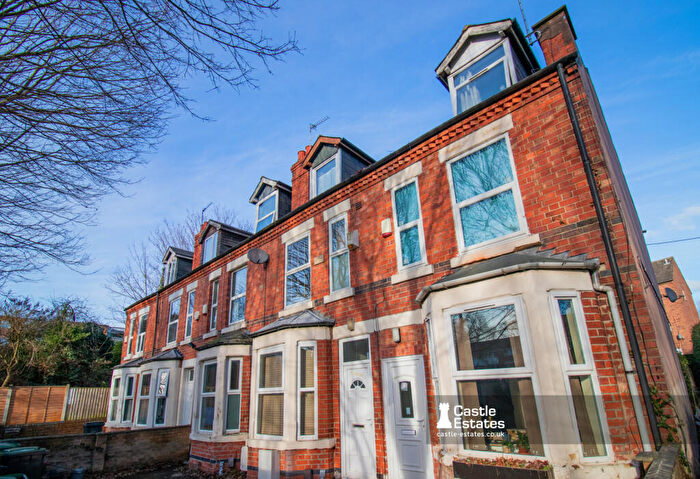
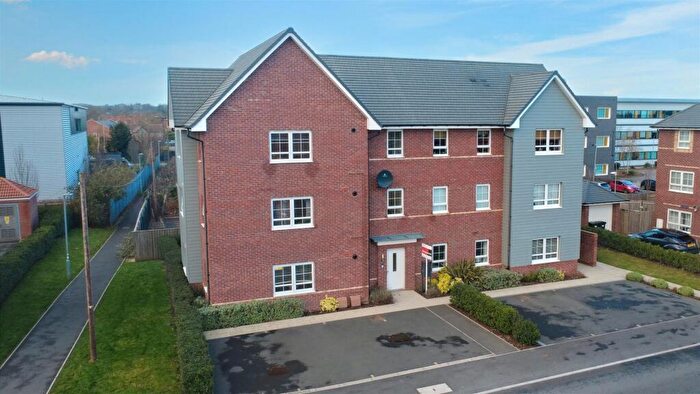
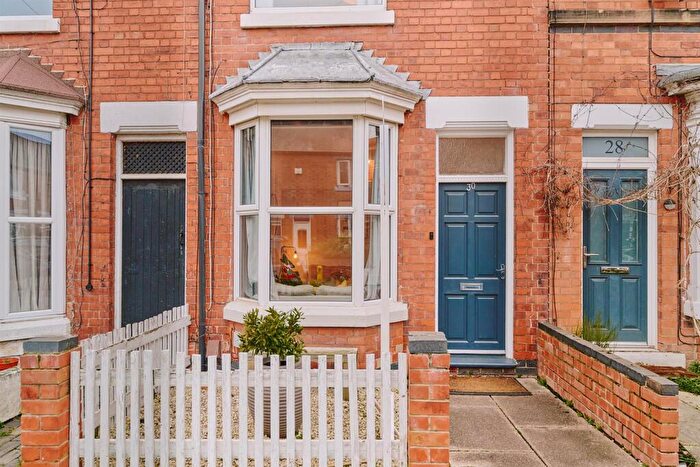
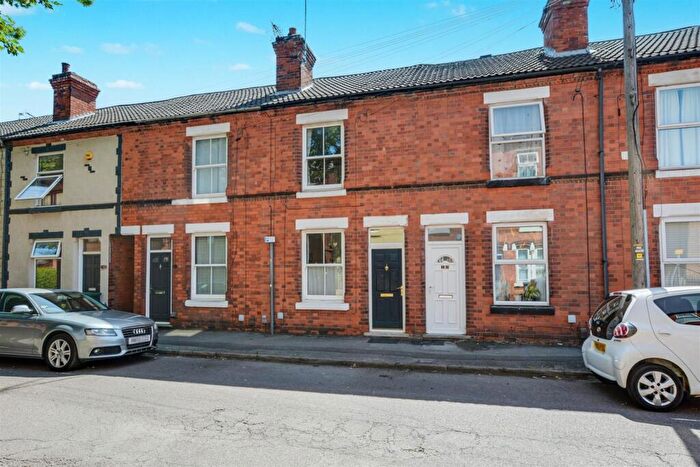
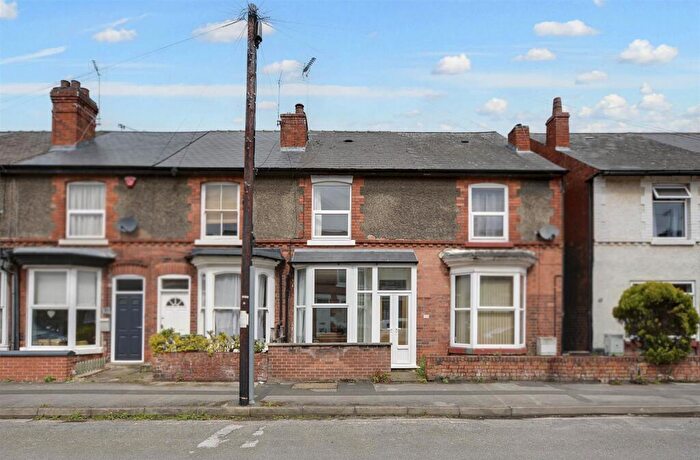
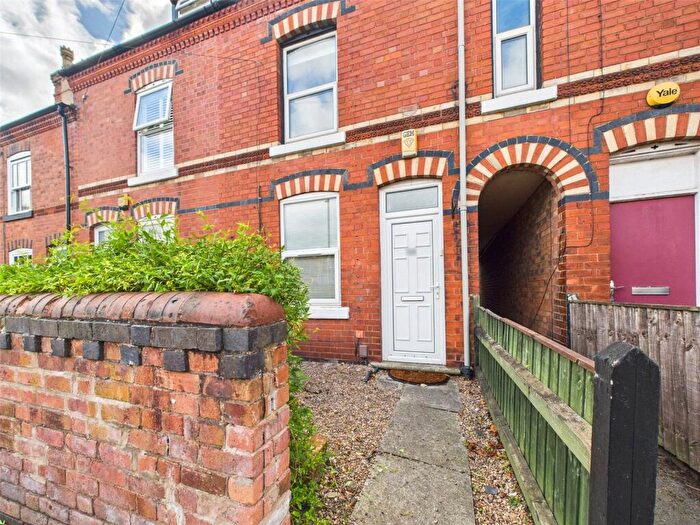
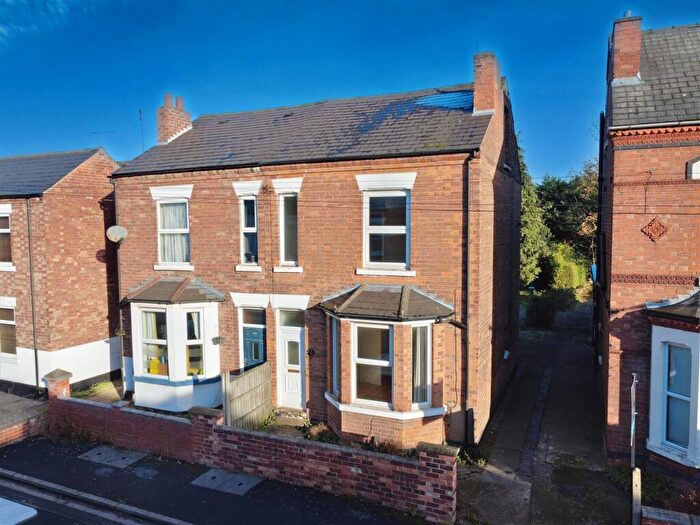
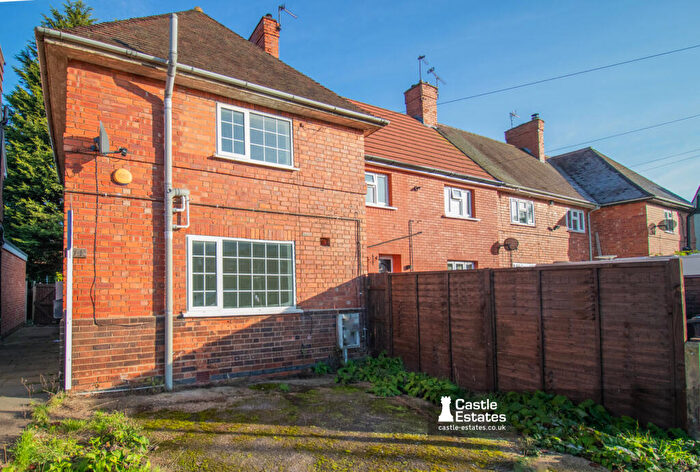
Houses for sale & to rent in Beeston Rylands, Nottingham
House Prices in Beeston Rylands
Properties in Beeston Rylands have an average house price of £245,874.00 and had 204 Property Transactions within the last 3 years¹.
Beeston Rylands is an area in Nottingham, Nottinghamshire with 2,461 households², where the most expensive property was sold for £804,572.00.
Properties for sale in Beeston Rylands
Roads and Postcodes in Beeston Rylands
Navigate through our locations to find the location of your next house in Beeston Rylands, Nottingham for sale or to rent.
| Streets | Postcodes |
|---|---|
| Acaster Close | NG9 1NF |
| Alexandra Crescent | NG9 2BQ NG9 2BS |
| Alford Close | NG9 1QP |
| Appleton Court | NG9 1JW |
| Appleton Road | NG9 1NE |
| Ashfield Avenue | NG9 1PY |
| Barton Street | NG9 1JJ NG9 1JX |
| Beech Avenue | NG9 1QB NG9 1QD NG9 1QH |
| Beeston Business Park | NG9 1AD NG9 1LA |
| Birch Avenue | NG9 1LL |
| Canal Side | NG9 1LX NG9 1NG NG9 1LZ |
| Cartwright Way | NG9 1RL |
| Clayton Court | NG9 1JZ |
| Cornwall Avenue | NG9 1NL |
| County Close | NG9 1GD |
| Dovecote Lane | NG9 1JG |
| Dunsmore Close | NG9 1LU |
| East Crescent | NG9 1PZ NG9 1QA |
| Elswick Drive | NG9 1NQ |
| First Avenue | NG9 1BG |
| Grace Avenue | NG9 2BX |
| Grassy Lane | NG9 1NT |
| Grenville Road | NG9 1LN |
| Grove Street | NG9 1JL |
| Ireland Avenue | NG9 1JD |
| Ireland Close | NG9 1JE |
| Kingfisher Close | NG9 2DG |
| Laburnum Grove | NG9 1QN |
| Lavender Grove | NG9 1QJ |
| Leyton Crescent | NG9 1PR NG9 1PS NG9 1PT |
| Lilac Crescent | NG9 1PD NG9 1PX |
| Lilac Grove | NG9 1PA NG9 1PE NG9 1PF NG9 1PG NG9 1PP NG9 1QX |
| Lily Grove | NG9 1QL |
| Linden Grove | NG9 2AD NG9 2AG |
| Lock Close | NG9 1NH |
| Lockwood Close | NG9 1NP |
| Longlands Close | NG9 1LW |
| Longlands Road | NG9 1LR |
| Mallard Court | NG9 2DF |
| Malting Crescent | NG9 1FU |
| Maple Avenue | NG9 1PQ NG9 1PU NG9 1PW |
| Marconi Drive | NG9 1NX |
| Meadow Road | NG9 1JN NG9 1JQ NG9 1JR NG9 1JS NG9 1JT NG9 1JU NG9 1JP |
| Multimode Close | NG9 1NY |
| Nelson Road | NG9 1LF |
| Owen Jenkins Close | NG9 1PL |
| Plessey Road | NG9 1NZ |
| Pyramid Caravan Site | NG9 1NS |
| Queens Road | NG9 2BB NG9 2BT NG9 1JB NG9 1QT |
| Queens Road West | NG9 1GT |
| Redwood Crescent | NG9 1JF |
| Regeneration Way | NG9 1NJ NG9 1NW |
| Riverside Close | NG9 1NR |
| Riverside Road | NG9 1NA |
| Rose Grove | NG9 1PB |
| Roy Avenue | NG9 1QG |
| Rylands Close | NG9 1LT |
| South Road | NG9 1LY |
| Sovereign Court | NG9 1HJ |
| Station Road | NG9 2AA NG9 2AB |
| Station Villas | NG9 1JH |
| Stornoway Court | NG9 1QR |
| Suffolk Avenue | NG9 1NN |
| Technology Drive | NG9 1PN |
| The Parrs | NG9 1PJ |
| Thorndyke Close | NG9 1LS |
| Trafalgar Road | NG9 1LB NG9 1LE |
| Transmission Gardens | NG9 1QQ |
| Trent Road | NG9 1LD NG9 1LJ NG9 1LP NG9 1LQ |
| Trent Vale Road | NG9 1ND |
| Trentside | NG9 1NB |
| Victory Road | NG9 1LG NG9 1LH |
| Waterloo Road | NG9 2BU |
| West Crescent | NG9 1QE NG9 1QF |
| Wharton Crescent | NG9 1RJ |
| Windsor Street | NG9 2BW |
| NG90 1LP NG90 1WT NG90 1YZ NG90 2DB NG90 2PR NG90 5UN NG90 6BH NG90 6XP |
Transport near Beeston Rylands
-
Beeston Station
-
Attenborough Station
-
Nottingham Station
-
Long Eaton Station
-
East Midlands Parkway Station
- FAQ
- Price Paid By Year
- Property Type Price
Frequently asked questions about Beeston Rylands
What is the average price for a property for sale in Beeston Rylands?
The average price for a property for sale in Beeston Rylands is £245,874. This amount is 13% lower than the average price in Nottingham. There are 1,211 property listings for sale in Beeston Rylands.
What streets have the most expensive properties for sale in Beeston Rylands?
The streets with the most expensive properties for sale in Beeston Rylands are Station Road at an average of £391,250, Trent Vale Road at an average of £356,400 and Wharton Crescent at an average of £321,800.
What streets have the most affordable properties for sale in Beeston Rylands?
The streets with the most affordable properties for sale in Beeston Rylands are Linden Grove at an average of £125,833, Mallard Court at an average of £180,000 and Grenville Road at an average of £180,083.
Which train stations are available in or near Beeston Rylands?
Some of the train stations available in or near Beeston Rylands are Beeston, Attenborough and Nottingham.
Property Price Paid in Beeston Rylands by Year
The average sold property price by year was:
| Year | Average Sold Price | Price Change |
Sold Properties
|
|---|---|---|---|
| 2025 | £242,719 | -4% |
70 Properties |
| 2024 | £253,367 | 5% |
68 Properties |
| 2023 | £241,502 | -1% |
66 Properties |
| 2022 | £245,010 | 6% |
72 Properties |
| 2021 | £231,337 | 14% |
131 Properties |
| 2020 | £198,361 | 4% |
63 Properties |
| 2019 | £190,348 | 4% |
83 Properties |
| 2018 | £182,100 | 11% |
108 Properties |
| 2017 | £162,475 | 2% |
93 Properties |
| 2016 | £159,759 | 7% |
92 Properties |
| 2015 | £148,890 | 7% |
106 Properties |
| 2014 | £138,906 | 4% |
102 Properties |
| 2013 | £133,353 | 4% |
78 Properties |
| 2012 | £127,599 | -1% |
76 Properties |
| 2011 | £128,957 | -6% |
58 Properties |
| 2010 | £136,788 | 9% |
115 Properties |
| 2009 | £124,316 | -11% |
89 Properties |
| 2008 | £138,246 | -1% |
96 Properties |
| 2007 | £139,890 | 6% |
97 Properties |
| 2006 | £131,309 | 4% |
96 Properties |
| 2005 | £126,120 | -6% |
110 Properties |
| 2004 | £133,873 | 21% |
115 Properties |
| 2003 | £105,861 | 19% |
110 Properties |
| 2002 | £86,058 | 19% |
120 Properties |
| 2001 | £69,314 | 16% |
116 Properties |
| 2000 | £58,130 | 12% |
115 Properties |
| 1999 | £51,269 | 7% |
120 Properties |
| 1998 | £47,783 | 3% |
101 Properties |
| 1997 | £46,377 | 9% |
133 Properties |
| 1996 | £42,427 | -4% |
94 Properties |
| 1995 | £44,141 | - |
88 Properties |
Property Price per Property Type in Beeston Rylands
Here you can find historic sold price data in order to help with your property search.
The average Property Paid Price for specific property types in the last three years are:
| Property Type | Average Sold Price | Sold Properties |
|---|---|---|
| Semi Detached House | £255,859.00 | 98 Semi Detached Houses |
| Detached House | £371,241.00 | 21 Detached Houses |
| Terraced House | £217,424.00 | 67 Terraced Houses |
| Flat | £151,156.00 | 18 Flats |

