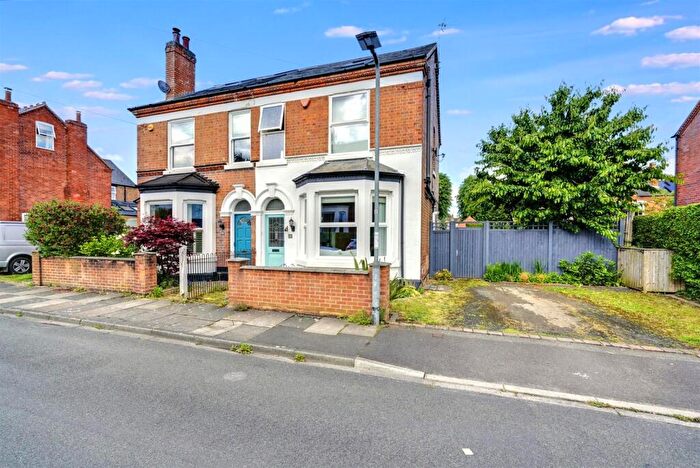
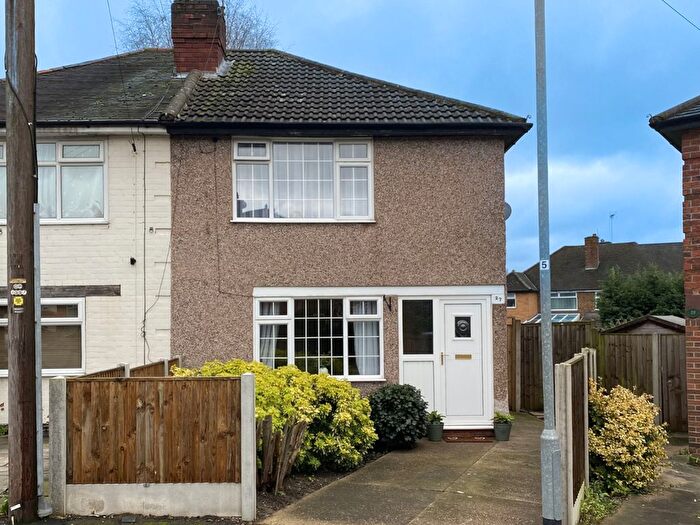
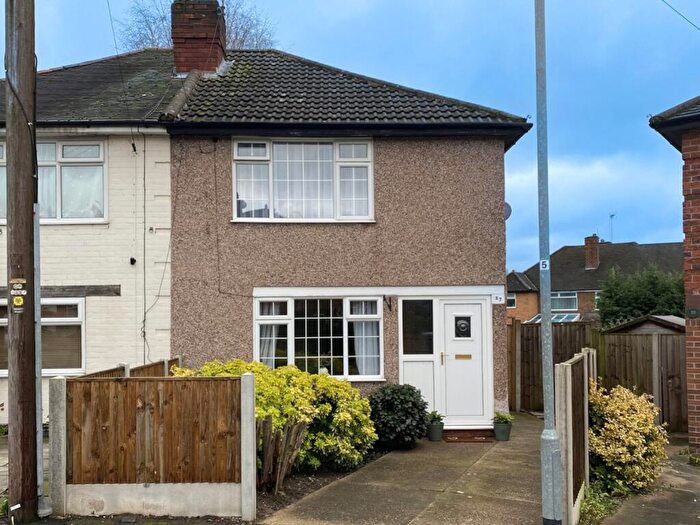
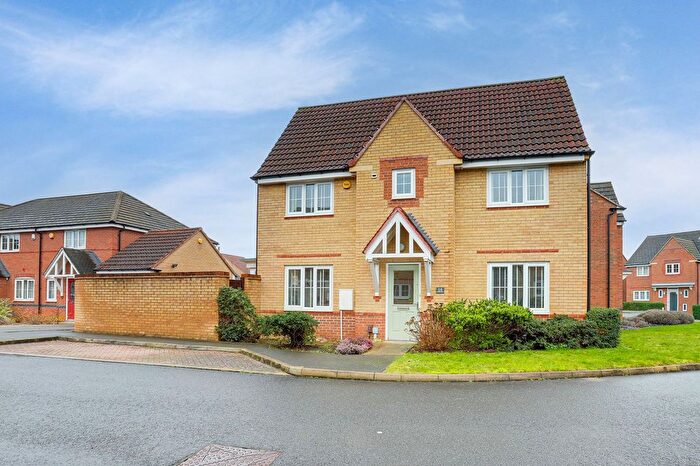
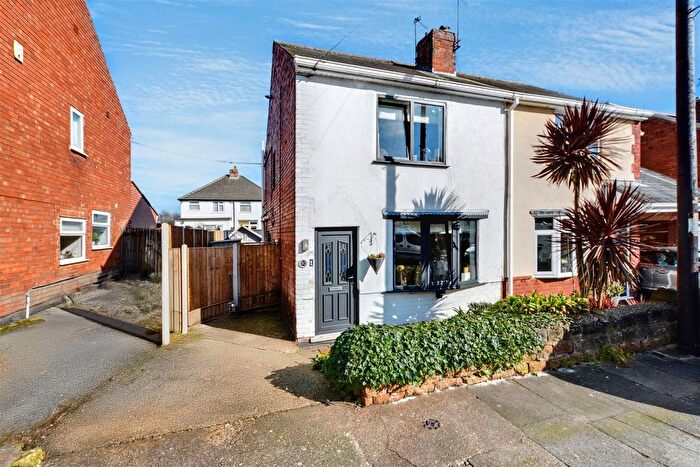
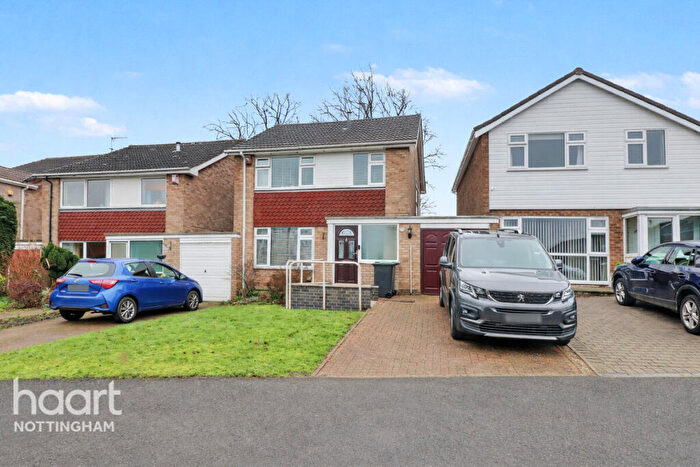
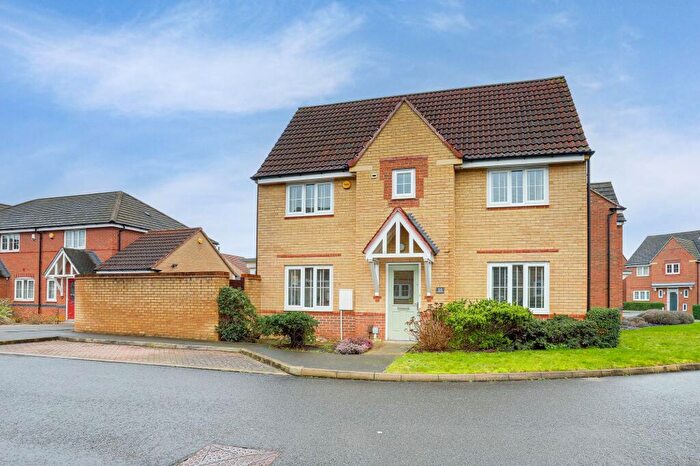
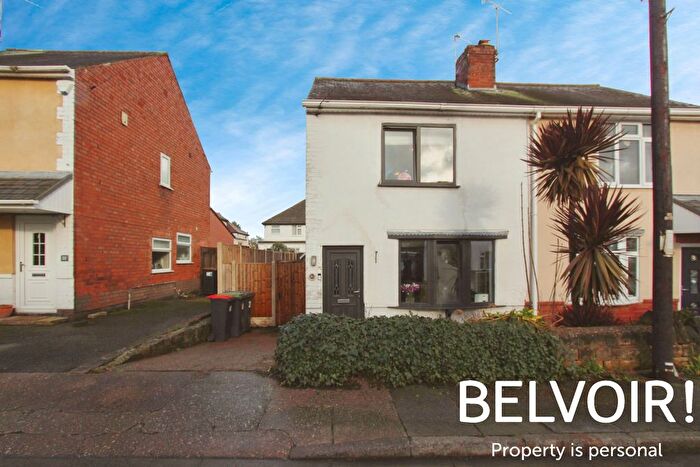
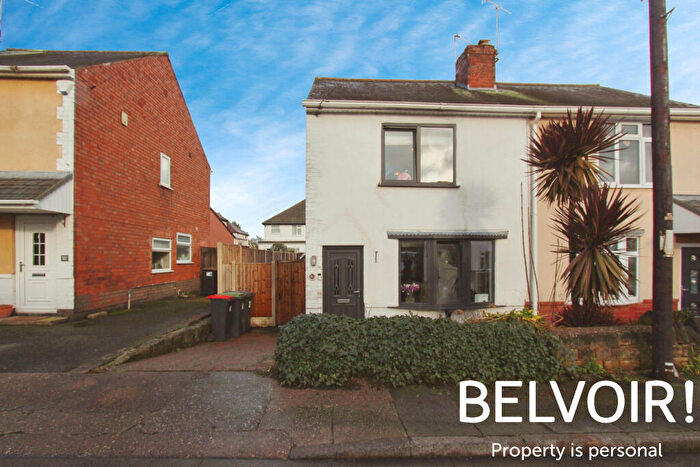
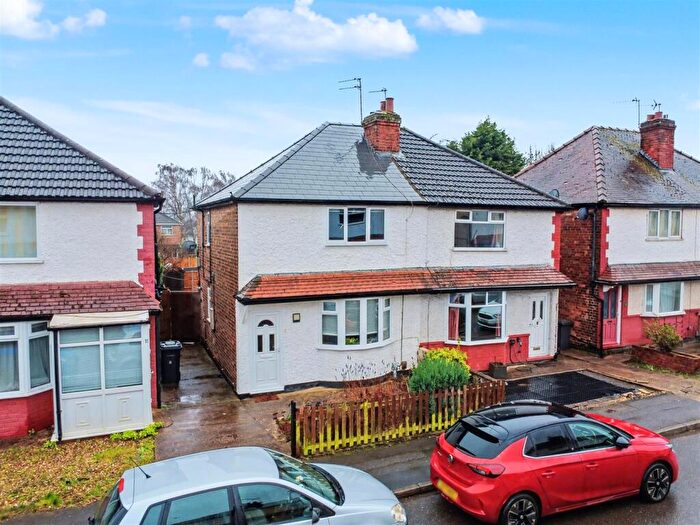
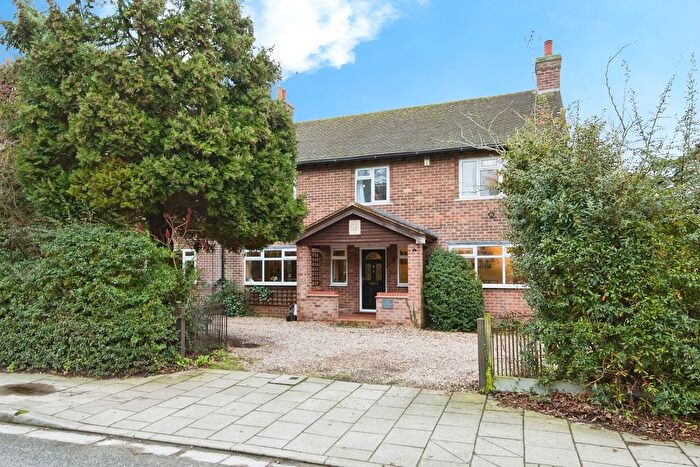
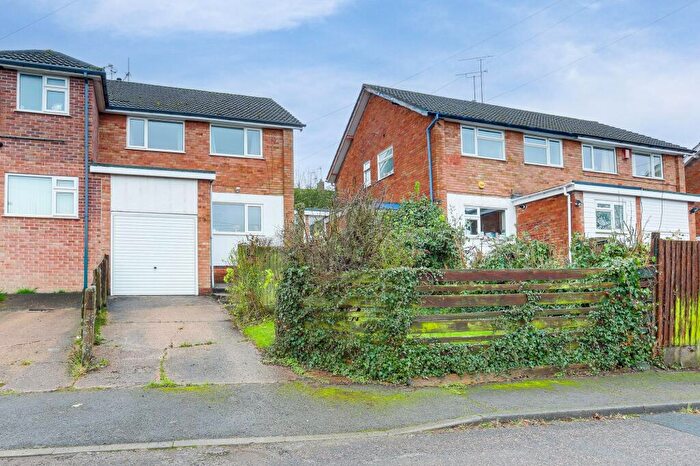
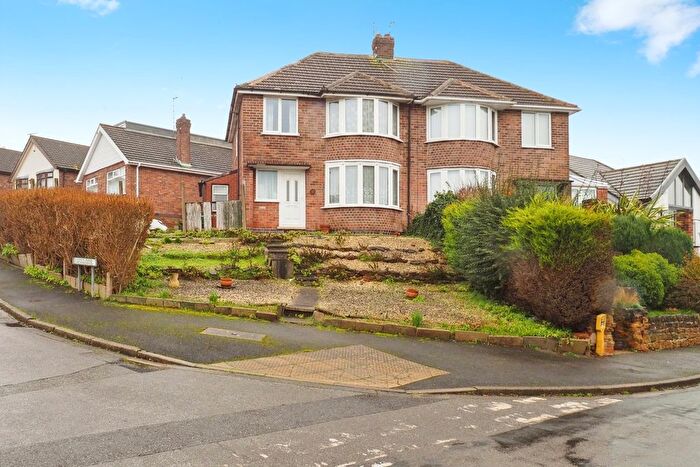
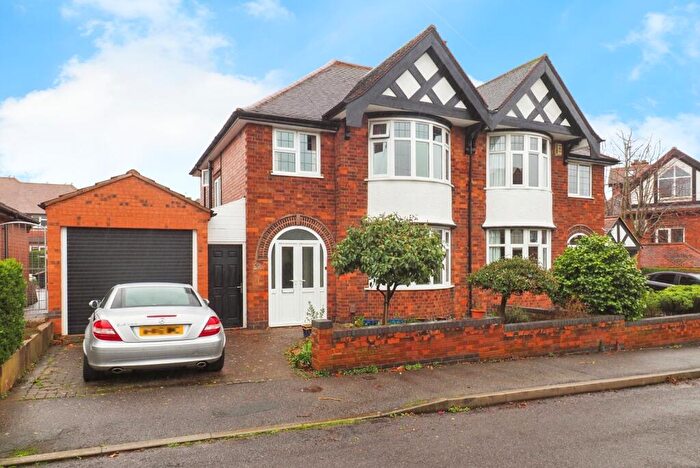
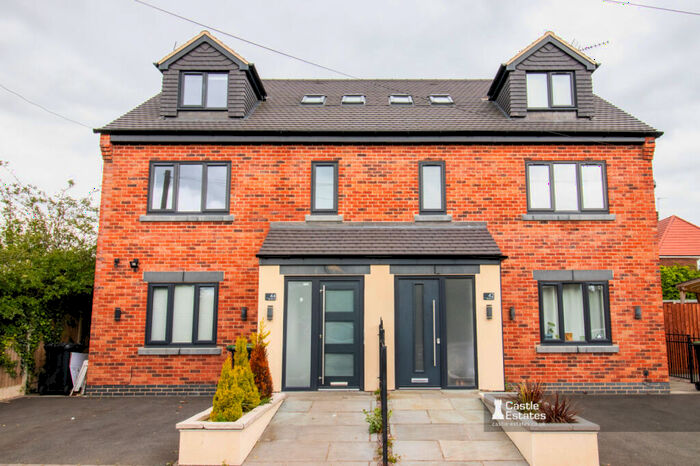
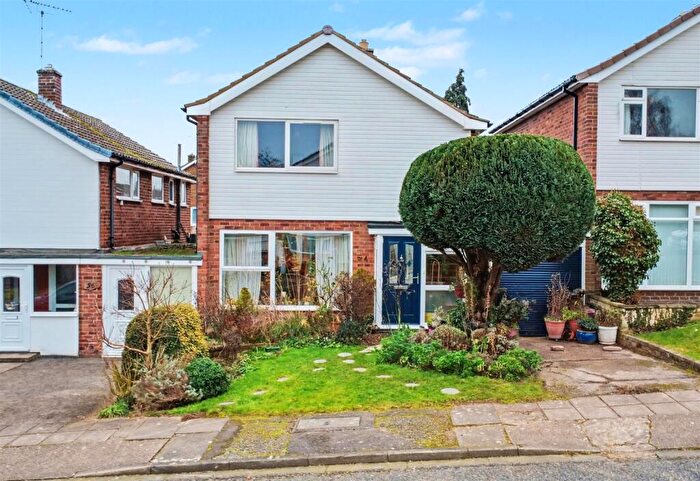
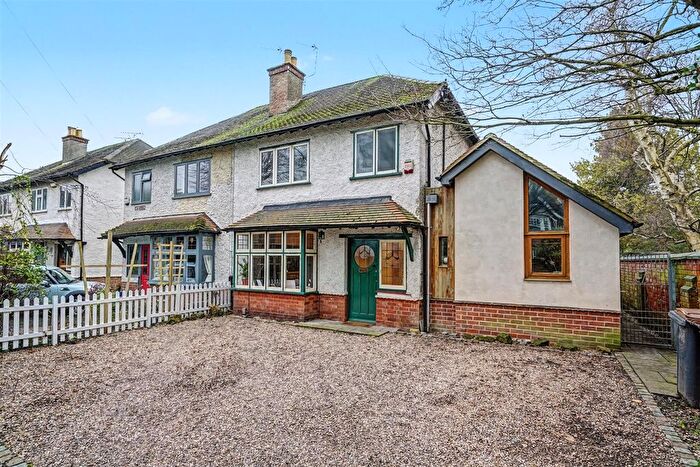
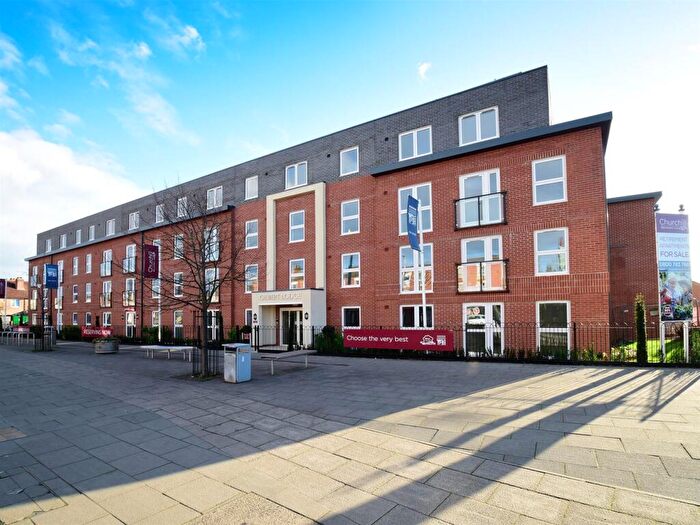
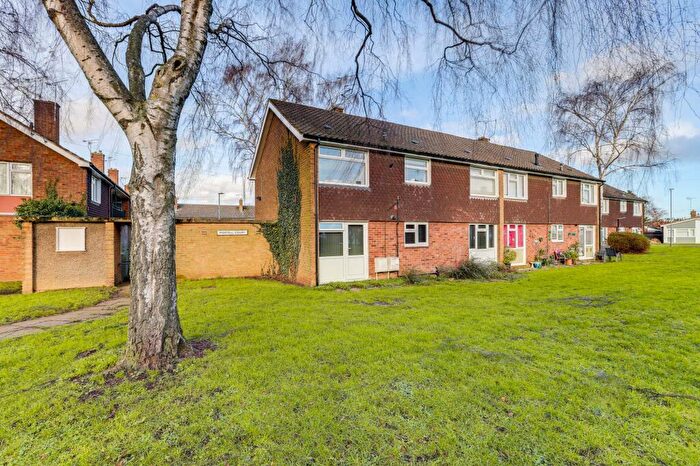
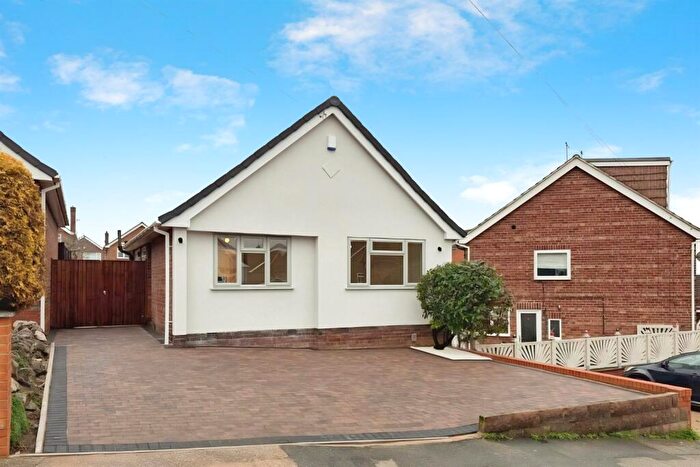
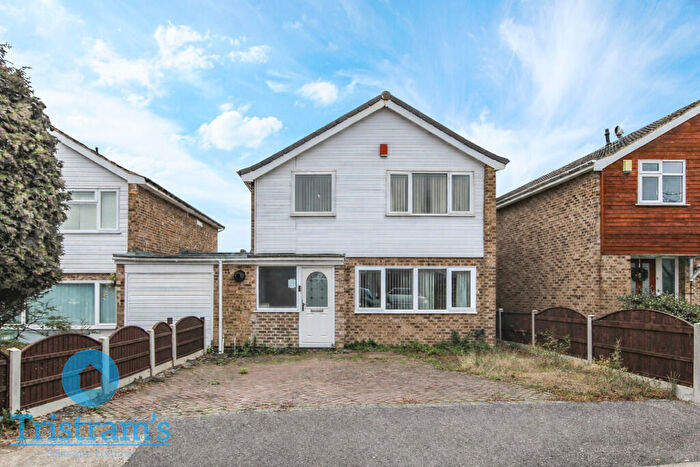
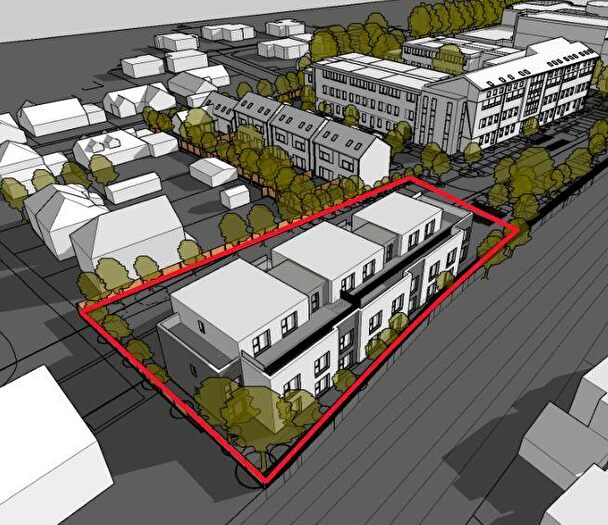
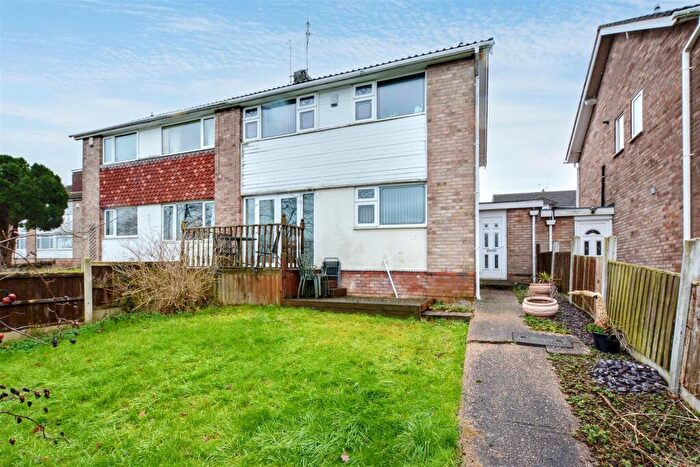
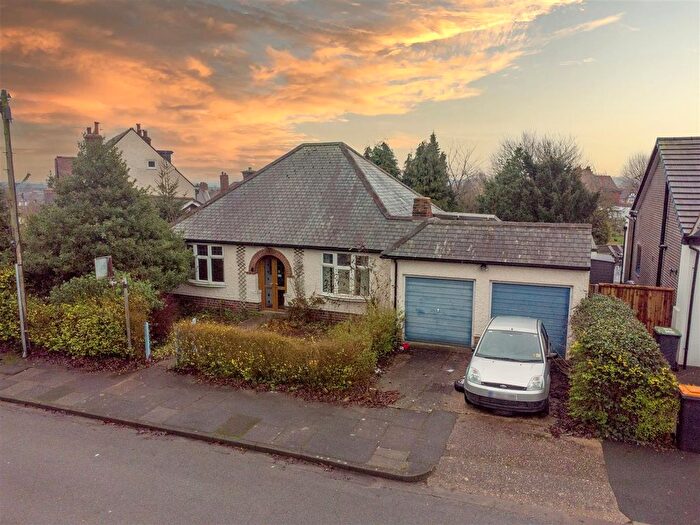
Houses for sale & to rent in Chilwell East, Nottingham
House Prices in Chilwell East
Properties in Chilwell East have an average house price of £340,106.00 and had 203 Property Transactions within the last 3 years¹.
Chilwell East is an area in Nottingham, Nottinghamshire with 2,028 households², where the most expensive property was sold for £940,000.00.
Properties for sale in Chilwell East
Roads and Postcodes in Chilwell East
Navigate through our locations to find the location of your next house in Chilwell East, Nottingham for sale or to rent.
| Streets | Postcodes |
|---|---|
| Abingdon Gardens | NG9 5BJ |
| Aldene Court | NG9 5BS |
| Allison Gardens | NG9 5DG |
| Andrews Court | NG9 4BS |
| Ashley Close | NG9 4BQ |
| Attenborough Lane | NG9 5HZ NG9 5JP |
| Audon Avenue | NG9 4AW |
| Babington Court | NG9 5BT |
| Bramcote Avenue | NG9 4DR NG9 4DT NG9 4DW NG9 4EY NG9 4FE |
| Bramcote Lane | NG9 4ES NG9 4EX NG9 5EN |
| Bramwell Drive | NG9 3ST |
| Bridge Avenue | NG9 4AP |
| Brookland Drive | NG9 4BD |
| Bye Pass Road | NG9 5BN NG9 5HH NG9 5HL |
| Calvert Close | NG9 5HG |
| Cator Lane | NG9 4AX NG9 4AY NG9 4BB NG9 4BE NG9 4BG |
| Cator Lane North | NG9 4BL NG9 4BP |
| Central Avenue | NG9 4DU |
| Chantrey Close | NG9 5DJ |
| Charles Avenue | NG9 5ED NG9 5EE |
| Chilwell Lane | NG9 3DU |
| Clarkes Lane | NG9 5BG NG9 5BL |
| Cliffgrove Avenue | NG9 4DP |
| Clumber Avenue | NG9 4BH NG9 4BJ |
| College Road | NG9 4AS |
| Fairway Drive | NG9 4BN |
| Farm Road | NG9 5BZ NG9 5DA |
| Fieldfare Close | NG9 3SY |
| Forge Hill | NG9 5DW |
| Gatehouse Court | NG9 5DU |
| Gwenbrook Avenue | NG9 4BA |
| Gwenbrook Road | NG9 4AZ |
| Hall Drive | NG9 5BU NG9 5BW NG9 5BX NG9 5BY |
| Hallams Lane | NG9 5FH |
| Harris Road | NG9 4FB NG9 4FD |
| Heathfield Grove | NG9 5EB |
| Helen Close | NG9 4DS |
| High Road | NG9 4AG NG9 4AQ NG9 4AT NG9 5BA NG9 5BB NG9 5DB NG9 5DD NG9 5DL NG9 5DN NG9 5EA |
| Highgrove Avenue | NG9 4DN |
| Holly Lane | NG9 4AB |
| Hurts Croft | NG9 5DE |
| Karen Gardens | NG9 5DX |
| Kingrove Avenue | NG9 4DQ |
| Kingsbridge Way | NG9 3LW |
| Kirk Close | NG9 5EY |
| Lime Grove Avenue | NG9 4AR |
| Lynton Road | NG9 4FT |
| Meadow Gardens | NG9 5AZ |
| Meadow Lane | NG9 5AA |
| Mottram Road | NG9 4EZ NG9 4FW |
| Norman Close | NG9 4EW |
| Oban Road | NG9 4FX |
| Oldham Court | NG9 5DS |
| Park View Court | NG9 4EF |
| Perkins Way | NG9 5JB NG9 5JD |
| Raynford Avenue | NG9 5DR |
| Reeders Croft | NG9 5BF |
| Ruskin Avenue | NG9 5DH |
| School Lane | NG9 5EH |
| Scrivelsby Gardens | NG9 5HJ |
| Shelford Close | NG9 5BH |
| Siskin Close | NG9 3SX |
| Sutton Grove Bramcote Avenue | NG9 4EJ |
| The Close | NG9 5DF |
| The Green | NG9 5BE |
| The Nook | NG9 5AB |
| The Twitchell | NG9 5BD |
| Turnberry Close | NG9 3LX |
| Wilmore Close | NG9 5GT |
| Woodland Grove | NG9 5BP NG9 5BQ |
| Woodville Close | NG9 4FU |
Transport near Chilwell East
-
Attenborough Station
-
Beeston Station
-
Long Eaton Station
-
Nottingham Station
-
East Midlands Parkway Station
-
Ilkeston Station
- FAQ
- Price Paid By Year
- Property Type Price
Frequently asked questions about Chilwell East
What is the average price for a property for sale in Chilwell East?
The average price for a property for sale in Chilwell East is £340,106. This amount is 20% higher than the average price in Nottingham. There are 1,377 property listings for sale in Chilwell East.
What streets have the most expensive properties for sale in Chilwell East?
The streets with the most expensive properties for sale in Chilwell East are Hurts Croft at an average of £645,000, Kingsbridge Way at an average of £591,000 and Forge Hill at an average of £550,000.
What streets have the most affordable properties for sale in Chilwell East?
The streets with the most affordable properties for sale in Chilwell East are Park View Court at an average of £147,500, Aldene Court at an average of £211,000 and Mottram Road at an average of £213,461.
Which train stations are available in or near Chilwell East?
Some of the train stations available in or near Chilwell East are Attenborough, Beeston and Long Eaton.
Property Price Paid in Chilwell East by Year
The average sold property price by year was:
| Year | Average Sold Price | Price Change |
Sold Properties
|
|---|---|---|---|
| 2025 | £379,098 | 12% |
56 Properties |
| 2024 | £334,825 | 6% |
72 Properties |
| 2023 | £316,063 | -13% |
75 Properties |
| 2022 | £358,592 | 15% |
90 Properties |
| 2021 | £305,712 | 12% |
104 Properties |
| 2020 | £269,273 | 14% |
70 Properties |
| 2019 | £230,294 | -18% |
61 Properties |
| 2018 | £271,718 | 20% |
88 Properties |
| 2017 | £217,651 | -3% |
93 Properties |
| 2016 | £224,255 | 4% |
115 Properties |
| 2015 | £215,643 | 9% |
70 Properties |
| 2014 | £195,936 | 8% |
95 Properties |
| 2013 | £180,149 | -8% |
101 Properties |
| 2012 | £193,694 | 4% |
84 Properties |
| 2011 | £185,939 | -15% |
70 Properties |
| 2010 | £213,986 | 14% |
67 Properties |
| 2009 | £183,105 | -8% |
82 Properties |
| 2008 | £197,420 | 2% |
64 Properties |
| 2007 | £194,251 | 4% |
101 Properties |
| 2006 | £186,188 | -1% |
77 Properties |
| 2005 | £187,906 | 10% |
64 Properties |
| 2004 | £169,468 | 17% |
79 Properties |
| 2003 | £140,961 | 8% |
90 Properties |
| 2002 | £129,734 | 18% |
94 Properties |
| 2001 | £106,216 | 23% |
118 Properties |
| 2000 | £81,776 | 3% |
96 Properties |
| 1999 | £78,920 | 8% |
115 Properties |
| 1998 | £72,333 | 14% |
91 Properties |
| 1997 | £62,073 | -7% |
100 Properties |
| 1996 | £66,425 | 14% |
101 Properties |
| 1995 | £57,176 | - |
63 Properties |
Property Price per Property Type in Chilwell East
Here you can find historic sold price data in order to help with your property search.
The average Property Paid Price for specific property types in the last three years are:
| Property Type | Average Sold Price | Sold Properties |
|---|---|---|
| Semi Detached House | £295,309.00 | 101 Semi Detached Houses |
| Detached House | £405,726.00 | 86 Detached Houses |
| Terraced House | £278,366.00 | 15 Terraced Houses |
| Flat | £147,500.00 | 1 Flat |

