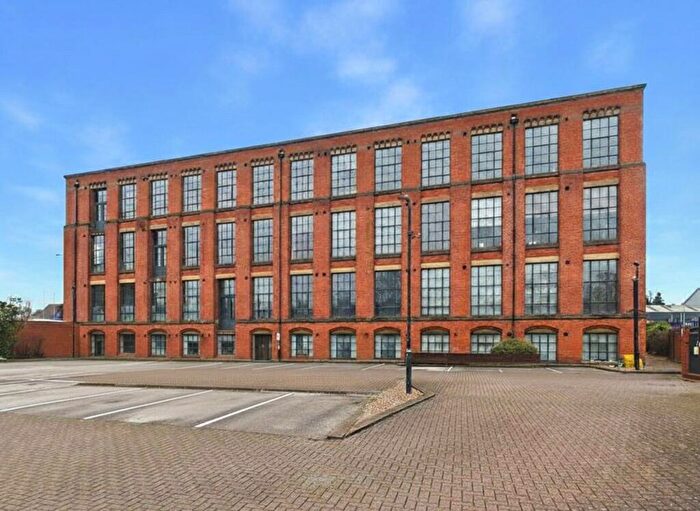
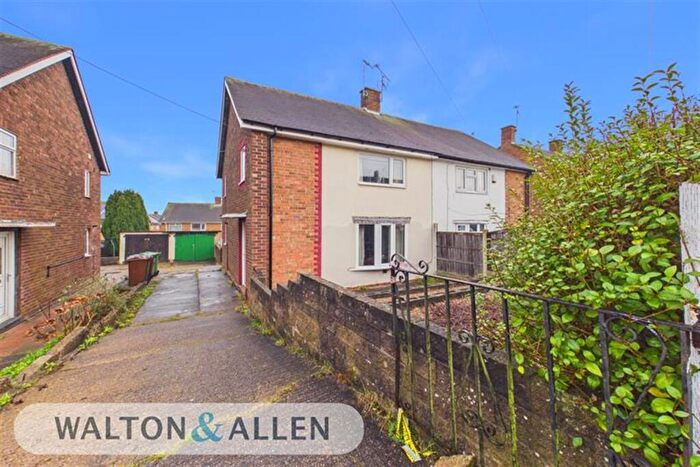
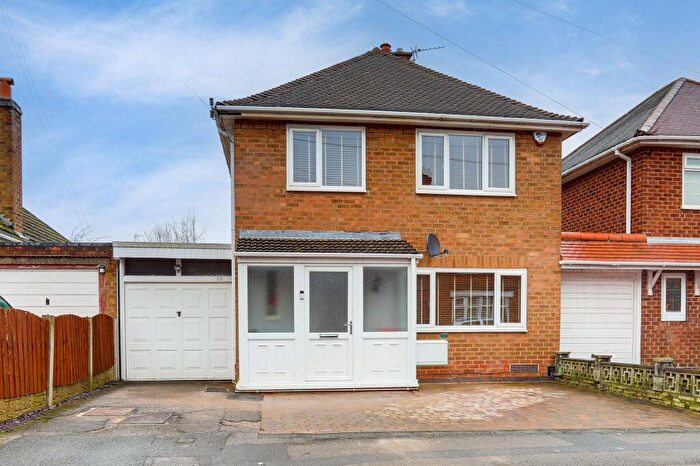
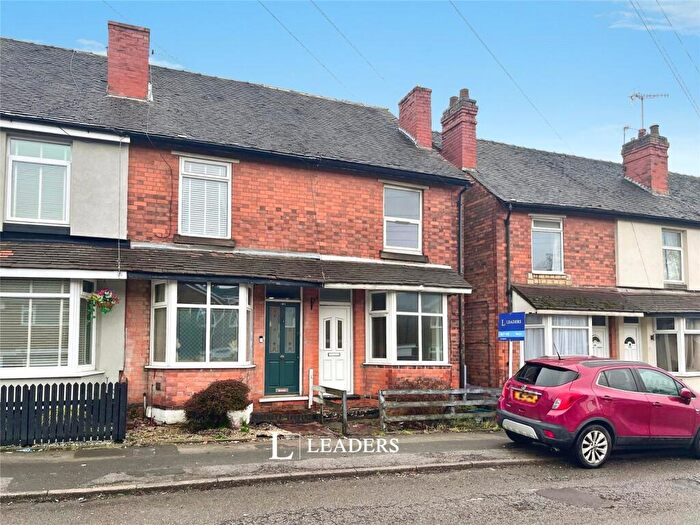
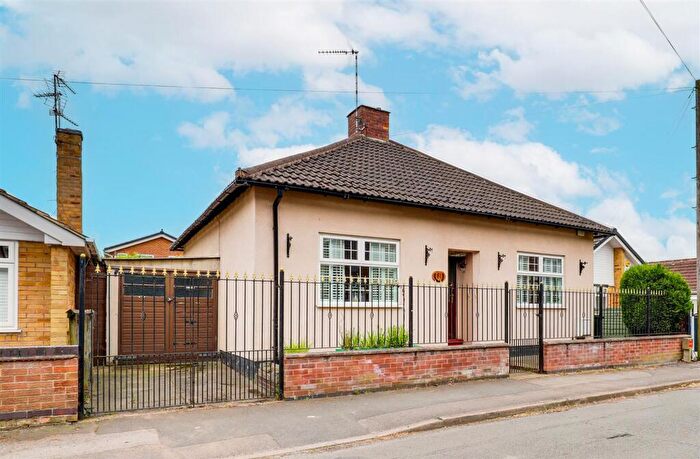
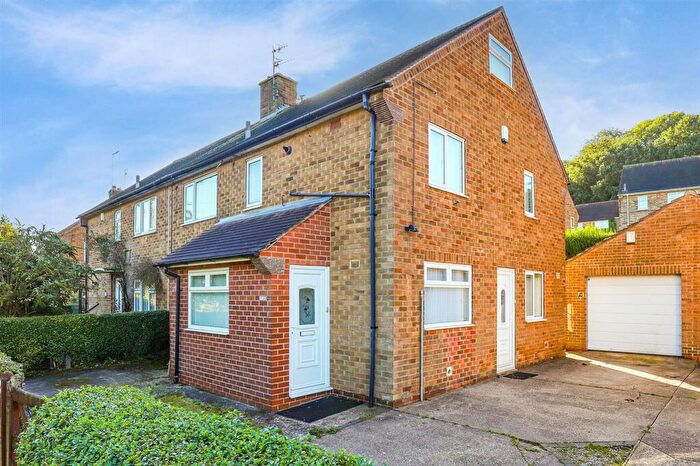
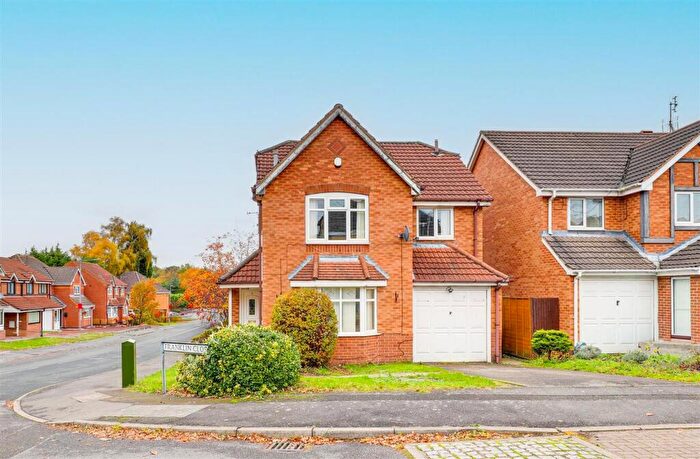
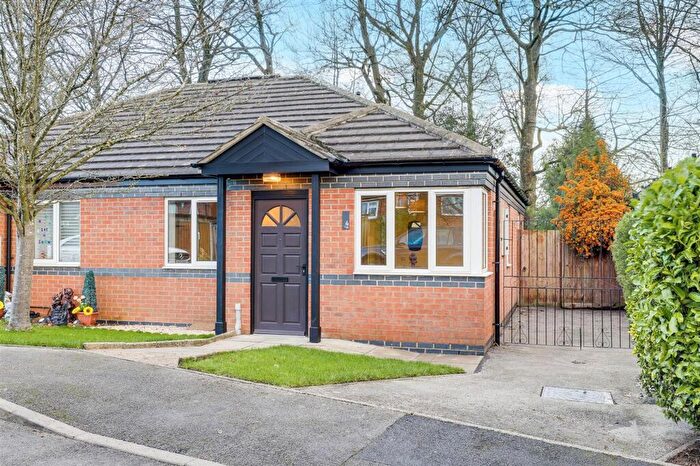
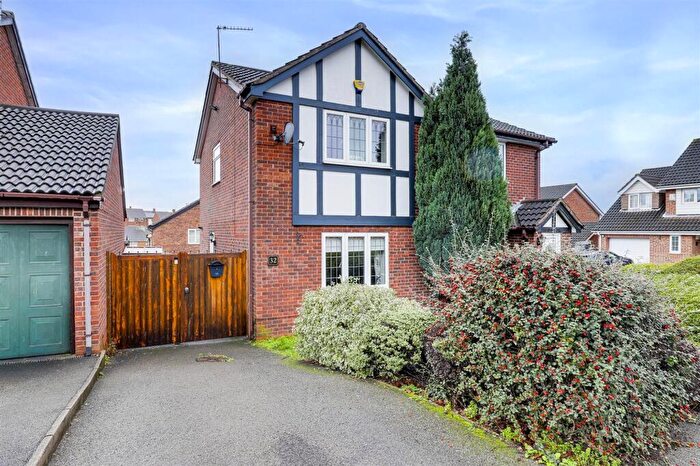
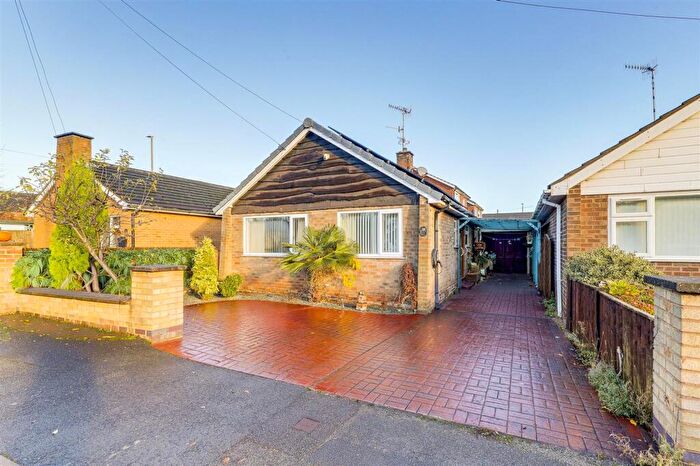
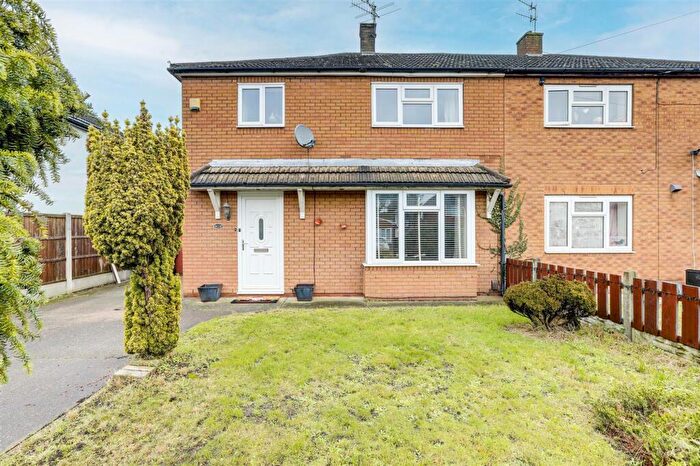
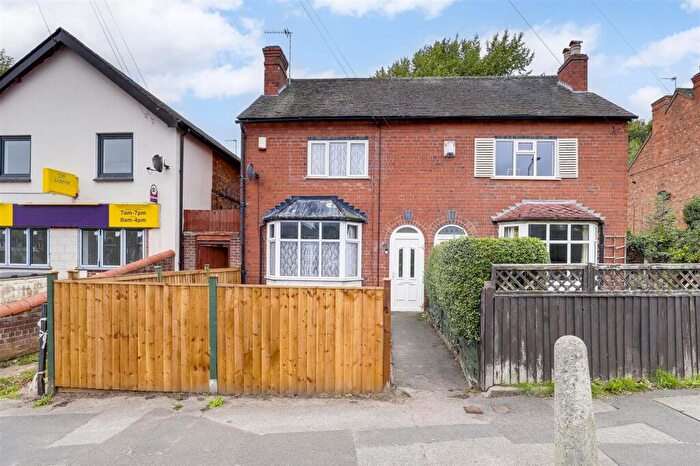
Houses for sale & to rent in Bonington, Nottingham
House Prices in Bonington
Properties in Bonington have an average house price of £214,104.00 and had 278 Property Transactions within the last 3 years¹.
Bonington is an area in Nottingham, Nottinghamshire with 2,927 households², where the most expensive property was sold for £950,000.00.
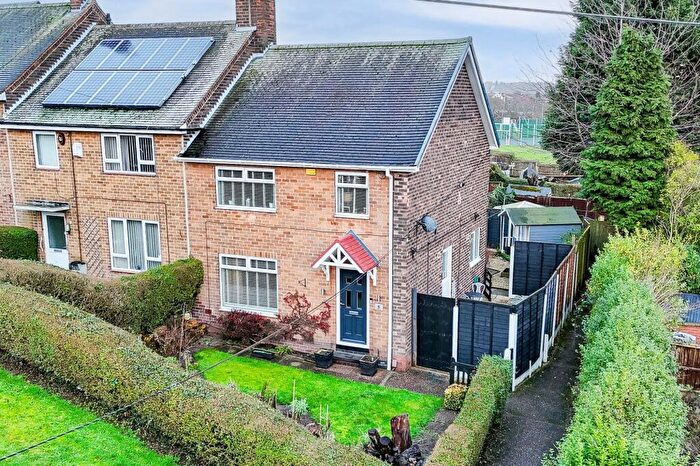
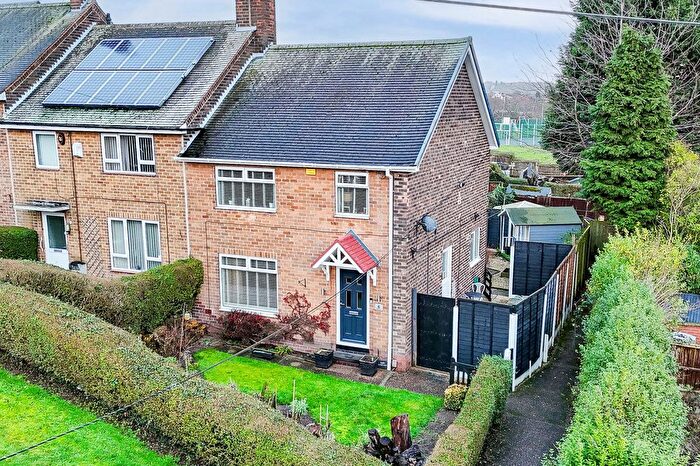
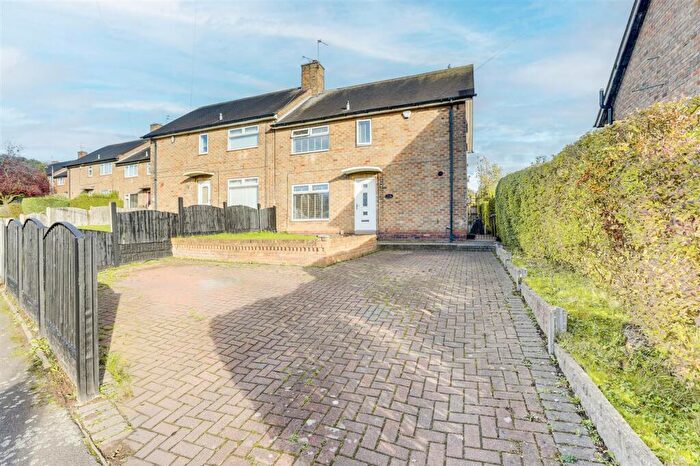
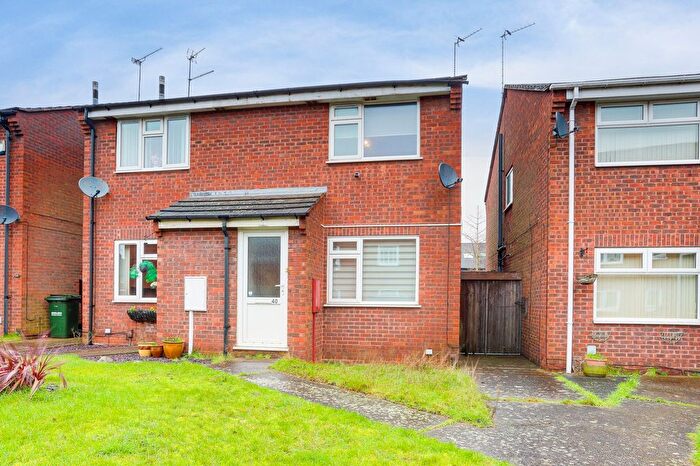
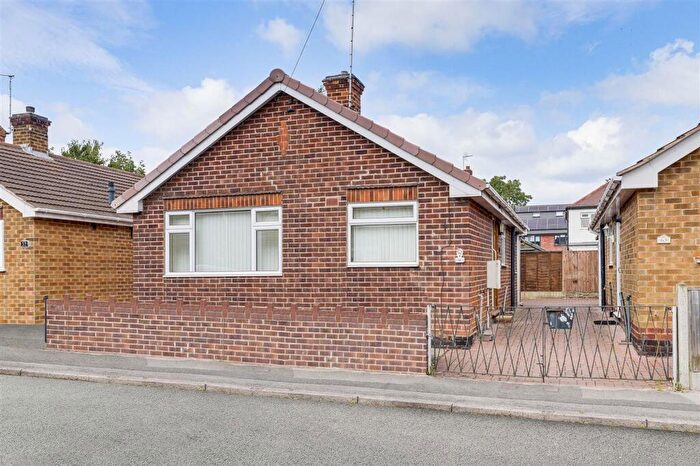
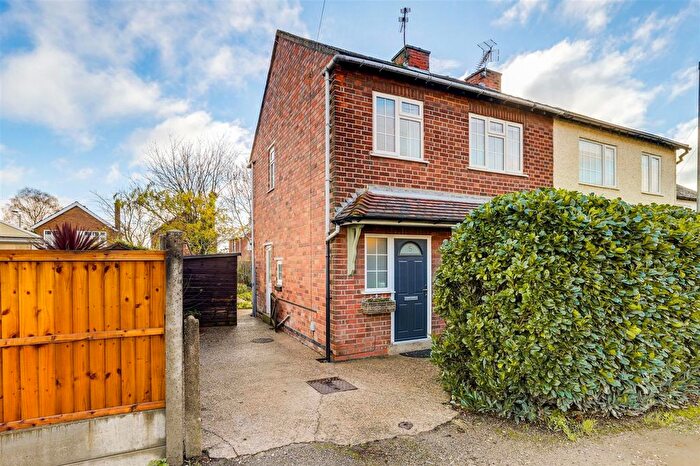
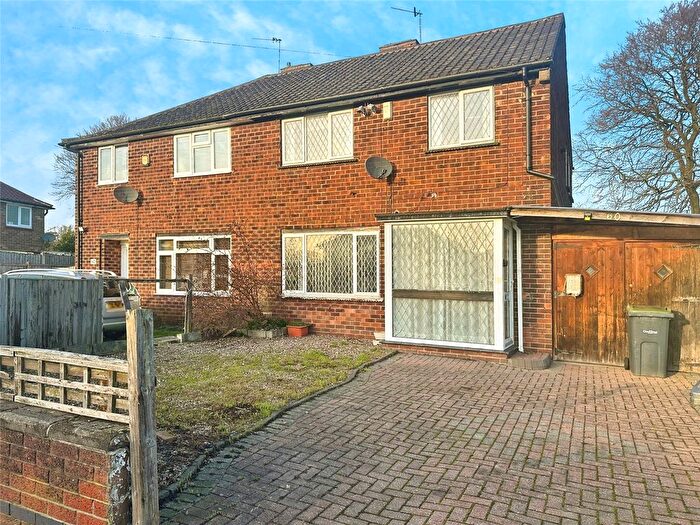
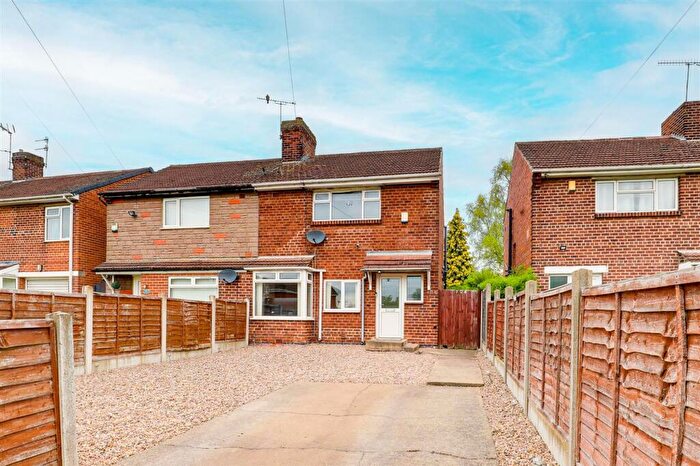
Properties for sale in Bonington
Roads and Postcodes in Bonington
Navigate through our locations to find the location of your next house in Bonington, Nottingham for sale or to rent.
| Streets | Postcodes |
|---|---|
| Aidan Gardens | NG5 9PF |
| Aldwych Close | NG5 9PP |
| Allens Walk | NG5 8GU |
| Appledorne Way | NG5 8JQ |
| Ascot Drive | NG5 8LR |
| Augustine Gardens | NG5 9NX |
| Bestwood Close | NG5 7AN |
| Bestwood Lodge Stables | NG5 8ND |
| Bestwood Park | NG5 8NF |
| Bewcastle Road | NG5 9PJ |
| Birch Lea | NG5 8LT |
| Bond Street | NG5 7DP |
| Boniface Gardens | NG5 9NZ |
| Brompton Close | NG5 9QJ |
| Bullins Close | NG5 8SE |
| Burford Street | NG5 7DH |
| Cairngorm Drive | NG5 9PY |
| Campion Street | NG5 8GR |
| Cavendish Street | NG5 7DL |
| Cedar Tree Road | NG5 8NN |
| Chad Gardens | NG5 9PE |
| Cherry Close | NG5 8GS |
| Cheviot Close | NG5 9PS |
| Chiltern Close | NG5 9PX |
| Church Street | NG5 8FD |
| Church View Close | NG5 9QP |
| Cross Street | NG5 7AT NG5 7AX NG5 7BD NG5 7BG NG5 7BH NG5 7BL NG5 7BY |
| Deer Park Drive | NG5 8SA NG5 8SF |
| Devon Circus | NG5 8JG |
| Edmonds Close | NG5 9QD |
| Emmanuel Avenue | NG5 9QN |
| Enderby Gardens | NG5 8LX |
| Fenchurch Close | NG5 9PW |
| Finsbury Road | NG5 9QF |
| Furlong Avenue | NG5 7AP NG5 7AQ NG5 7AR NG5 7AS |
| Furlong Street | NG5 7AE NG5 7AF NG5 7AJ NG5 7BN NG5 7BP |
| Galway Road | NG5 7AY |
| Gerrard Close | NG5 9QL |
| Glen Parva Avenue | NG5 8LZ |
| Goodwood Avenue | NG5 7BB |
| Grampian Drive | NG5 9PR |
| Hadrian Gardens | NG5 9PQ |
| Harberton Close | NG5 8LA |
| Hatton Close | NG5 9QG |
| Henry Street | NG5 8JW |
| Hexham Gardens | NG5 9PD |
| High Street | NG5 7DE NG5 7DG NG5 7DJ NG5 7DQ NG5 7DS |
| High Street Avenue | NG5 7DF |
| Iona Gardens | NG5 9NT |
| James Street | NG5 7BE |
| Jarrow Gardens | NG5 9PH |
| Jermyn Drive | NG5 9PN |
| Lambeth Road | NG5 9QH |
| Larch Close | NG5 8SB |
| Larkspur Avenue | NG5 8JU |
| Lindisfarne Gardens | NG5 9NU |
| Lodge Close | NG5 8NZ |
| Ludgate Close | NG5 9QQ |
| Mansfield Road | NG5 8JD NG5 8JE NG5 8JL NG5 8JP NG5 8JX NG5 8LS NG5 8LW NG5 8NA NG5 8NB |
| Mill Crescent | NG5 7AW |
| Mill Lane | NG5 7AU |
| Monsell Drive | NG5 8LY |
| Moss Close | NG5 8SD |
| Muirfield Road | NG5 9QR |
| Nell Gwyn Crescent | NG5 8NQ |
| Parklands Close | NG5 9QU |
| Pavilion Road | NG5 8NL |
| Pendine Close | NG5 8NS |
| Pennine Close | NG5 9PT |
| Pentland Drive | NG5 9PZ |
| Plantation Close | NG5 9QW |
| Quantock Close | NG5 9QA |
| Redhill Lodge Drive | NG5 8JH |
| Redhill Road | NG5 8GP NG5 8GQ NG5 8GT NG5 8GW NG5 8GX NG5 8GZ |
| Richmond Gardens | NG5 8JS |
| Robin Hood Road | NG5 8NP |
| Roebuck Close | NG5 8RZ |
| Ruthwell Gardens | NG5 9PG |
| Salcombe Circus | NG5 8JJ |
| Salcombe Drive | NG5 8JF |
| Shacklock Close | NG5 9QE |
| Sidlaw Rise | NG5 9PU |
| Springfield Road | NG5 8JN |
| St Emmanuel View | NG5 9QS |
| Stanhope Crescent | NG5 7AZ NG5 7BA |
| Stanhope Road | NG5 7BJ |
| Stockdale Close | NG5 9QB |
| The Mount | NG5 8LU |
| Thornton Avenue | NG5 8PA |
| Tithe Gardens | NG5 9PB |
| Tree View Close | NG5 8SP |
| Tyburn Close | NG5 9PL |
| Wearmouth Gardens | NG5 9PA |
| Woodchurch Road | NG5 8NJ |
| Woodside Drive | NG5 7BS NG5 7BT NG5 7BU NG5 7BW NG5 7BX NG5 7FL NG5 7FN NG5 7HY NG5 7HZ |
Transport near Bonington
-
Bulwell Station
-
Hucknall Station
-
Carlton Station
-
Netherfield Station
-
Nottingham Station
-
Burton Joyce Station
- FAQ
- Price Paid By Year
- Property Type Price
Frequently asked questions about Bonington
What is the average price for a property for sale in Bonington?
The average price for a property for sale in Bonington is £214,104. This amount is 24% lower than the average price in Nottingham. There are 381 property listings for sale in Bonington.
What streets have the most expensive properties for sale in Bonington?
The streets with the most expensive properties for sale in Bonington are Birch Lea at an average of £690,000, Devon Circus at an average of £420,000 and Pavilion Road at an average of £416,666.
What streets have the most affordable properties for sale in Bonington?
The streets with the most affordable properties for sale in Bonington are Aidan Gardens at an average of £79,500, Boniface Gardens at an average of £87,500 and Larkspur Avenue at an average of £108,666.
Which train stations are available in or near Bonington?
Some of the train stations available in or near Bonington are Bulwell, Hucknall and Carlton.
Property Price Paid in Bonington by Year
The average sold property price by year was:
| Year | Average Sold Price | Price Change |
Sold Properties
|
|---|---|---|---|
| 2025 | £217,628 | 0,3% |
83 Properties |
| 2024 | £217,043 | 4% |
98 Properties |
| 2023 | £208,118 | 5% |
97 Properties |
| 2022 | £196,845 | -8% |
126 Properties |
| 2021 | £213,513 | 22% |
134 Properties |
| 2020 | £166,252 | -9% |
103 Properties |
| 2019 | £181,275 | 12% |
119 Properties |
| 2018 | £160,118 | 3% |
116 Properties |
| 2017 | £155,150 | 10% |
117 Properties |
| 2016 | £139,183 | -6% |
126 Properties |
| 2015 | £147,642 | 9% |
108 Properties |
| 2014 | £134,740 | 16% |
154 Properties |
| 2013 | £112,931 | -7% |
91 Properties |
| 2012 | £120,803 | 0,2% |
81 Properties |
| 2011 | £120,514 | 10% |
87 Properties |
| 2010 | £109,048 | -18% |
58 Properties |
| 2009 | £128,860 | 10% |
72 Properties |
| 2008 | £115,335 | -16% |
76 Properties |
| 2007 | £133,931 | 7% |
192 Properties |
| 2006 | £125,100 | 1% |
151 Properties |
| 2005 | £123,487 | 6% |
127 Properties |
| 2004 | £116,112 | 13% |
170 Properties |
| 2003 | £100,982 | 22% |
169 Properties |
| 2002 | £78,739 | 18% |
192 Properties |
| 2001 | £64,924 | 1% |
173 Properties |
| 2000 | £64,050 | 11% |
168 Properties |
| 1999 | £57,005 | 10% |
170 Properties |
| 1998 | £51,124 | -0,1% |
166 Properties |
| 1997 | £51,190 | 13% |
185 Properties |
| 1996 | £44,677 | -4% |
136 Properties |
| 1995 | £46,283 | - |
144 Properties |
Property Price per Property Type in Bonington
Here you can find historic sold price data in order to help with your property search.
The average Property Paid Price for specific property types in the last three years are:
| Property Type | Average Sold Price | Sold Properties |
|---|---|---|
| Semi Detached House | £209,378.00 | 85 Semi Detached Houses |
| Detached House | £326,588.00 | 69 Detached Houses |
| Terraced House | £169,188.00 | 91 Terraced Houses |
| Flat | £114,939.00 | 33 Flats |

