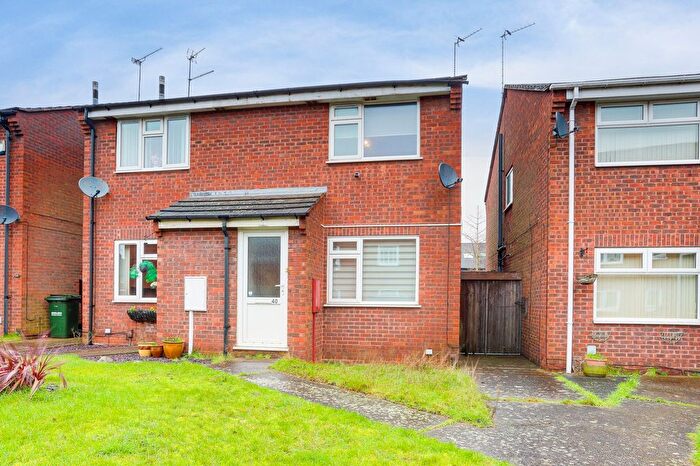
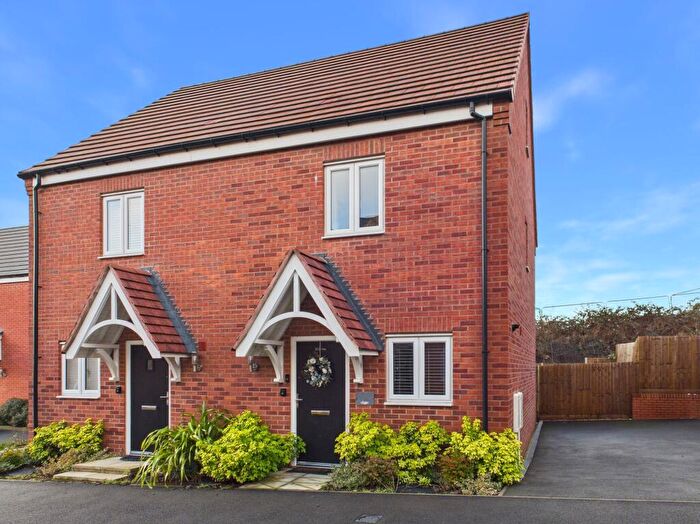
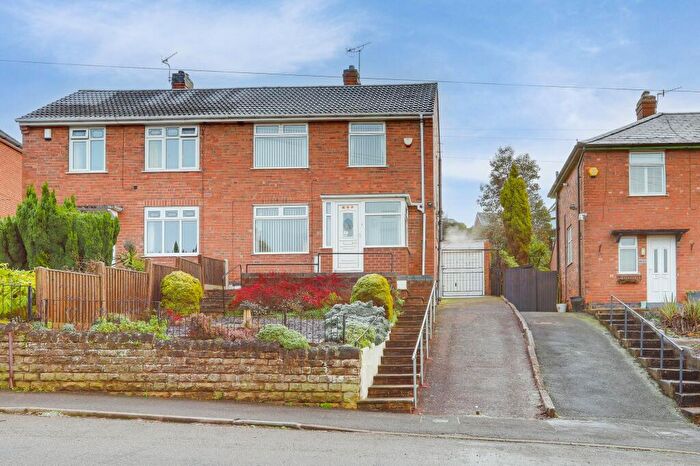
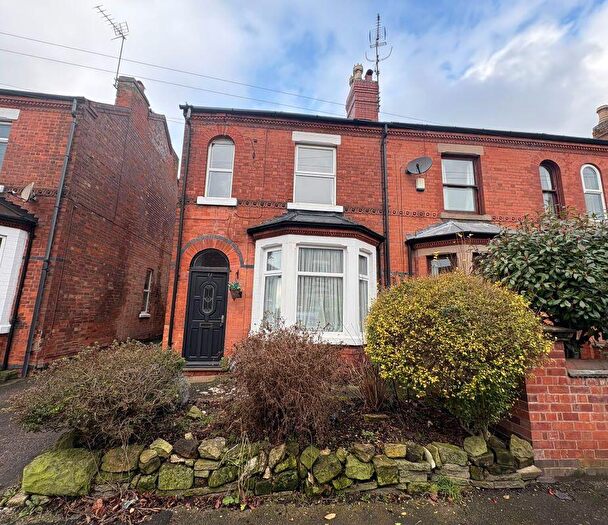
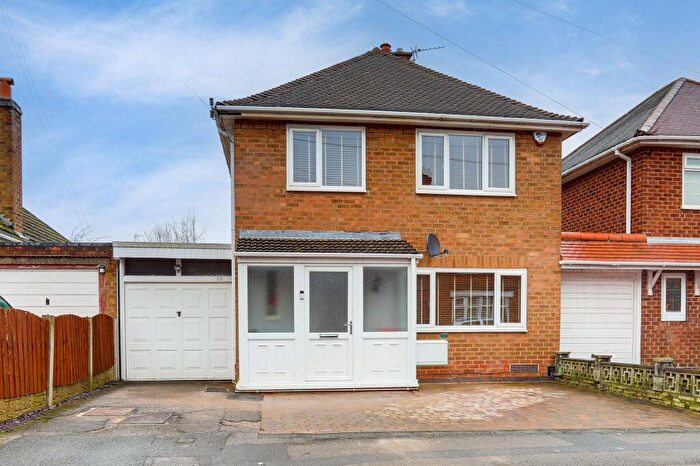
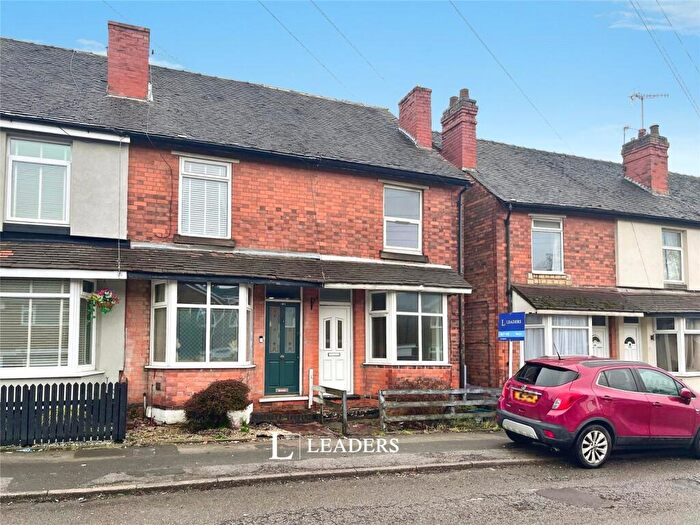
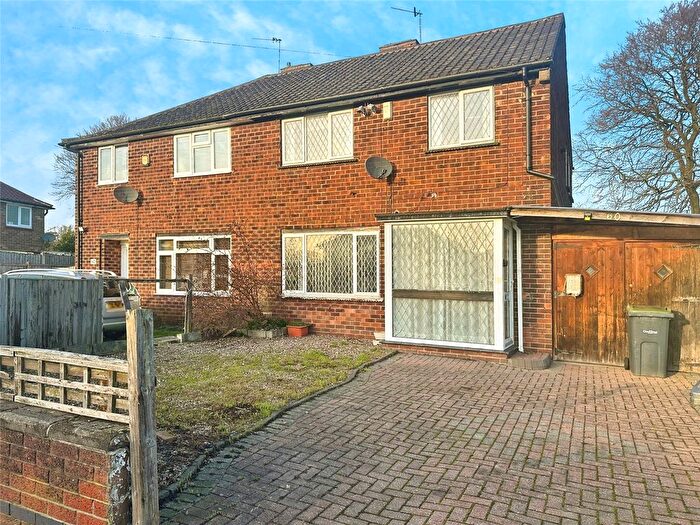
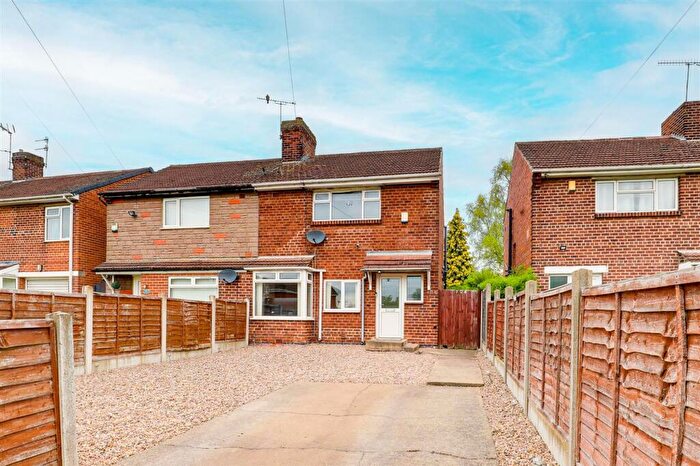
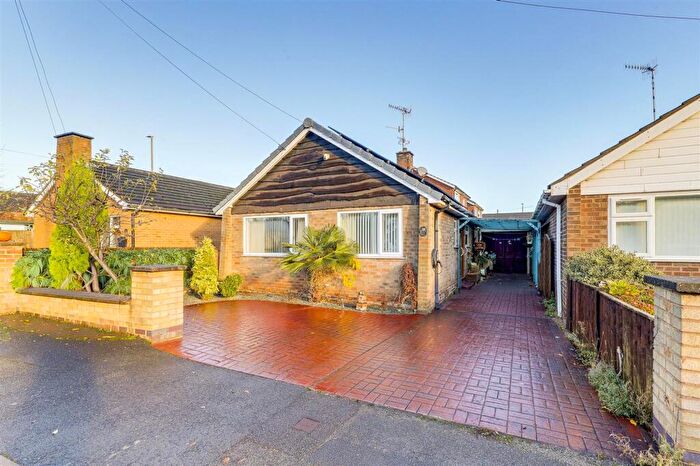
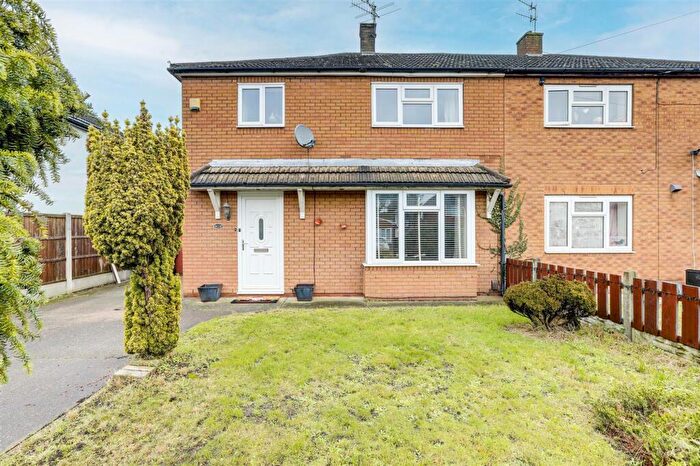
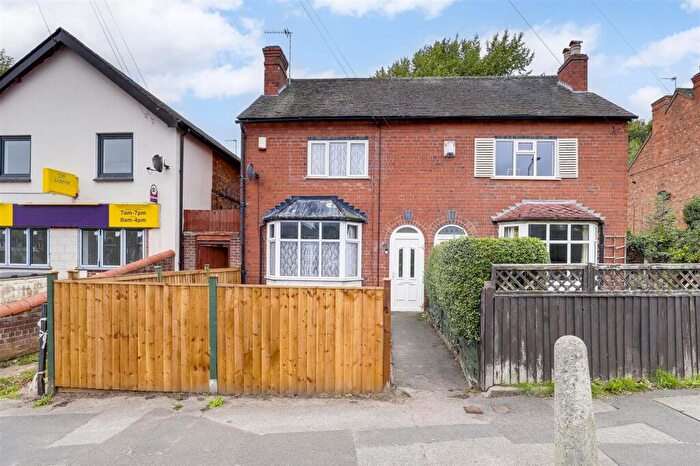
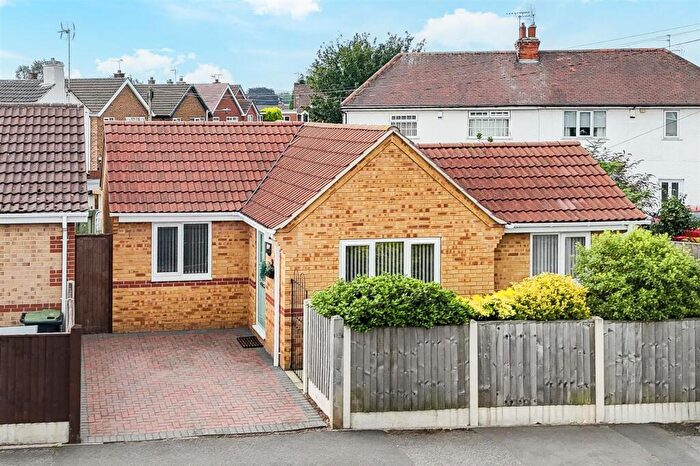
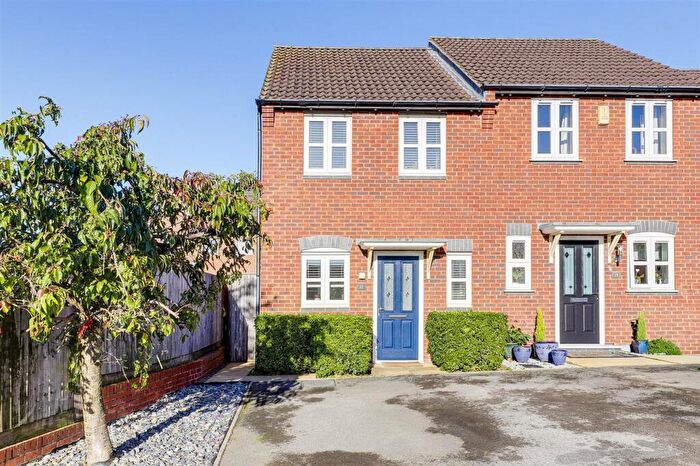
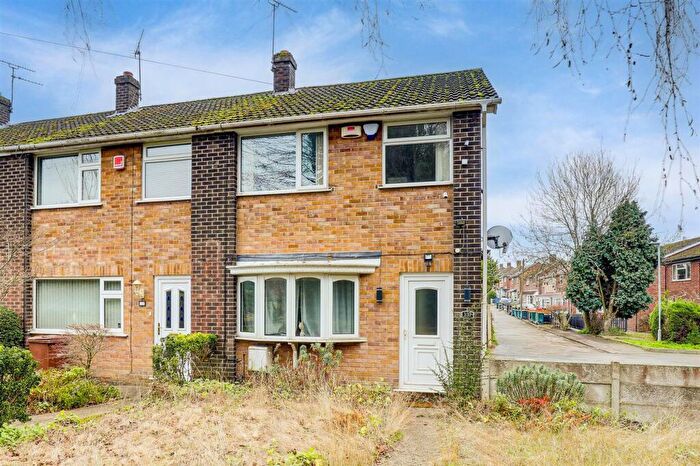
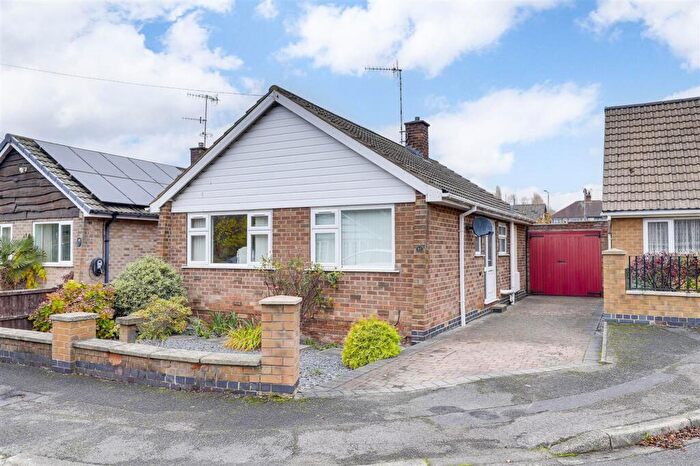
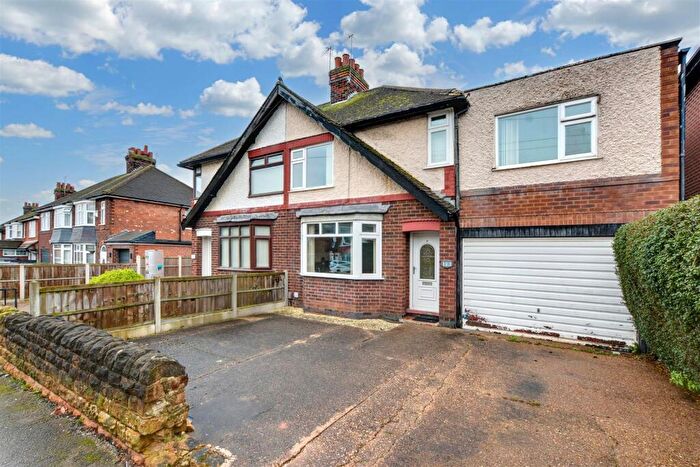
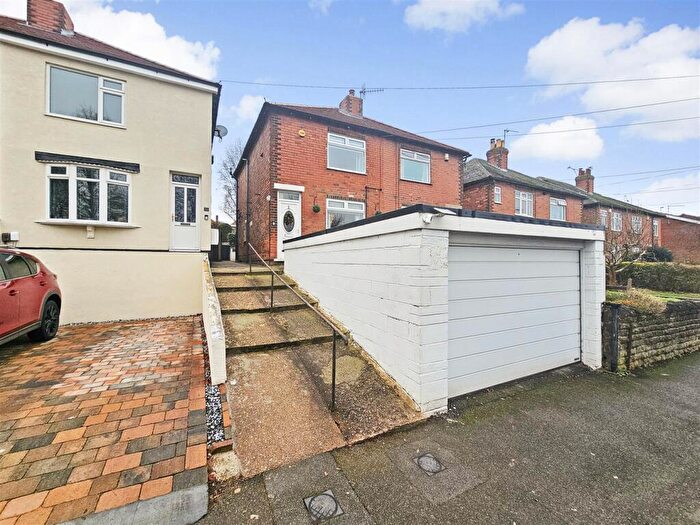
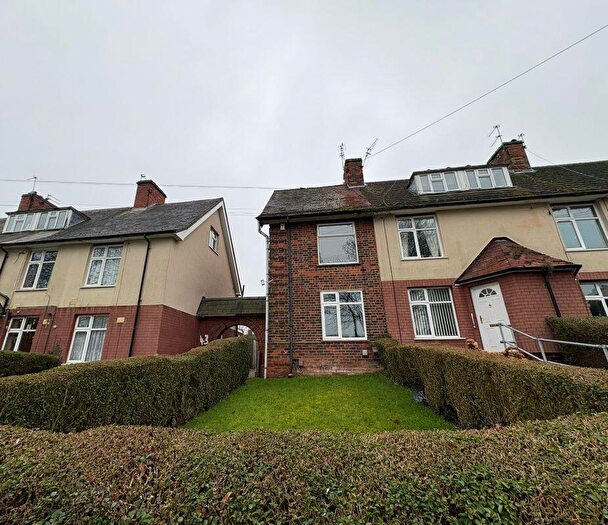
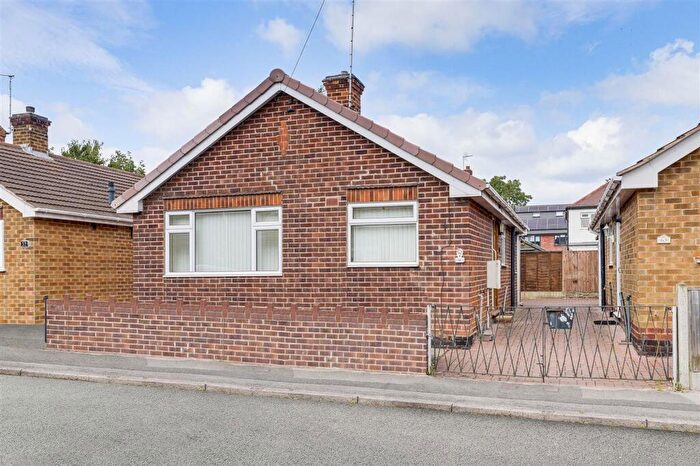
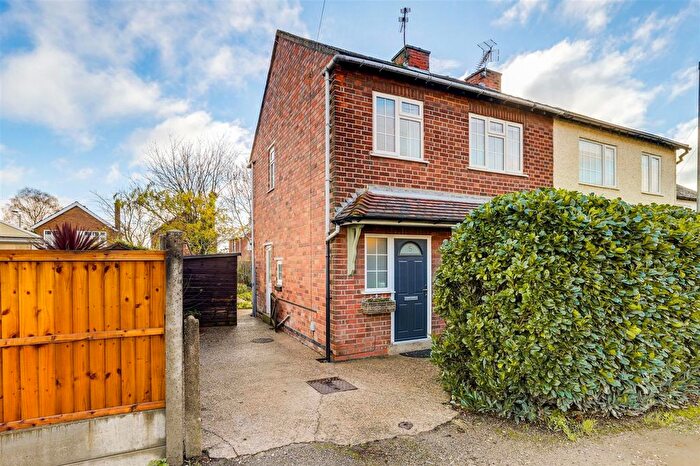
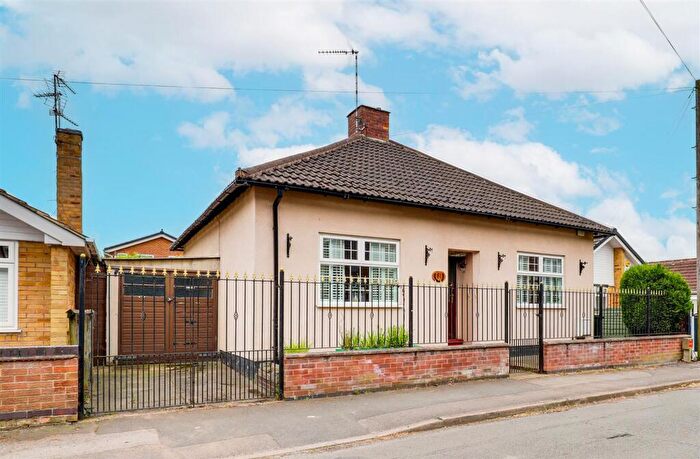
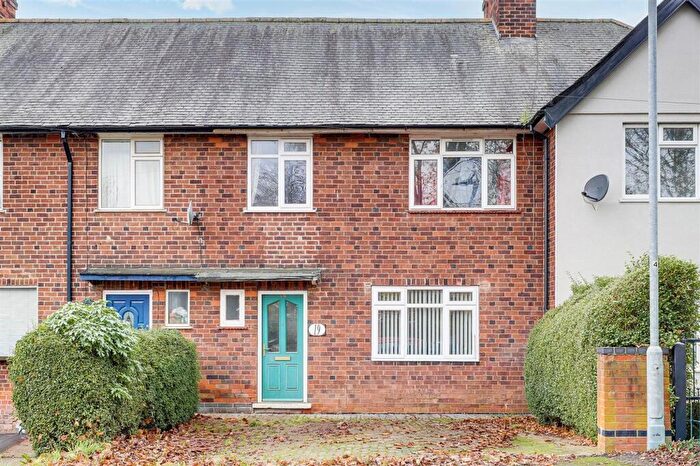
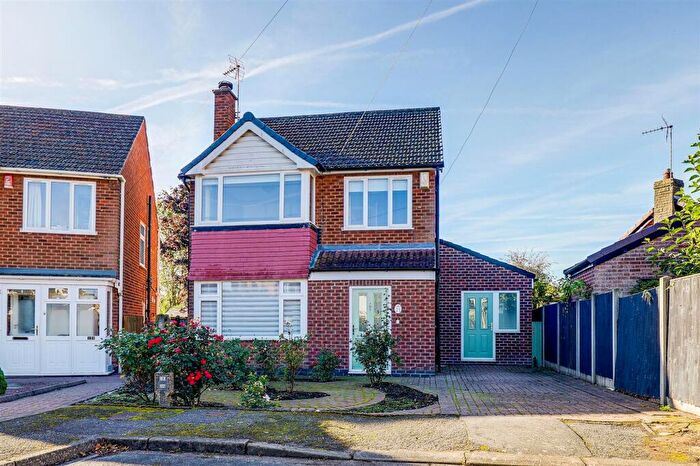
Houses for sale & to rent in Redhill, Nottingham
House Prices in Redhill
Properties in Redhill have an average house price of £295,000.00 and had 15 Property Transactions within the last 3 years¹.
Redhill is an area in Nottingham, Nottinghamshire with 43 households², where the most expensive property was sold for £415,000.00.
Properties for sale in Redhill
Roads and Postcodes in Redhill
Navigate through our locations to find the location of your next house in Redhill, Nottingham for sale or to rent.
| Streets | Postcodes |
|---|---|
| Adams Drive | NG5 8PY |
| Ashington Drive | NG5 8UB |
| Bestwood Park View | NG5 8GY |
| Burrows Way | NG5 8RW |
| Cross Street | NG5 7PJ |
| Felton Way | NG5 8UG |
| Hadston Drive | NG5 8UH |
| Lime Lane | NG5 8PZ |
| Mansfield Road | NG5 8JT NG5 8JY |
| Nicholson Close | NG5 8RQ |
| Rothbury Close | NG5 8UE |
| Woodhorn Close | NG5 8UD |
| Woodston Walk | NG5 8LN |
| York Mews | NG5 7DU |
Transport near Redhill
-
Bulwell Station
-
Hucknall Station
-
Carlton Station
-
Netherfield Station
-
Burton Joyce Station
-
Nottingham Station
- FAQ
- Price Paid By Year
- Property Type Price
Frequently asked questions about Redhill
What is the average price for a property for sale in Redhill?
The average price for a property for sale in Redhill is £295,000. This amount is 5% higher than the average price in Nottingham. There are 314 property listings for sale in Redhill.
What streets have the most expensive properties for sale in Redhill?
The streets with the most expensive properties for sale in Redhill are Ashington Drive at an average of £326,400 and Woodhorn Close at an average of £232,200.
What streets have the most affordable properties for sale in Redhill?
The street with the most affordable properties for sale in Redhill is Bestwood Park View at an average of £223,500.
Which train stations are available in or near Redhill?
Some of the train stations available in or near Redhill are Bulwell, Hucknall and Carlton.
Property Price Paid in Redhill by Year
The average sold property price by year was:
| Year | Average Sold Price | Price Change |
Sold Properties
|
|---|---|---|---|
| 2025 | £251,333 | 3% |
3 Properties |
| 2024 | £245,000 | -33% |
3 Properties |
| 2023 | £326,222 | 8% |
9 Properties |
| 2022 | £298,750 | -2% |
4 Properties |
| 2021 | £305,500 | 17% |
4 Properties |
| 2020 | £252,666 | 5% |
6 Properties |
| 2019 | £241,250 | 7% |
6 Properties |
| 2018 | £223,750 | -30% |
2 Properties |
| 2017 | £290,125 | 35% |
4 Properties |
| 2016 | £189,498 | -23% |
4 Properties |
| 2015 | £233,496 | -2% |
44 Properties |
| 2014 | £238,025 | - |
9 Properties |
Property Price per Property Type in Redhill
Here you can find historic sold price data in order to help with your property search.
The average Property Paid Price for specific property types in the last three years are:
| Property Type | Average Sold Price | Sold Properties |
|---|---|---|
| Semi Detached House | £234,833.00 | 6 Semi Detached Houses |
| Terraced House | £181,500.00 | 2 Terraced Houses |
| Detached House | £379,000.00 | 7 Detached Houses |

