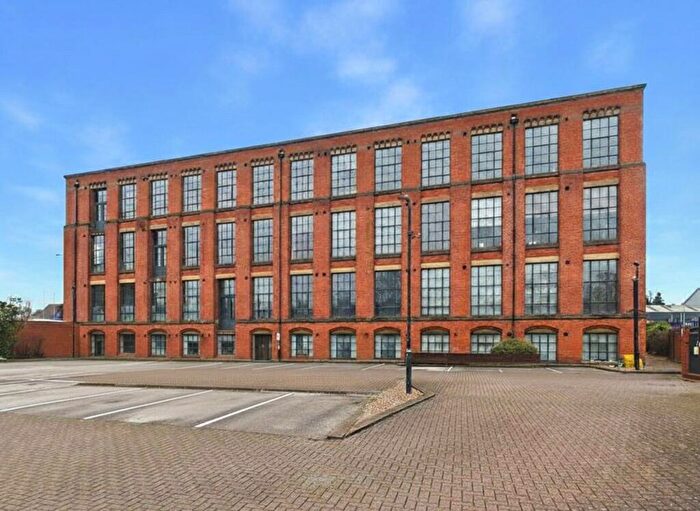
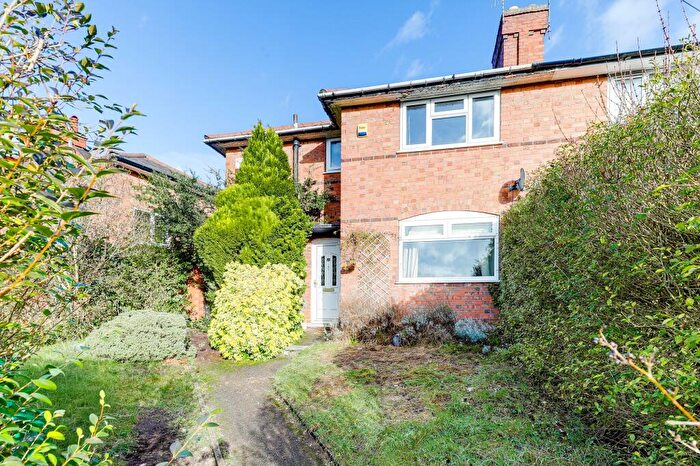
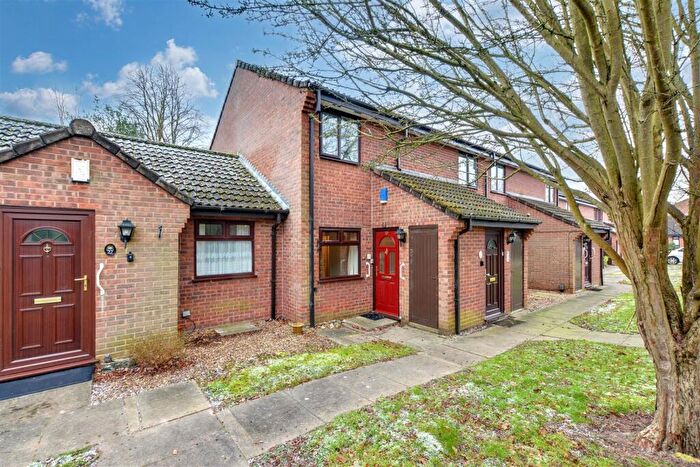
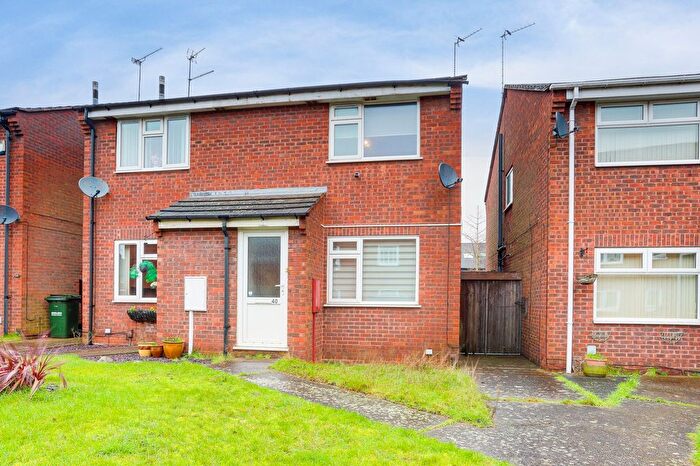
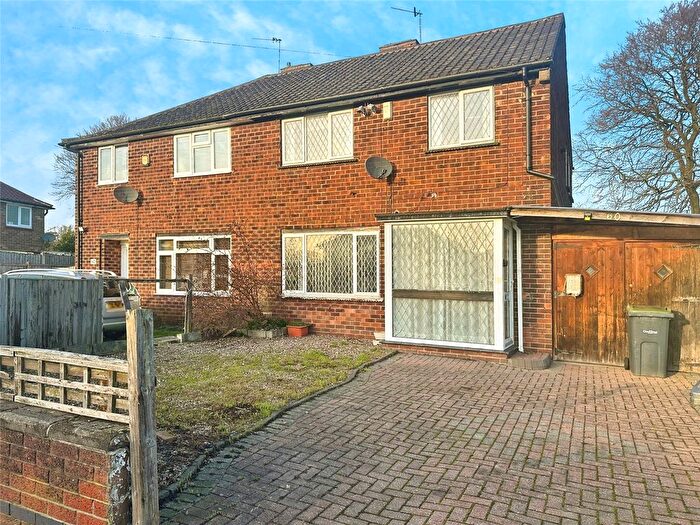
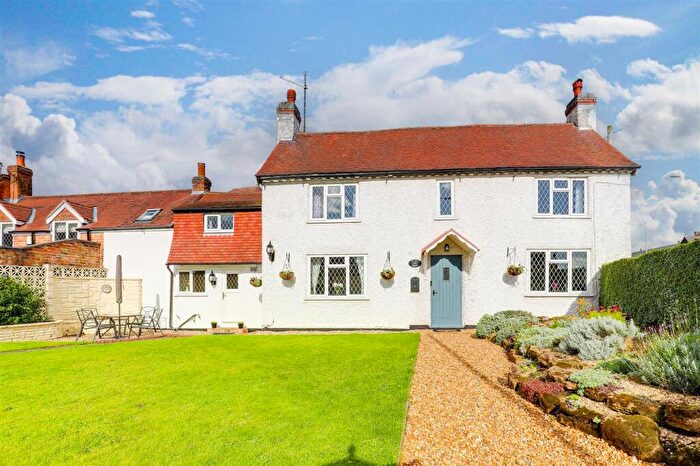
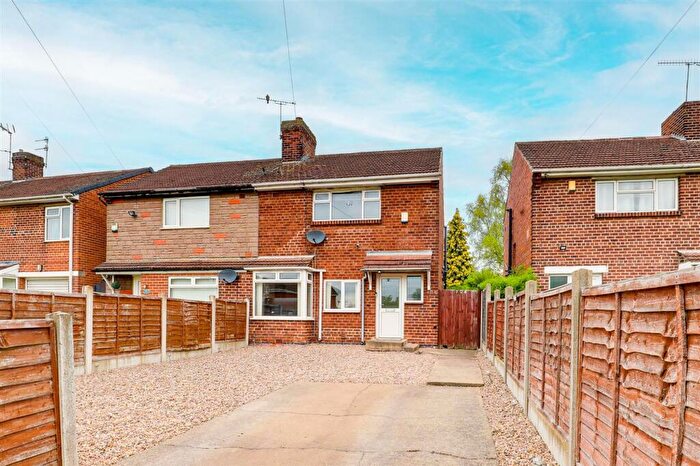
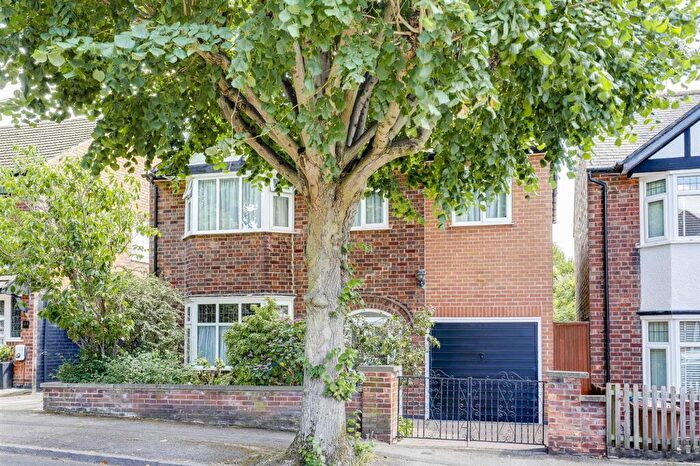
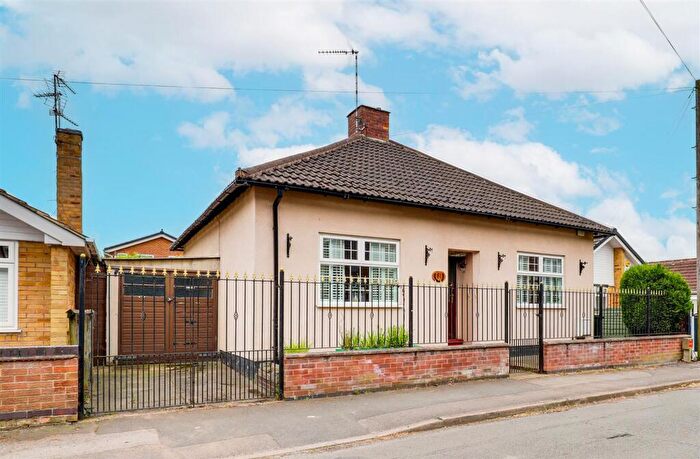
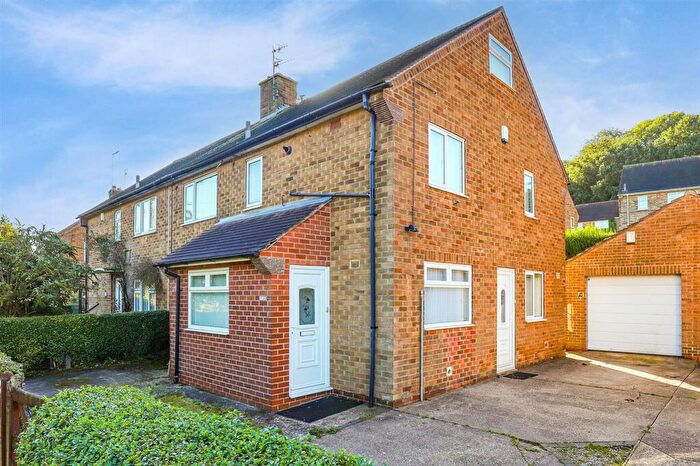
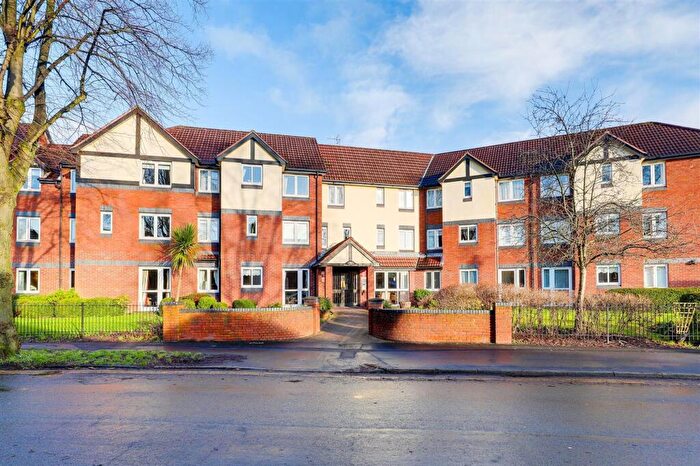
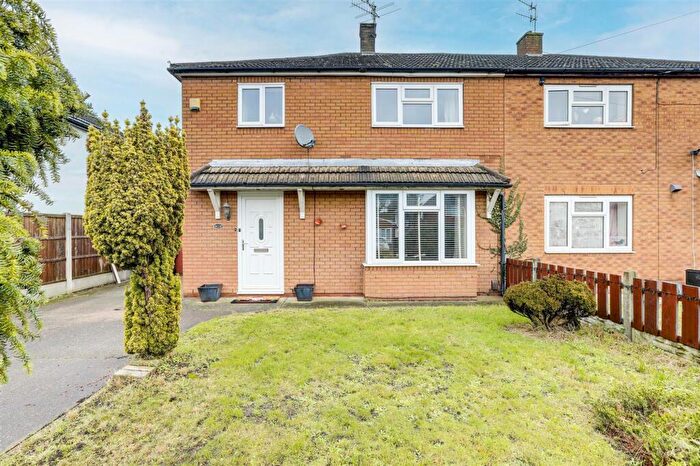
Houses for sale & to rent in Daybrook, Nottingham
House Prices in Daybrook
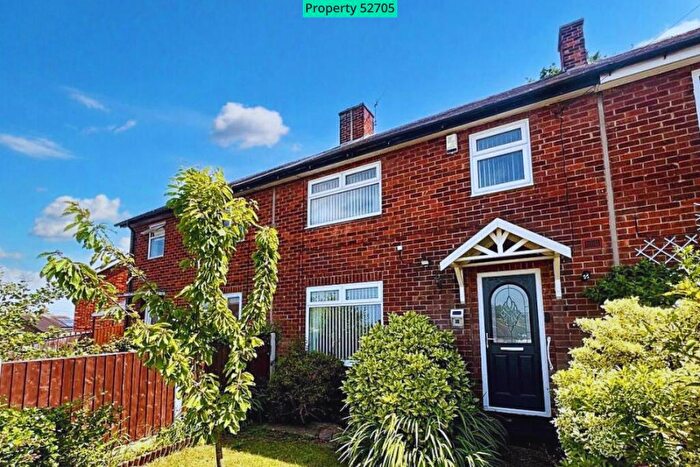
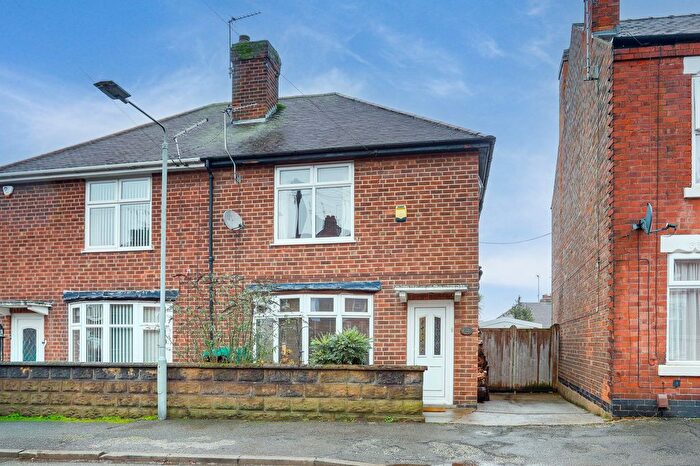
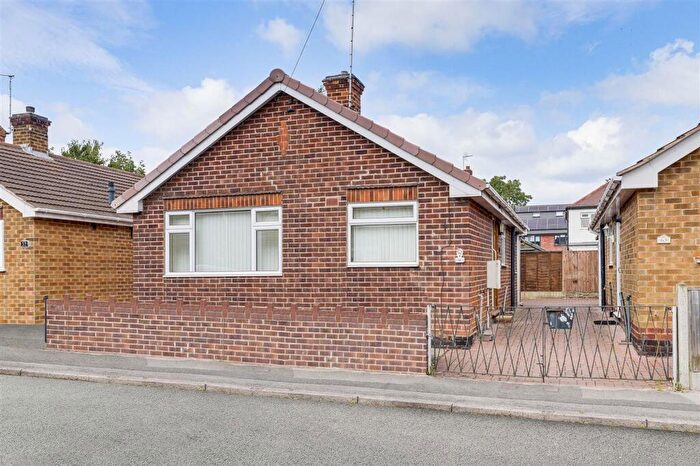
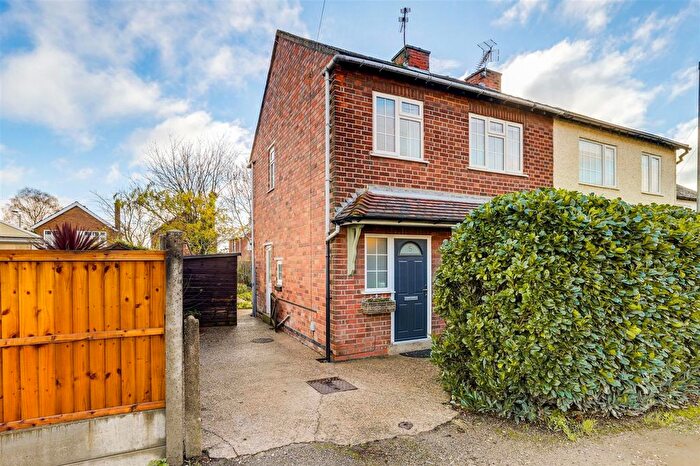
Properties in Daybrook have an average house price of £192,087.00 and had 218 Property Transactions within the last 3 years¹.
Daybrook is an area in Nottingham, Nottinghamshire with 2,237 households², where the most expensive property was sold for £700,000.00.
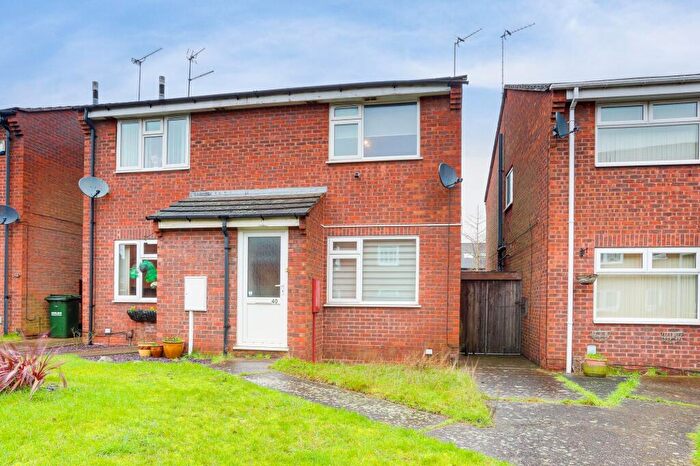
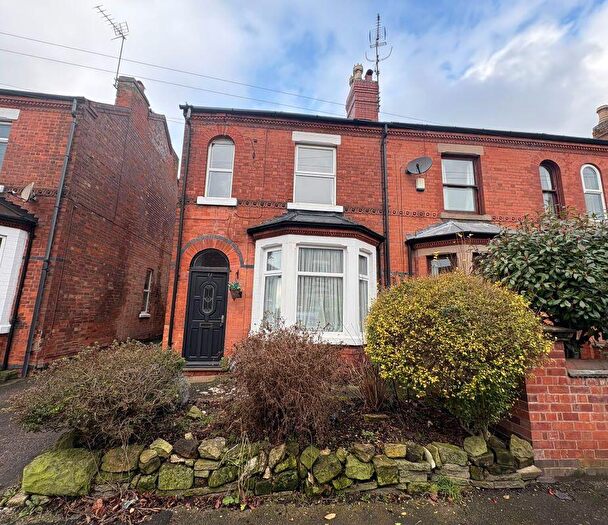
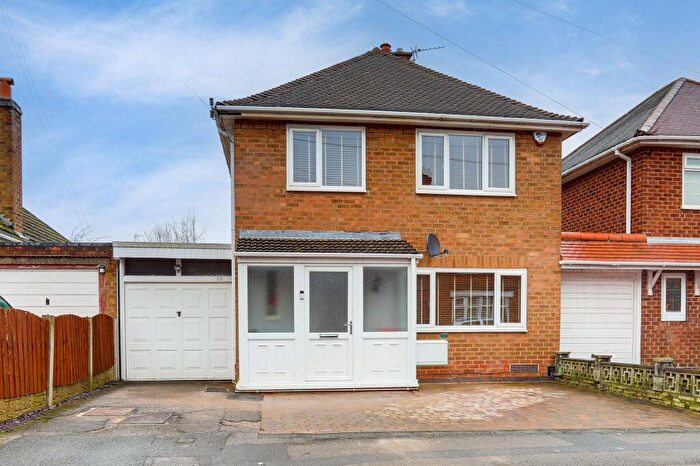
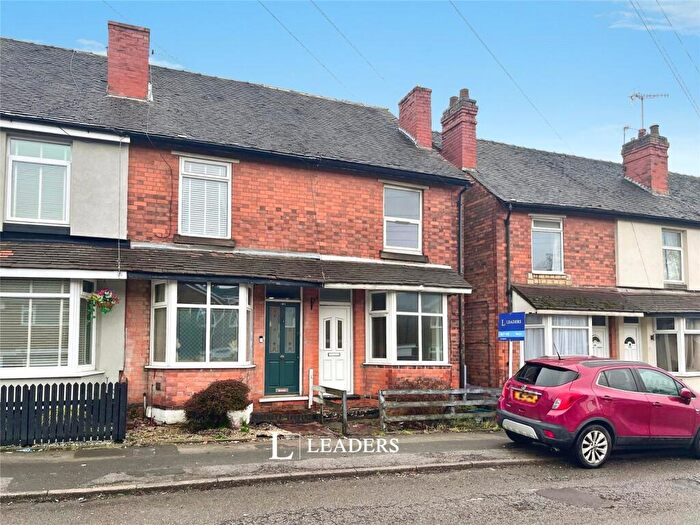
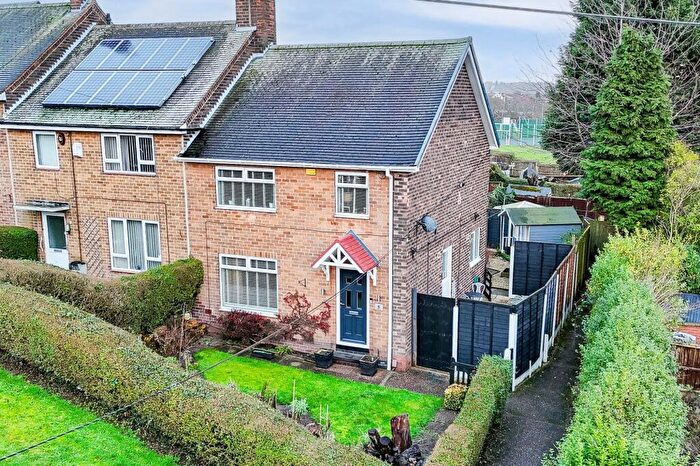
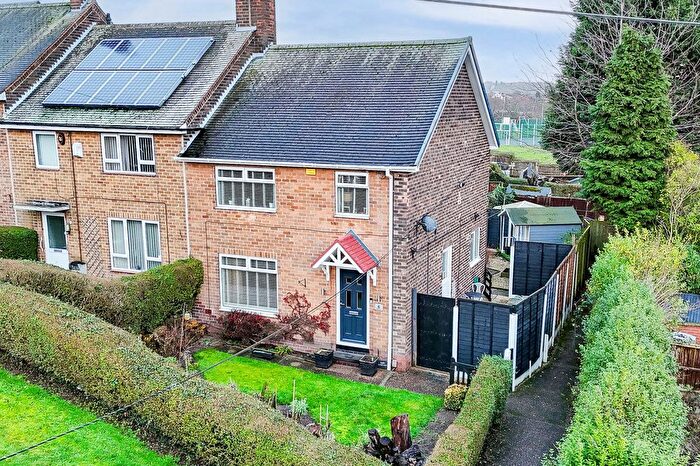
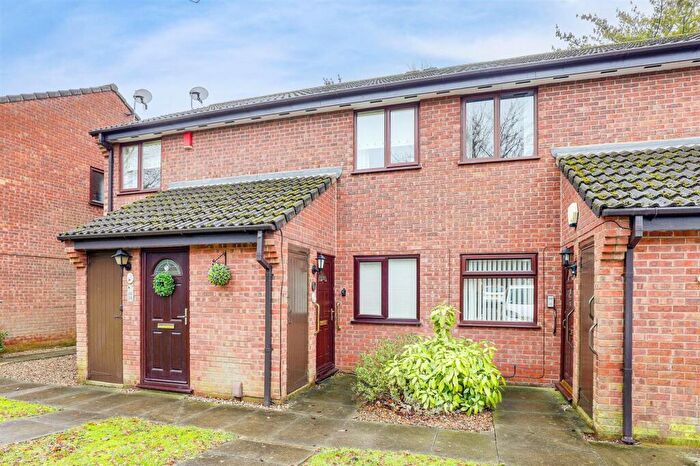
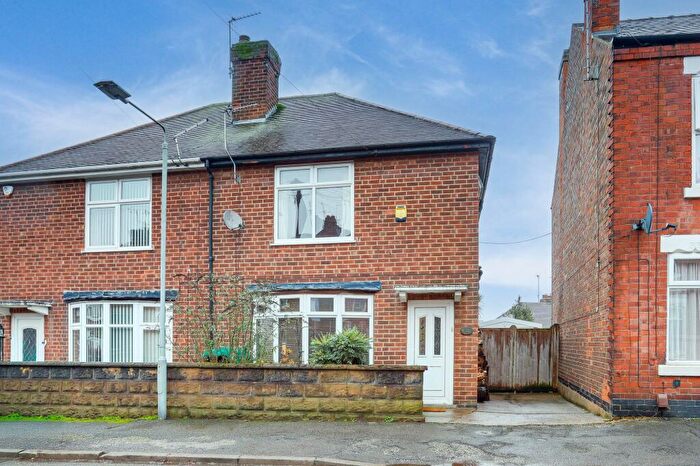
Properties for sale in Daybrook
Roads and Postcodes in Daybrook
Navigate through our locations to find the location of your next house in Daybrook, Nottingham for sale or to rent.
| Streets | Postcodes |
|---|---|
| Abbots Close | NG5 6AU |
| Acton Road | NG5 7AB NG5 7AD |
| Albany Close | NG5 6JP |
| Arnot Hill Park | NG5 0ZZ |
| Bagnall Avenue | NG5 6FP NG5 6FT |
| Bailey Close | NG5 6HG |
| Bestwood Avenue | NG5 7AL |
| Bond Street | NG5 7DT |
| Browning Close | NG5 6HF |
| Byron Street | NG5 6BR NG5 6BQ NG5 6BS NG5 6BT |
| Chapel Lane | NG5 7DR |
| Church Avenue | NG5 6LB |
| Church Close | NG5 6HZ |
| Church Crescent | NG5 6JB |
| Church Drive | NG5 6JD NG5 6JF NG5 6LD |
| Church Drive East | NG5 6JG |
| Clinton Street | NG5 6GR |
| Coleridge Crescent | NG5 6HL |
| Cornwall Road | NG5 6FR NG5 6FS |
| Danes Close | NG5 8NU |
| Deerleap Drive | NG5 6FQ |
| Duke Street | NG5 6GP NG5 6GQ |
| Edwin Street | NG5 6AX NG5 6AY NG5 6AZ |
| Falconers Walk | NG5 8NY |
| Furlong Street | NG5 7AA |
| Glade Hill Road | NG5 6FL |
| Hanworth Gardens | NG5 8NT |
| Heddington Gardens | NG5 8NW |
| High Street | NG5 7DA NG5 7DN |
| High Street Avenue | NG5 7DW |
| Home Close | NG5 8LP |
| Jacoby Close | NG5 6GH |
| Keats Close | NG5 6HB |
| Kennedy Close | NG5 6HY |
| Knowles Walk | NG5 8NG |
| Louisa Close | NG5 8NR |
| Madford Business Park | NG5 6AD |
| Maidens Dale | NG5 8LQ |
| Mansfield Road | NG5 6BD NG5 6BH NG5 6BW NG5 6HA NG5 6BB NG5 6BE NG5 6AJ NG5 6GY NG5 6GZ NG5 6HT NG5 6HW |
| Morley Street | NG5 6JL NG5 6JX |
| Moyra Drive | NG5 6FH |
| Nelson Road | NG5 6JE |
| Nottingham Road | NG5 6JW NG5 6LA NG5 6JN |
| Orchard Grove | NG5 6FU |
| Oxborough Road | NG5 6FE NG5 6FG |
| Oxclose Lane | NG5 6FF NG5 6FB NG5 6FD NG5 6FN NG5 6FW NG5 6FZ |
| Oxengate | NG5 6FY |
| Parkyn Road | NG5 6BG |
| Pearson Court | NG5 6JU |
| Portland Street | NG5 6BL |
| Prior Road | NG5 6AW |
| Queens Bower Road | NG5 5SD |
| Roundwood Road | NG5 6FJ NG5 6GB |
| Ruskin Close | NG5 6HE |
| Salop Street | NG5 6HD NG5 6HP |
| Seagrave Court | NG5 6JA |
| Shelley Road | NG5 6HN |
| Sherbrook Avenue | NG5 6AN |
| Sherbrook Road | NG5 6AT NG5 6AL NG5 6AP NG5 6AQ NG5 6AR NG5 6AS NG5 6AB |
| Sherbrook Terrace | NG5 6BY |
| Sir John Robinson Way | NG5 6BN NG5 6DA NG5 6DB NG5 6DD |
| Sloethorne Gardens | NG5 8NX |
| St Albans Road | NG5 6AE NG5 6GS NG5 6GT NG5 6GW NG5 6JH NG5 6JJ |
| St Nicholas Close | NG5 6GU |
| Swinburne Way | NG5 6BX |
| Turton Drive | NG5 6LH |
| Warren Hill Close | NG5 6GD |
| West Street | NG5 7DB NG5 7DD |
| Wordsworth Road | NG5 6HH NG5 6HJ |
| NG5 0AA NG5 0BN NG5 0BZ NG5 0DY NG5 0EX NG5 0FQ NG5 0FZ NG5 0GF NG5 0GH NG5 0GL NG5 0GN NG5 0HE NG5 0HP NG5 0HQ NG5 0HR NG5 0HT NG5 0HW NG5 0HX NG5 0JA NG5 0JG NG5 0JH NG5 0JR NG5 0JS NG5 0JW NG5 0JY NG5 0JZ NG5 0LB NG5 0LF NG5 0LG NG5 0LH NG5 0LJ NG5 0LL NG5 4EU NG5 5ZU NG5 8TF NG5 8WH NG5 8XN NG5 9SG NG5 0LR NG5 0LX NG5 0NE NG5 0NH NG5 0NR NG5 0NS NG5 0NW NG5 8TS NG5 6GL NG5 6ZA |
Transport near Daybrook
-
Bulwell Station
-
Carlton Station
-
Hucknall Station
-
Netherfield Station
-
Nottingham Station
-
Burton Joyce Station
- FAQ
- Price Paid By Year
- Property Type Price
Frequently asked questions about Daybrook
What is the average price for a property for sale in Daybrook?
The average price for a property for sale in Daybrook is £192,087. This amount is 32% lower than the average price in Nottingham. There are 707 property listings for sale in Daybrook.
What streets have the most expensive properties for sale in Daybrook?
The streets with the most expensive properties for sale in Daybrook are Nelson Road at an average of £273,333, Kennedy Close at an average of £265,000 and Coleridge Crescent at an average of £245,000.
What streets have the most affordable properties for sale in Daybrook?
The streets with the most affordable properties for sale in Daybrook are Oxborough Road at an average of £111,750, Sherbrook Terrace at an average of £130,000 and Nottingham Road at an average of £147,333.
Which train stations are available in or near Daybrook?
Some of the train stations available in or near Daybrook are Bulwell, Carlton and Hucknall.
Property Price Paid in Daybrook by Year
The average sold property price by year was:
| Year | Average Sold Price | Price Change |
Sold Properties
|
|---|---|---|---|
| 2025 | £198,586 | 4% |
69 Properties |
| 2024 | £191,205 | 2% |
70 Properties |
| 2023 | £187,193 | 3% |
79 Properties |
| 2022 | £181,641 | 11% |
86 Properties |
| 2021 | £161,153 | 8% |
96 Properties |
| 2020 | £147,975 | 4% |
74 Properties |
| 2019 | £141,661 | 4% |
85 Properties |
| 2018 | £136,048 | 10% |
78 Properties |
| 2017 | £122,700 | -0,3% |
82 Properties |
| 2016 | £123,010 | 9% |
98 Properties |
| 2015 | £111,501 | 2% |
88 Properties |
| 2014 | £109,068 | 2% |
74 Properties |
| 2013 | £107,386 | 8% |
64 Properties |
| 2012 | £98,674 | -11% |
57 Properties |
| 2011 | £109,177 | - |
42 Properties |
| 2010 | £109,139 | 6% |
61 Properties |
| 2009 | £102,816 | -17% |
51 Properties |
| 2008 | £120,637 | 2% |
72 Properties |
| 2007 | £118,595 | 5% |
141 Properties |
| 2006 | £113,195 | 1% |
118 Properties |
| 2005 | £112,187 | 1% |
100 Properties |
| 2004 | £110,778 | 19% |
134 Properties |
| 2003 | £89,539 | 14% |
113 Properties |
| 2002 | £76,878 | 10% |
125 Properties |
| 2001 | £69,182 | 30% |
174 Properties |
| 2000 | £48,445 | 11% |
104 Properties |
| 1999 | £43,030 | 4% |
98 Properties |
| 1998 | £41,237 | -0,2% |
90 Properties |
| 1997 | £41,325 | - |
71 Properties |
| 1996 | £41,311 | 11% |
67 Properties |
| 1995 | £36,687 | - |
74 Properties |
Property Price per Property Type in Daybrook
Here you can find historic sold price data in order to help with your property search.
The average Property Paid Price for specific property types in the last three years are:
| Property Type | Average Sold Price | Sold Properties |
|---|---|---|
| Semi Detached House | £206,251.00 | 109 Semi Detached Houses |
| Detached House | £299,600.00 | 15 Detached Houses |
| Terraced House | £172,675.00 | 64 Terraced Houses |
| Flat | £128,283.00 | 30 Flats |

