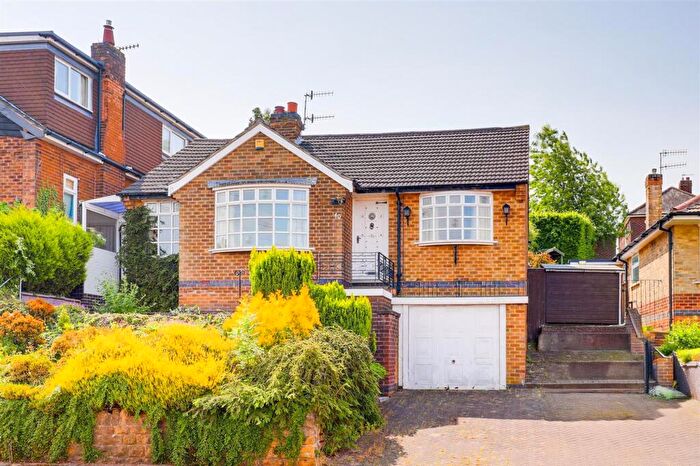
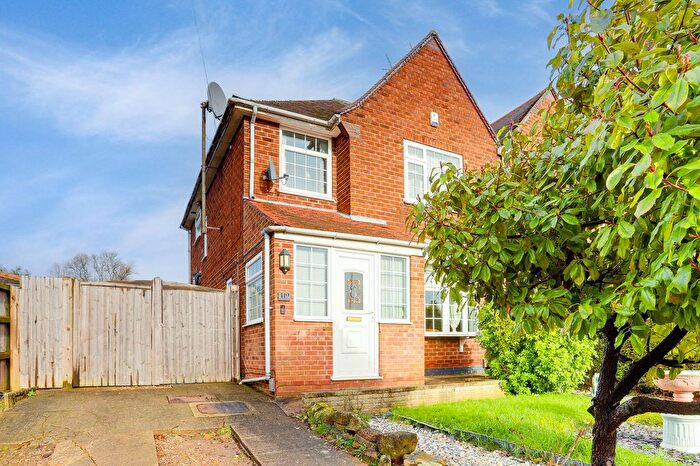
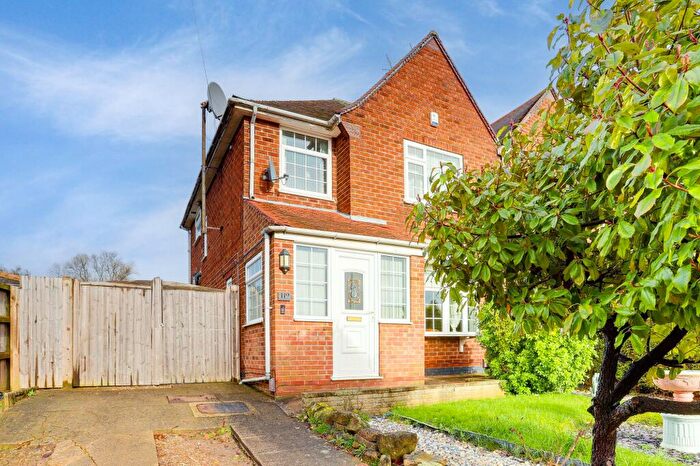
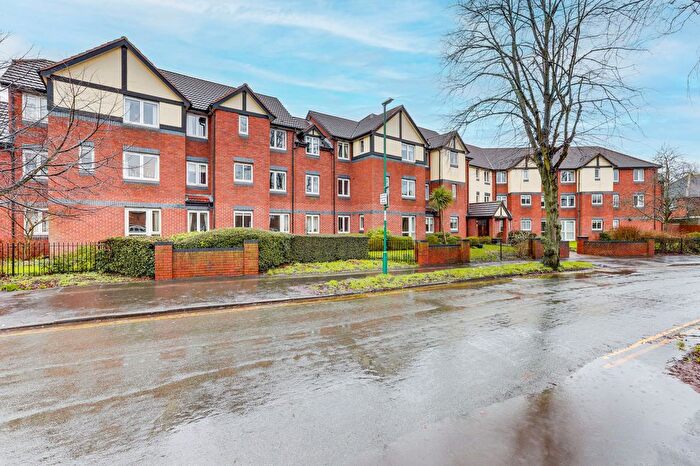
Houses for sale & to rent in Kingswell, Nottingham
House Prices in Kingswell
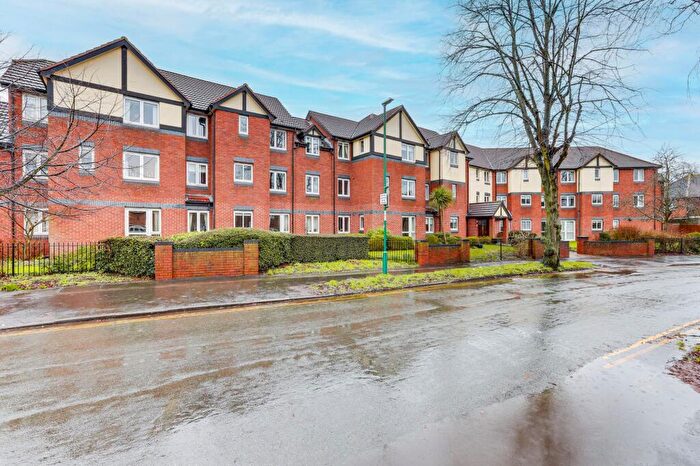
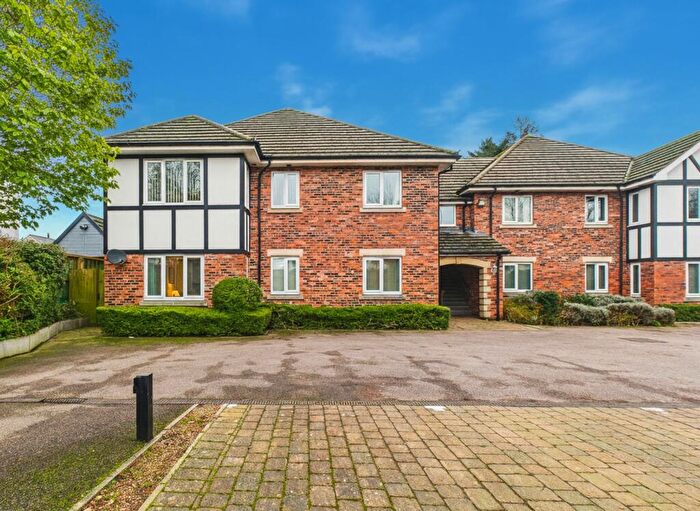
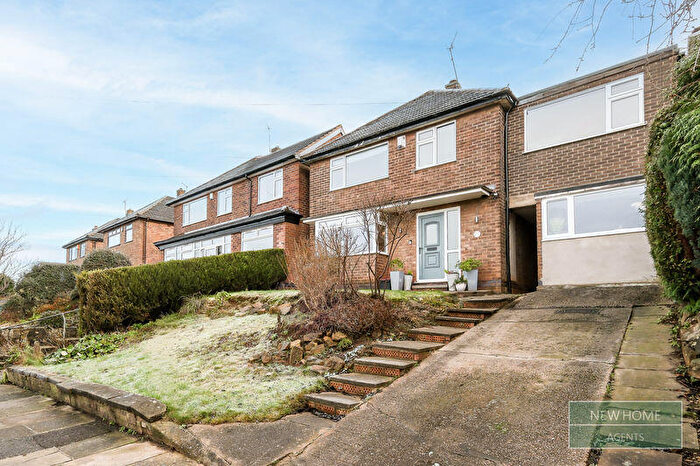
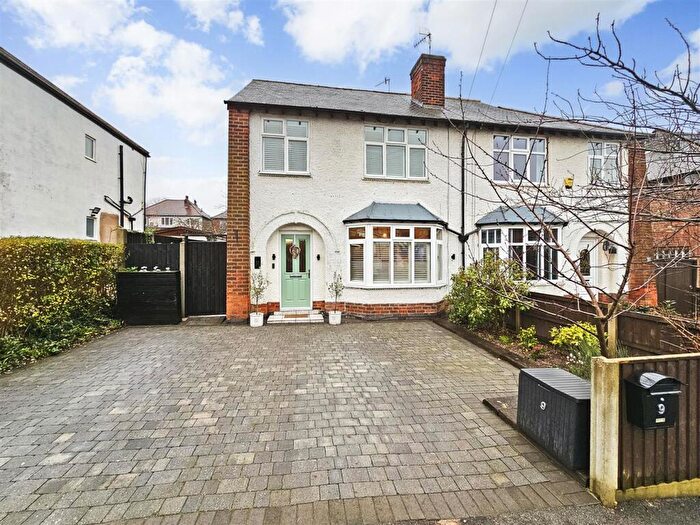
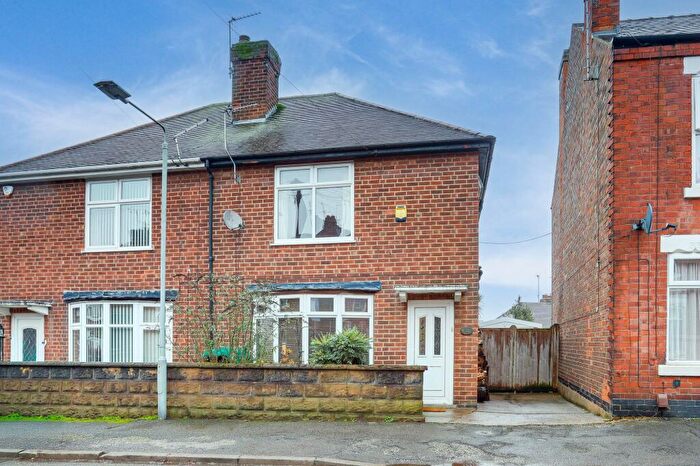
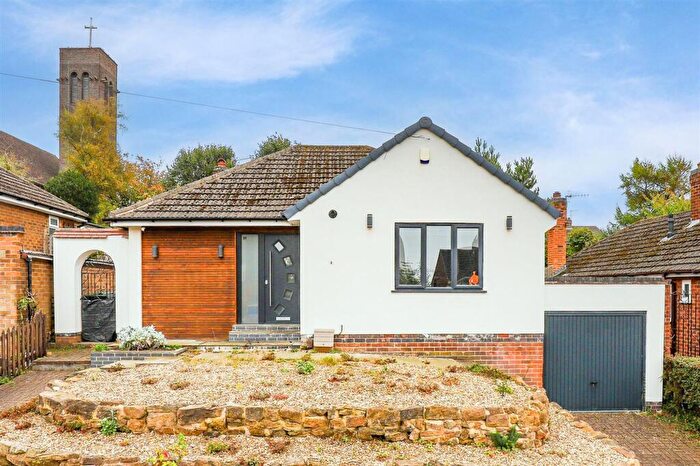
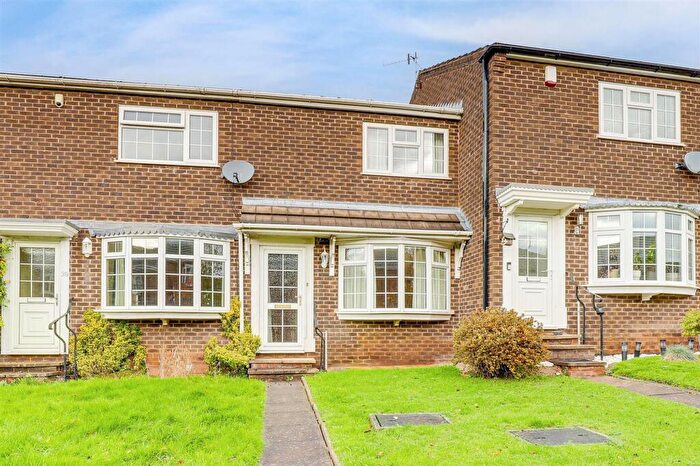
Properties in Kingswell have an average house price of £252,610.00 and had 213 Property Transactions within the last 3 years¹.
Kingswell is an area in Nottingham, Nottinghamshire with 2,180 households², where the most expensive property was sold for £575,000.00.
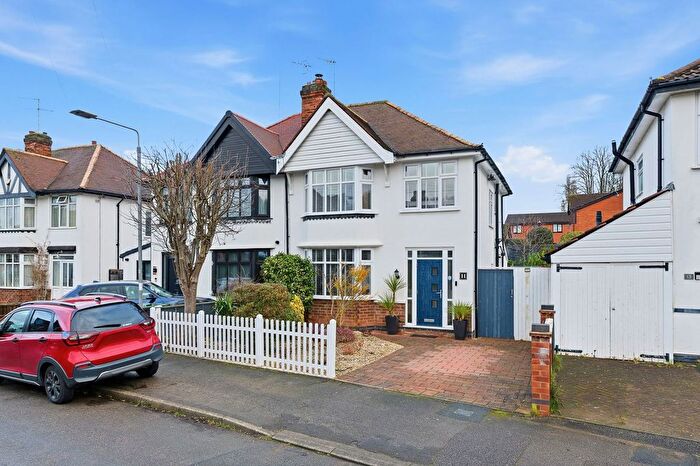
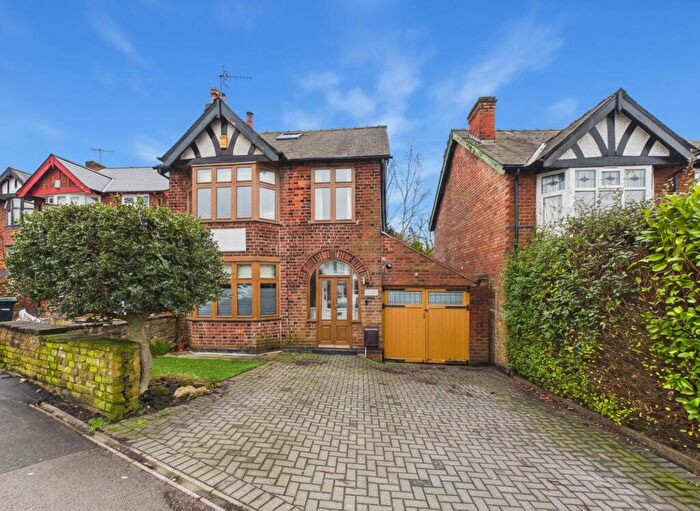
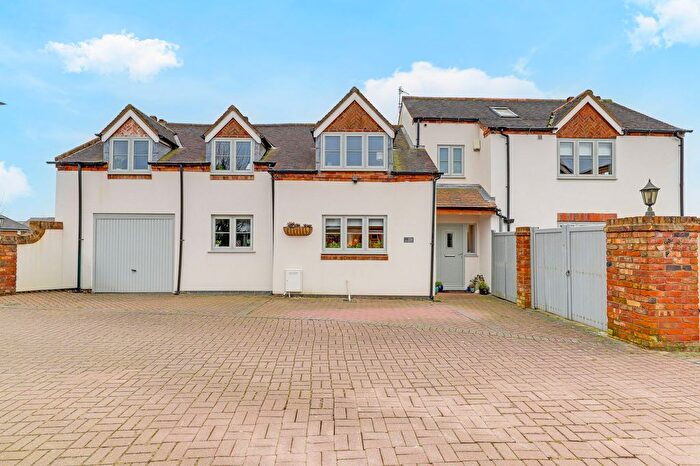
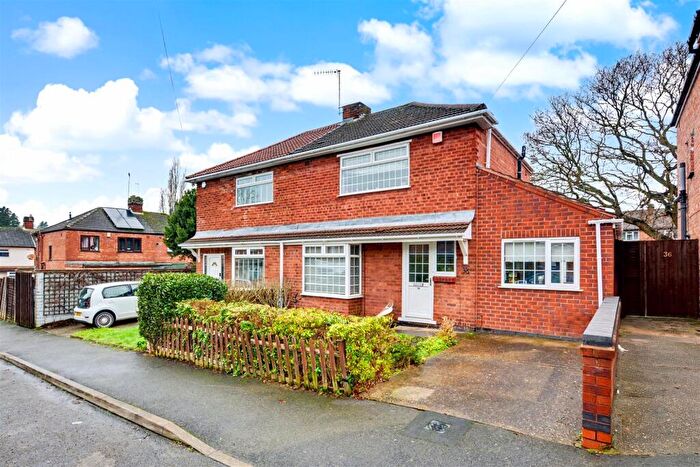
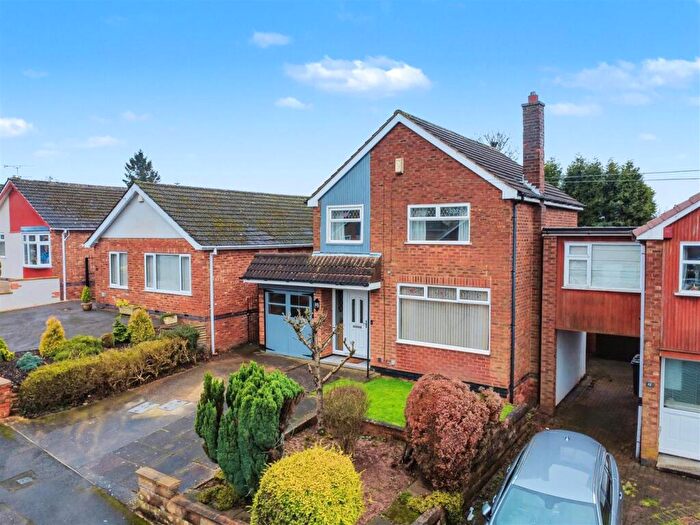
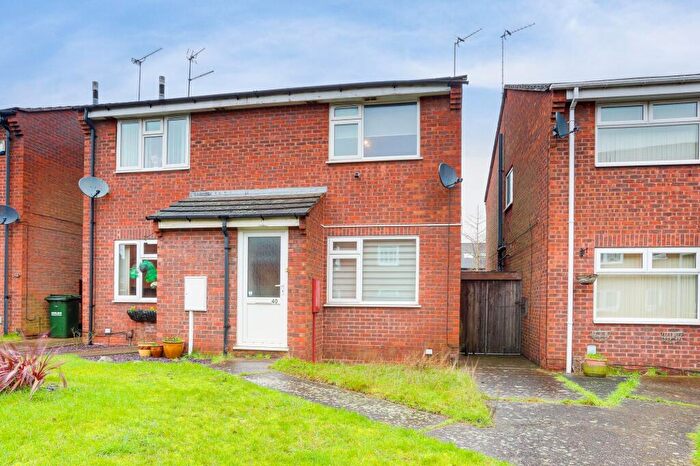
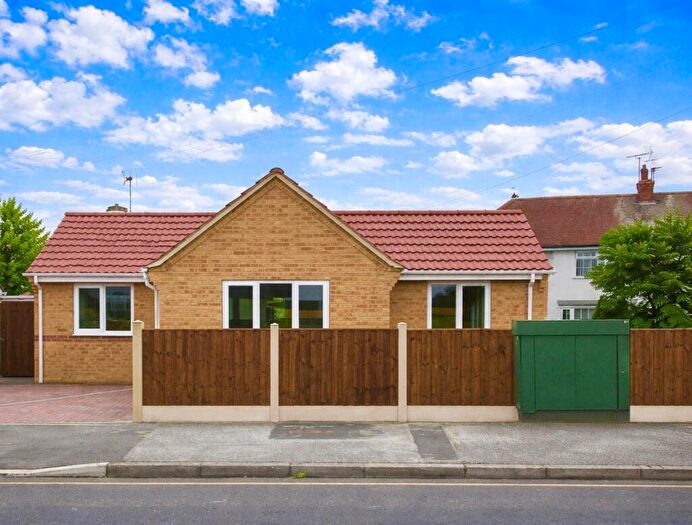
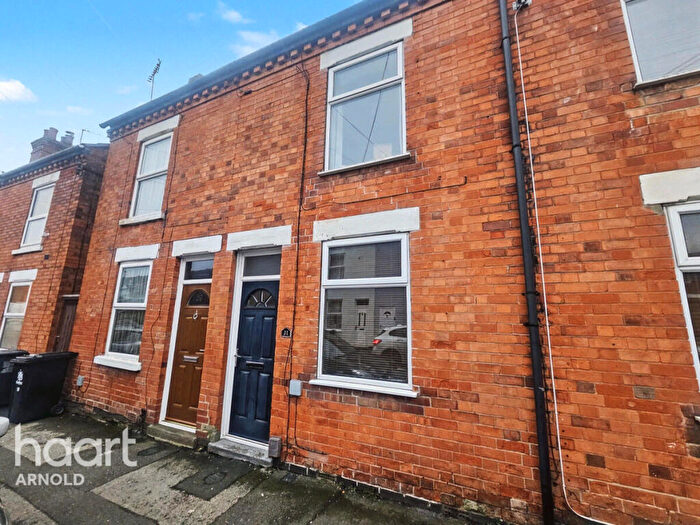
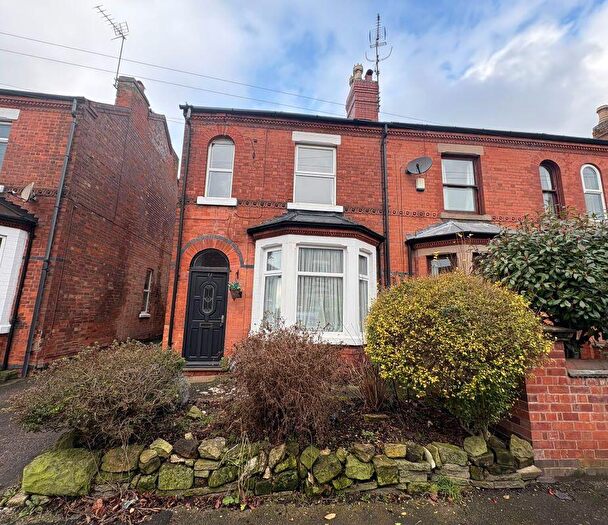
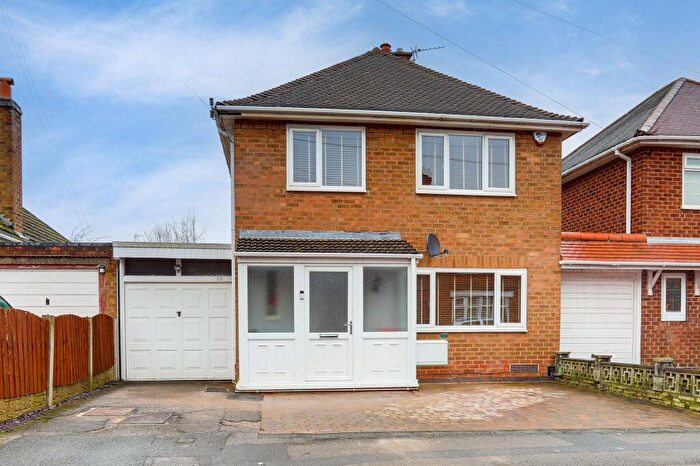
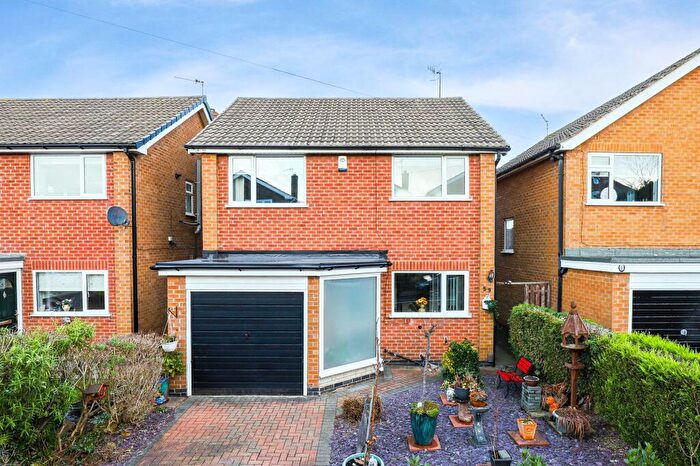
Properties for sale in Kingswell
Roads and Postcodes in Kingswell
Navigate through our locations to find the location of your next house in Kingswell, Nottingham for sale or to rent.
| Streets | Postcodes |
|---|---|
| Arno Vale Gardens | NG5 4JL |
| Arno Vale Road | NG5 4JG NG5 4JH NG5 4JJ |
| Arnot Hill Road | NG5 6LJ NG5 6LL NG5 6LN NG5 6LQ NG5 6LS |
| Aylesham Avenue | NG5 6PP NG5 6PX |
| Blake Close | NG5 6NB |
| Blakeney Walk | NG5 6SF |
| Brookfield Gardens | NG5 7EW |
| Brookfield Road | NG5 7ER NG5 7FG |
| Carmel Gardens | NG5 6LW NG5 6LZ |
| Castleton Avenue | NG5 6NH NG5 6NJ |
| Central Avenue | NG5 6NF |
| Central Avenue South | NG5 6NG |
| Charles Street | NG5 6LE |
| Charnwood Lane | NG5 6PE NG5 6PF NG5 6PG |
| Chelsbury Court | NG5 6NA |
| Churchill Close | NG5 6QG |
| Conway Gardens | NG5 6LR |
| Dereham Drive | NG5 6PS |
| Derwent Crescent | NG5 6TA NG5 6TD NG5 6TE NG5 6TF NG5 6TG NG5 6TH NG5 6TJ |
| Downham Close | NG5 6PR |
| Eden Close | NG5 6SE |
| Fisher Avenue | NG5 4JE |
| Gedling Grove | NG5 7ES |
| Gedling Road | NG5 6NR NG5 6NT NG5 6NW NG5 6NY |
| George Street | NG5 6LP |
| Glendale Gardens | NG5 6NS |
| Greendale Road | NG5 6QD |
| Hallams Lane | NG5 6NE |
| Hemsby Court | NG5 6QE |
| Hereford Road | NG5 4HZ |
| Holkham Close | NG5 6PU |
| Honingham Close | NG5 6SG |
| Jubilee Road | NG5 6JR |
| Kingswell Avenue | NG5 6SY |
| Kingswell Road | NG5 6NP |
| Langley Avenue | NG5 6NL NG5 6NN |
| Marsham Drive | NG5 6TB |
| Nottingham Road | NG5 6JQ NG5 6JZ |
| Nursery Road | NG5 7ET |
| Oulton Close | NG5 6SW |
| Overstrand Close | NG5 6PT |
| Park Avenue | NG5 4HS |
| Park Road | NG5 4HR |
| Rolleston Drive | NG5 7JA |
| Rushmere Walk | NG5 6SH |
| Sandfield Road | NG5 6QA NG5 6QB NG5 6QF NG5 6QJ |
| Saville Road | NG5 4JF |
| Sheringham Close | NG5 6PY |
| Stanmore Gardens | NG5 6LX |
| Syderstone Walk | NG5 6SJ |
| Thackerays Lane | NG5 4HP NG5 4HQ NG5 4HT NG5 4HU NG5 4JA NG5 4JD |
| Thetford Close | NG5 6PH NG5 6PJ |
| Wadham Road | NG5 4JB |
| Washington Court | NG5 6NU |
| Waveney Close | NG5 6QH |
| Winterton Close | NG5 6PZ |
| Worcester Gardens | NG5 4HX |
| Worcester Road | NG5 4HW NG5 4HY |
| Wymondham Close | NG5 6PQ |
Transport near Kingswell
-
Bulwell Station
-
Carlton Station
-
Netherfield Station
-
Nottingham Station
-
Burton Joyce Station
-
Hucknall Station
-
Radcliffe (Nottinghamshire) Station
- FAQ
- Price Paid By Year
- Property Type Price
Frequently asked questions about Kingswell
What is the average price for a property for sale in Kingswell?
The average price for a property for sale in Kingswell is £252,610. This amount is 11% lower than the average price in Nottingham. There are 968 property listings for sale in Kingswell.
What streets have the most expensive properties for sale in Kingswell?
The streets with the most expensive properties for sale in Kingswell are Park Avenue at an average of £457,500, Arno Vale Road at an average of £417,777 and Sandfield Road at an average of £398,055.
What streets have the most affordable properties for sale in Kingswell?
The streets with the most affordable properties for sale in Kingswell are Derwent Crescent at an average of £119,933, Nottingham Road at an average of £146,700 and Honingham Close at an average of £148,333.
Which train stations are available in or near Kingswell?
Some of the train stations available in or near Kingswell are Bulwell, Carlton and Netherfield.
Property Price Paid in Kingswell by Year
The average sold property price by year was:
| Year | Average Sold Price | Price Change |
Sold Properties
|
|---|---|---|---|
| 2025 | £249,232 | 0,4% |
68 Properties |
| 2024 | £248,220 | -5% |
74 Properties |
| 2023 | £260,422 | 3% |
71 Properties |
| 2022 | £252,202 | 10% |
68 Properties |
| 2021 | £226,346 | 2% |
101 Properties |
| 2020 | £221,817 | -0,4% |
80 Properties |
| 2019 | £222,766 | 12% |
97 Properties |
| 2018 | £195,335 | 6% |
86 Properties |
| 2017 | £184,433 | 1% |
90 Properties |
| 2016 | £183,340 | 15% |
119 Properties |
| 2015 | £155,883 | 1% |
83 Properties |
| 2014 | £153,818 | 5% |
84 Properties |
| 2013 | £146,499 | 4% |
77 Properties |
| 2012 | £141,335 | 6% |
57 Properties |
| 2011 | £132,224 | -17% |
73 Properties |
| 2010 | £154,975 | 14% |
60 Properties |
| 2009 | £133,656 | -3% |
72 Properties |
| 2008 | £137,989 | -12% |
83 Properties |
| 2007 | £153,915 | 4% |
141 Properties |
| 2006 | £147,273 | -5% |
141 Properties |
| 2005 | £154,451 | 17% |
85 Properties |
| 2004 | £128,256 | -2% |
107 Properties |
| 2003 | £131,336 | 20% |
92 Properties |
| 2002 | £105,327 | 21% |
113 Properties |
| 2001 | £82,947 | 16% |
128 Properties |
| 2000 | £70,049 | 15% |
103 Properties |
| 1999 | £59,868 | 3% |
95 Properties |
| 1998 | £58,174 | 2% |
111 Properties |
| 1997 | £56,771 | 14% |
87 Properties |
| 1996 | £49,044 | -3% |
124 Properties |
| 1995 | £50,545 | - |
100 Properties |
Property Price per Property Type in Kingswell
Here you can find historic sold price data in order to help with your property search.
The average Property Paid Price for specific property types in the last three years are:
| Property Type | Average Sold Price | Sold Properties |
|---|---|---|
| Semi Detached House | £254,509.00 | 51 Semi Detached Houses |
| Detached House | £340,544.00 | 82 Detached Houses |
| Terraced House | £188,222.00 | 54 Terraced Houses |
| Flat | £105,288.00 | 26 Flats |

