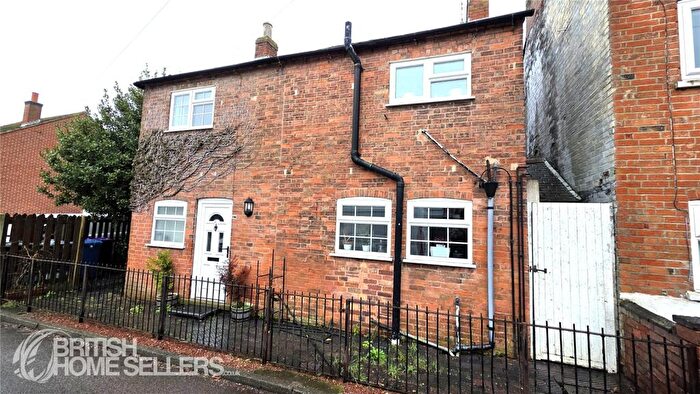
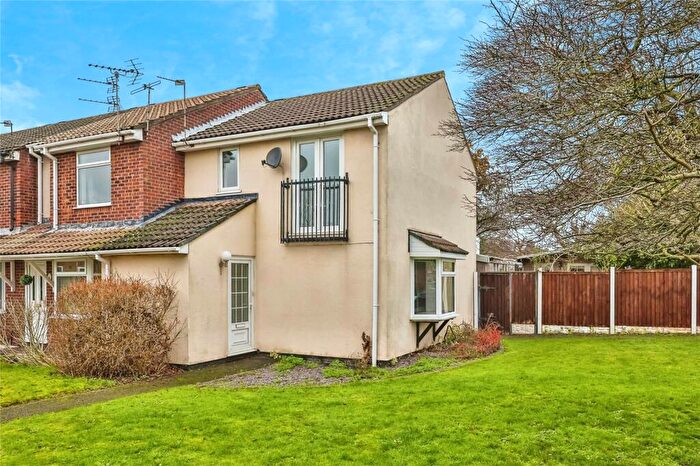
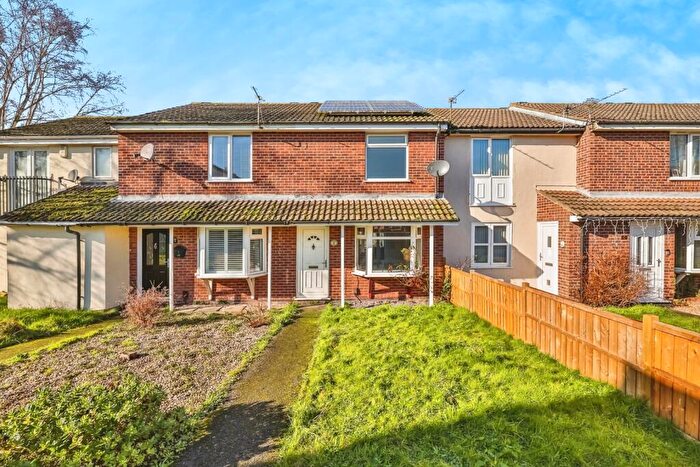
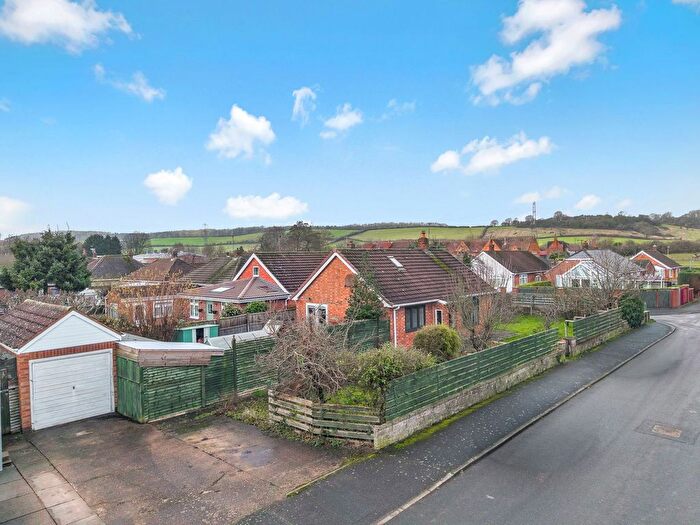
Houses for sale & to rent in Gotham, Nottingham
House Prices in Gotham
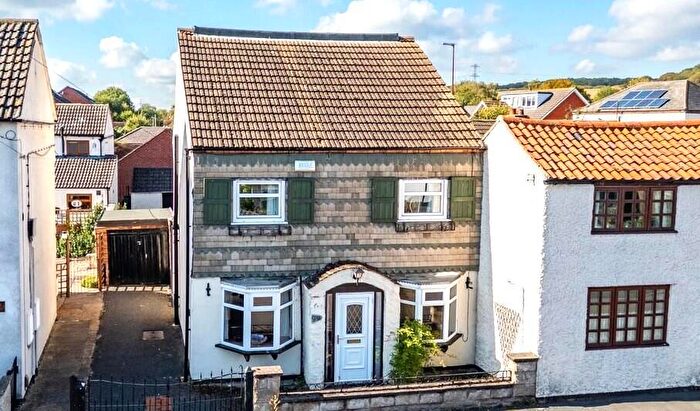
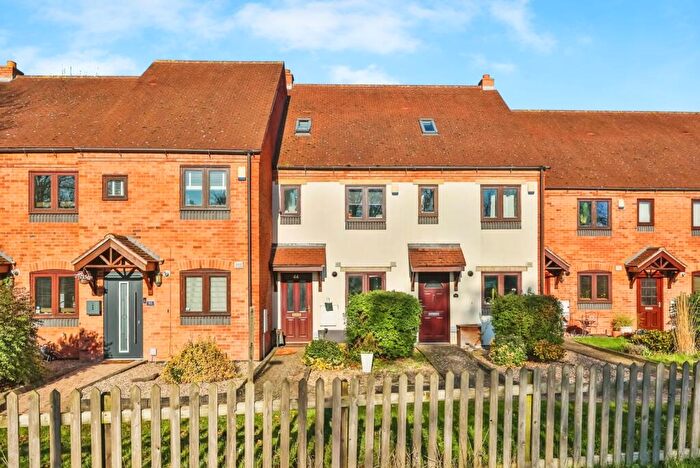
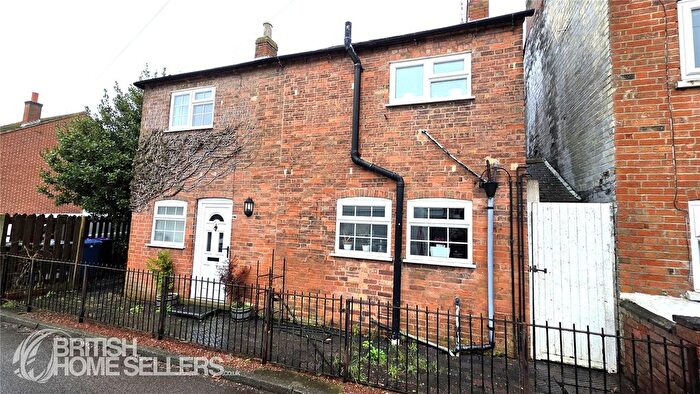
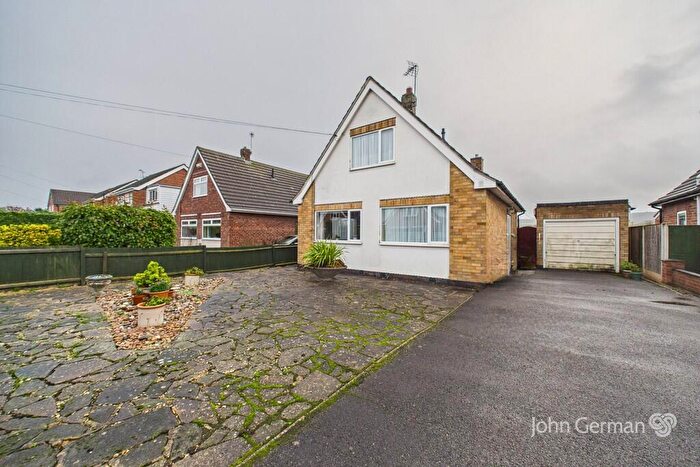
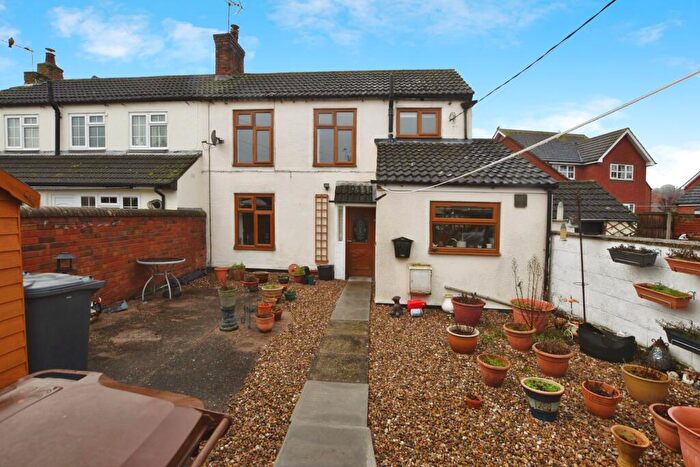
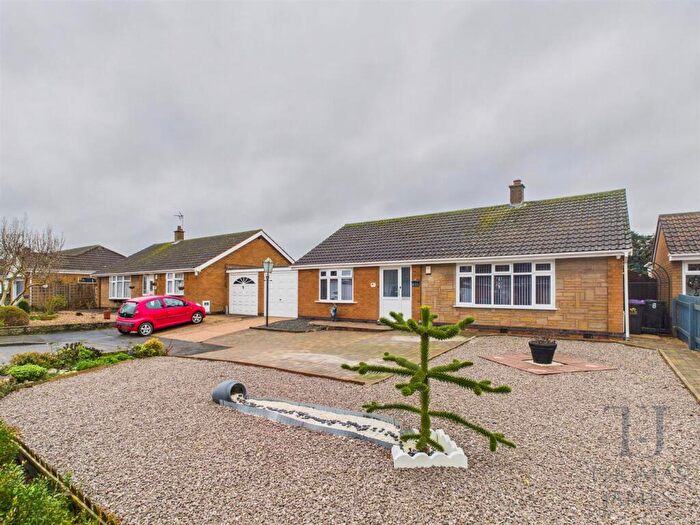
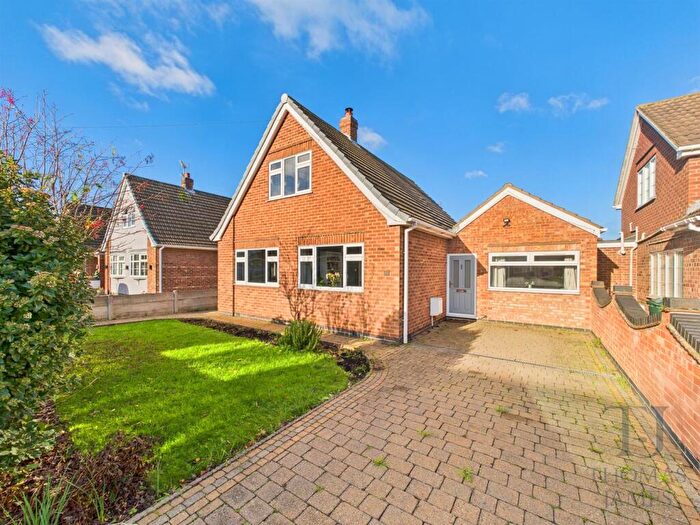
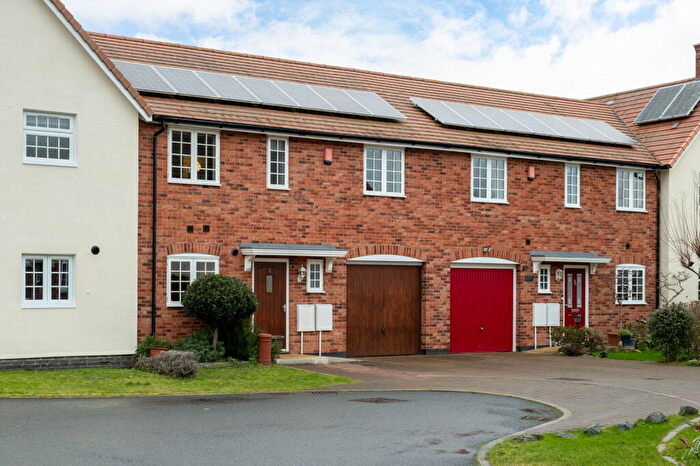
Properties in Gotham have an average house price of £338,440.00 and had 66 Property Transactions within the last 3 years¹.
Gotham is an area in Nottingham, Nottinghamshire with 901 households², where the most expensive property was sold for £750,000.00.
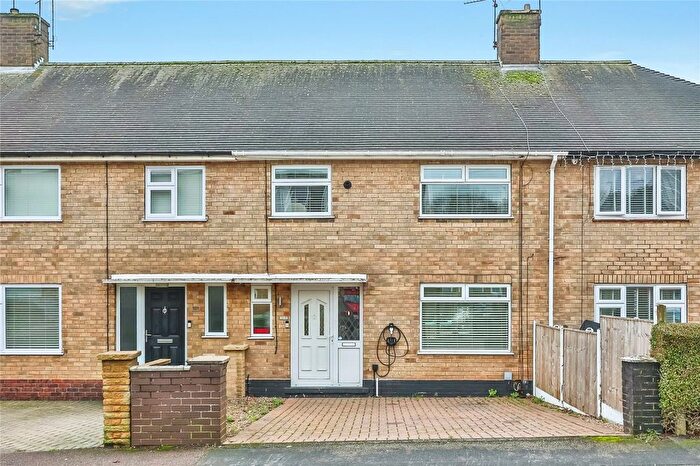
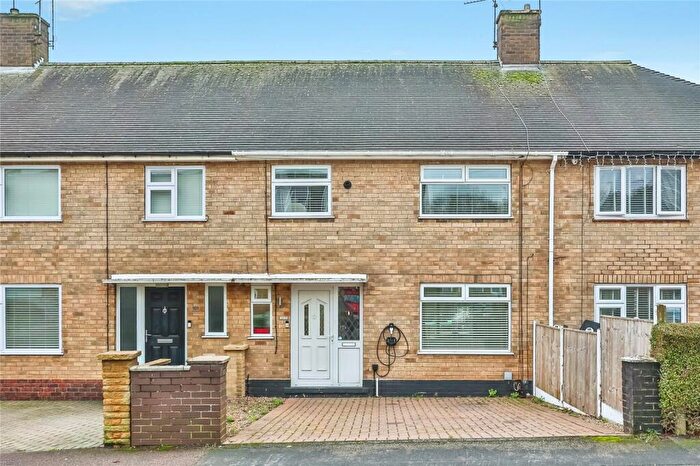
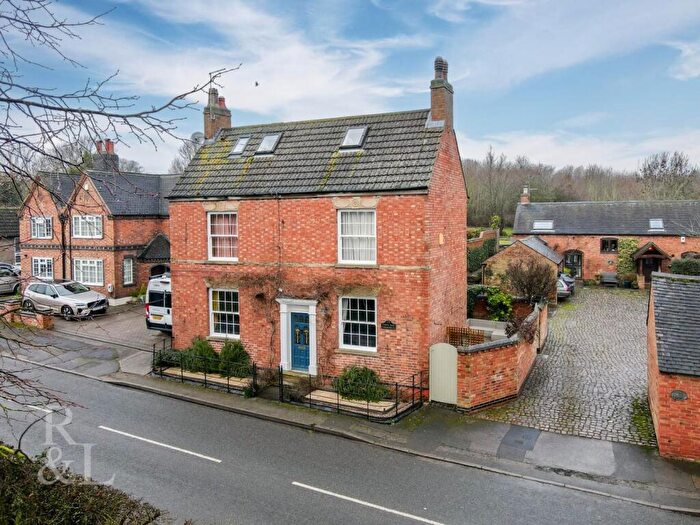
Properties for sale in Gotham
Roads and Postcodes in Gotham
Navigate through our locations to find the location of your next house in Gotham, Nottingham for sale or to rent.
| Streets | Postcodes |
|---|---|
| Barton Lane | NG11 0AB NG11 0AU |
| Bidwell Crescent | NG11 0HD |
| Brown Lane | NG11 0AD |
| Chadborn Avenue | NG11 0HT |
| Chapel Close | NG11 0GZ |
| Chestnut Lane | NG11 0AE |
| Church Lane | NG11 0AG NG11 0AW NG11 0AX NG11 0AZ |
| Church Street | NG11 0JQ |
| Clifton Pastures | NG11 8NR |
| Curzon Street | NG11 0HQ |
| East Street | NG11 0HL |
| Eyres Lane | NG11 0LQ |
| Fairham Avenue | NG11 0JB |
| Foredrift Close | NG11 0JX |
| Foresters Avenue | NG11 2AF |
| Gilbert Avenue | NG11 0HR |
| Gladstone Avenue | NG11 0HN |
| Glebelands Close | NG11 0HH |
| Gotham Business Park | NG11 0LB |
| Grasmere Gardens | NG11 0JD |
| Hall Drive | NG11 0JT |
| Hill Road | NG11 0LD |
| Holland Close | NG11 0JA |
| Home Farm Close | NG11 0JJ |
| Kegworth Road | NG11 0JS NG11 0LG NG11 0JY |
| Leake Road | NG11 0HW NG11 0JL NG11 0JN NG11 0LE NG11 0HZ |
| Little Lunnon | NG11 0AJ |
| Malt Street | NG11 0HU |
| Manor Road | NG11 0AA |
| Meadow End | NG11 0HP |
| Monks Lane | NG11 0JR |
| Moor Lane | NG11 0LH |
| Naylor Avenue | NG11 0HS |
| Nottingham Road | NG11 0HA NG11 0HE NG11 0HG NG11 0HF |
| Old Farm Court | NG11 0AN |
| Old Park Close | NG11 0EF |
| Orchard Street | NG11 0JP |
| Pygall Avenue | NG11 0JW |
| Rectory Place | NG11 0AL |
| St Andrew Close | NG11 0JE |
| St Lawrence Close | NG11 0AS |
| Station Road | NG11 0DD |
| The Buildings | NG11 0AY |
| The Limes | NG11 0AF |
| The Rushes | NG11 0HY |
| The Square | NG11 0HX |
| Thrumpton Lane | NG11 0AH |
| Tomlinson Avenue | NG11 0JU |
| Trent Side | NG11 0BL |
| Wallace Street | NG11 0HJ |
| Windmill Close | NG11 0JF |
| Winking Hill | NG11 0DP |
| Wodehouse Avenue | NG11 0HB |
| Wood Farm Court | NG11 0BA |
| Wood Lane | NG11 0LF |
| NG11 0EE NG11 0EG |
Transport near Gotham
- FAQ
- Price Paid By Year
- Property Type Price
Frequently asked questions about Gotham
What is the average price for a property for sale in Gotham?
The average price for a property for sale in Gotham is £338,440. This amount is 20% higher than the average price in Nottingham. There are 943 property listings for sale in Gotham.
What streets have the most expensive properties for sale in Gotham?
The streets with the most expensive properties for sale in Gotham are Manor Road at an average of £658,333, Church Lane at an average of £578,125 and Fairham Avenue at an average of £540,000.
What streets have the most affordable properties for sale in Gotham?
The streets with the most affordable properties for sale in Gotham are Grasmere Gardens at an average of £200,000, Bidwell Crescent at an average of £215,000 and Monks Lane at an average of £250,000.
Which train stations are available in or near Gotham?
Some of the train stations available in or near Gotham are East Midlands Parkway, Attenborough and Long Eaton.
Property Price Paid in Gotham by Year
The average sold property price by year was:
| Year | Average Sold Price | Price Change |
Sold Properties
|
|---|---|---|---|
| 2025 | £312,805 | -12% |
23 Properties |
| 2024 | £350,102 | -1% |
25 Properties |
| 2023 | £355,000 | 13% |
18 Properties |
| 2022 | £309,333 | 14% |
30 Properties |
| 2021 | £266,256 | -14% |
31 Properties |
| 2020 | £302,406 | 23% |
32 Properties |
| 2019 | £233,900 | -3% |
25 Properties |
| 2018 | £240,165 | -4% |
36 Properties |
| 2017 | £250,456 | -7% |
37 Properties |
| 2016 | £268,137 | 10% |
29 Properties |
| 2015 | £241,240 | 10% |
37 Properties |
| 2014 | £218,194 | 1% |
28 Properties |
| 2013 | £215,751 | 17% |
41 Properties |
| 2012 | £178,302 | -36% |
18 Properties |
| 2011 | £243,096 | 17% |
15 Properties |
| 2010 | £200,798 | -9% |
27 Properties |
| 2009 | £218,576 | 17% |
26 Properties |
| 2008 | £181,653 | -18% |
13 Properties |
| 2007 | £213,456 | 5% |
23 Properties |
| 2006 | £202,670 | -5% |
39 Properties |
| 2005 | £213,113 | 12% |
19 Properties |
| 2004 | £188,016 | 21% |
45 Properties |
| 2003 | £148,375 | -1% |
26 Properties |
| 2002 | £150,163 | 14% |
37 Properties |
| 2001 | £128,870 | 22% |
27 Properties |
| 2000 | £100,473 | -1% |
39 Properties |
| 1999 | £101,402 | 30% |
37 Properties |
| 1998 | £70,724 | -10% |
36 Properties |
| 1997 | £77,774 | -2% |
41 Properties |
| 1996 | £79,579 | 5% |
22 Properties |
| 1995 | £75,971 | - |
19 Properties |
Property Price per Property Type in Gotham
Here you can find historic sold price data in order to help with your property search.
The average Property Paid Price for specific property types in the last three years are:
| Property Type | Average Sold Price | Sold Properties |
|---|---|---|
| Semi Detached House | £281,141.00 | 30 Semi Detached Houses |
| Detached House | £449,398.00 | 26 Detached Houses |
| Terraced House | £221,850.00 | 10 Terraced Houses |

