
Houses for sale in Killisick, Nottingham
House Prices in Killisick
Properties in Killisick have an average house price of £215k and had 67 Property Transactions within the last 3 years¹.
Killisick is an area in Nottingham, Nottinghamshire with 830 households², where the most expensive property was sold for £350k.
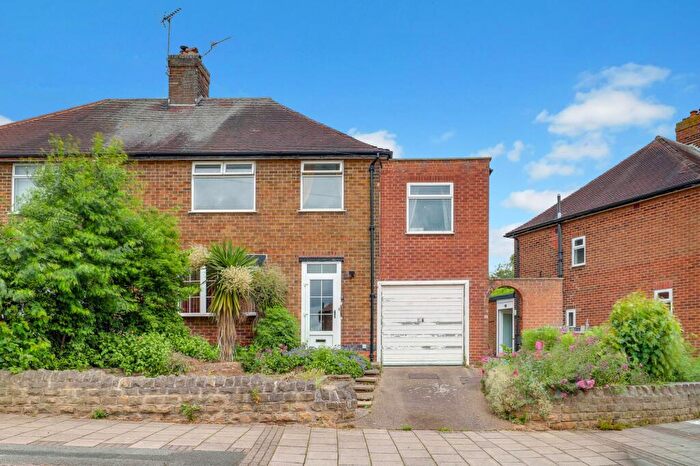
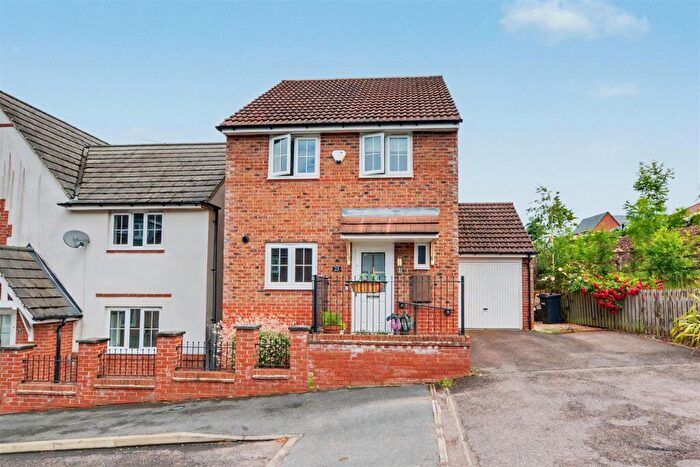
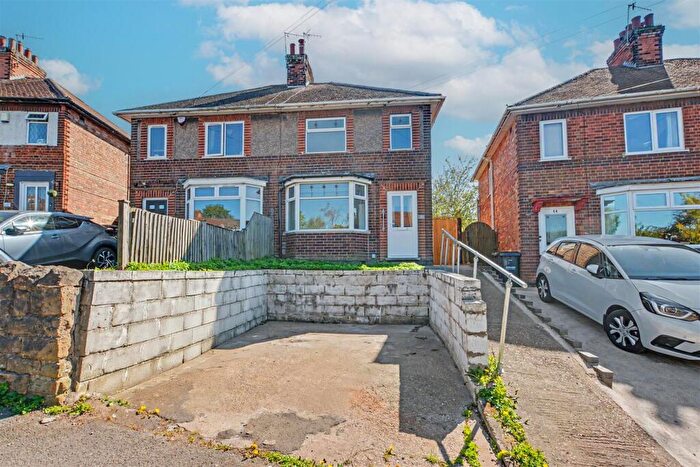
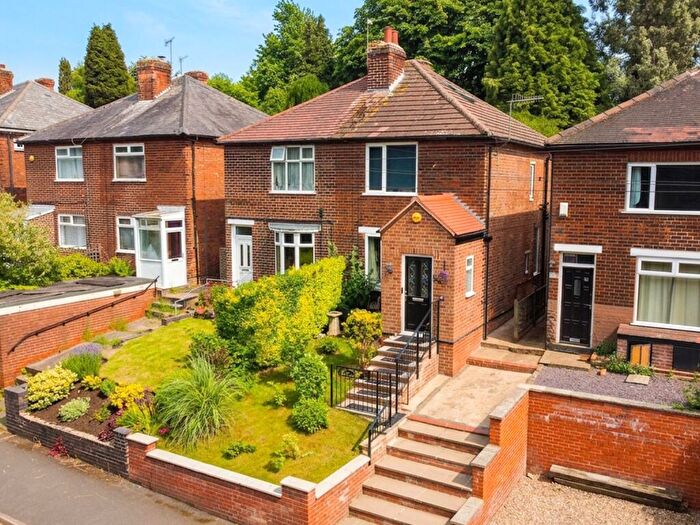
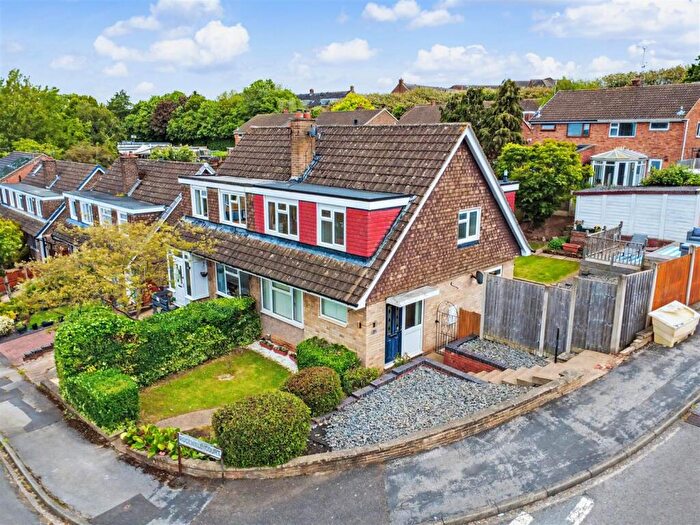
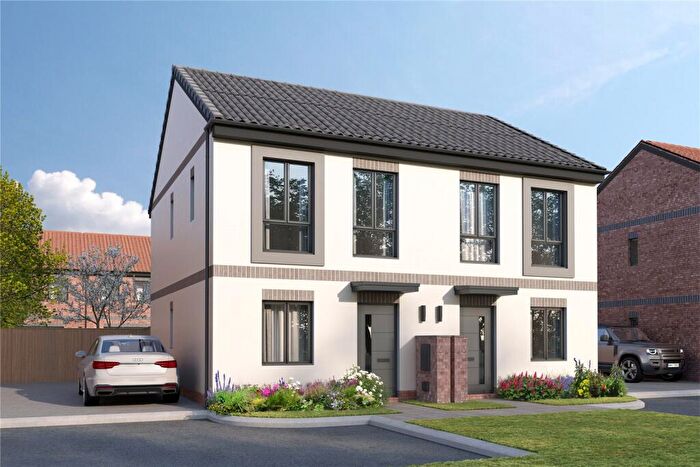
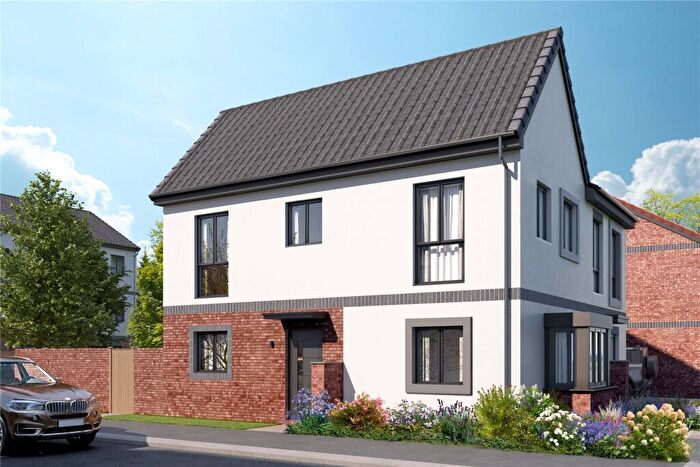
Properties for sale in Killisick
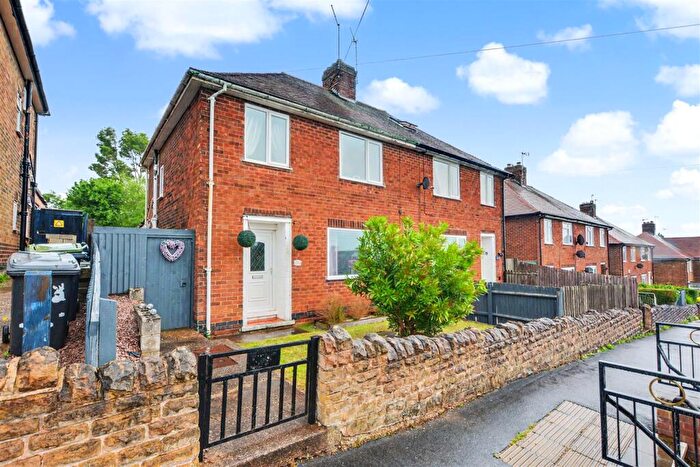

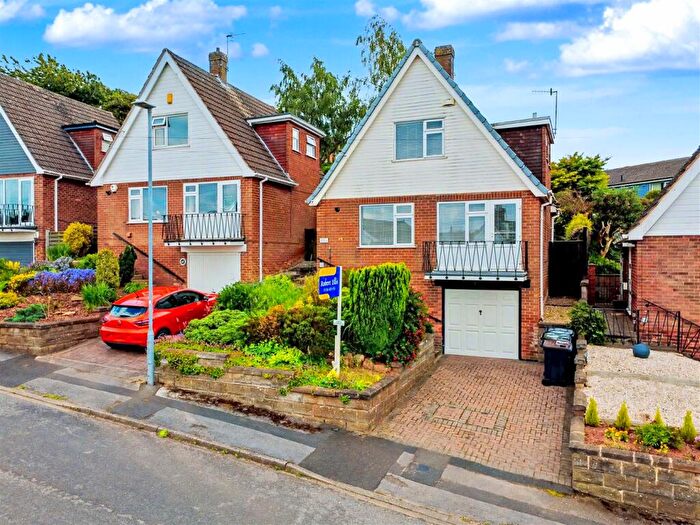
![]()
If you are looking to sell your house, let it out, or receive a property valuation, an expert can help you.
Click the button below to get started.
Roads and Postcodes in Killisick
Navigate through our locations to find the location of your next house in Killisick, Nottingham for sale or to rent.
| Streets | Postcodes |
|---|---|
| Ashdale Road | NG5 8BH |
| Beechwood Road | NG5 8BA |
| Bentwell Avenue | NG5 7EY NG5 7EZ |
| Birchfield Road | NG5 8BJ NG5 8BL NG5 8BP NG5 8BQ NG5 8BS |
| Brook Avenue | NG5 7HL |
| Brook Gardens | NG5 7FD |
| Cedar Grove | NG5 8BZ |
| Chestnut Grove | NG5 8BD |
| Coppice Road | NG5 7GS NG5 7GT NG5 7GY NG5 7GZ NG5 7HB |
| Elm Grove | NG5 8BN |
| Firbeck Road | NG5 8BB |
| Hawthorn Crescent | NG5 8BE NG5 8BG NG5 8BT NG5 8BW |
| Killisick Road | NG5 8BY NG5 8DB |
| Kilnbrook Avenue | NG5 8DA |
| Lynton Gardens | NG5 7HA |
| Malin Close | NG5 7GU |
| Needham Road | NG5 7FF |
| Pinewood Avenue | NG5 8BU |
| Rolleston Drive | NG5 7JG |
| Wardle Grove | NG5 7FE |
Property price trends in Killisick
According to the latest Land Registry data, the average home in Killisick sold for £240,000 in 2026. That figure comes from 703 sales logged over the past 31 years.
Prices have continued to climb over the last three years. Compared with 2023, when the typical sale came in around £218,687, that's a rise of roughly 9.7%.
Looking back five years, average prices are up about 25.1% since 2021, a gain of around £48,182 in cash terms.
Zoom out to the past decade for the fuller picture. Back in 2016, homes here averaged £138,162, so the typical sold price has climbed about 73.7% since then, roughly 5.7% a year. Stretch the view to fifteen years and that annual pace eases back to about 5.1%.
Frequently asked questions about Killisick
What is the average price for a property for sale in Killisick?
The average price for a property for sale in Killisick is £215,458. This amount is 24% lower than the average price in Nottingham. There are 500 property listings for sale in Killisick.
What streets have the most expensive properties for sale in Killisick?
The streets with the most expensive properties for sale in Killisick are Coppice Road at an average of £259,375, Killisick Road at an average of £245,000 and Lynton Gardens at an average of £244,142.
What streets have the most affordable properties for sale in Killisick?
The streets with the most affordable properties for sale in Killisick are Kilnbrook Avenue at an average of £85,000, Firbeck Road at an average of £88,000 and Wardle Grove at an average of £194,375.
Which train stations are available in or near Killisick?
Some of the train stations available in or near Killisick are Carlton, Bulwell and Netherfield.
Property Price Paid in Killisick by Year
The average sold property price by year was:
| Year | Average Sold Price | Price Change |
Sold Properties
|
|---|---|---|---|
| 2026 | £240,000 | 12% |
1 Property |
| 2025 | £211,500 | -2% |
24 Properties |
| 2024 | £216,516 | -1% |
30 Properties |
| 2023 | £218,687 | 5% |
12 Properties |
| 2022 | £208,447 | 8% |
19 Properties |
| 2021 | £191,818 | 4% |
25 Properties |
| 2020 | £183,496 | 11% |
24 Properties |
| 2019 | £162,663 | -3% |
23 Properties |
| 2018 | £167,068 | 8% |
22 Properties |
| 2017 | £154,067 | 10% |
22 Properties |
Property Price per Property Type in Killisick
Here you can find historic sold price data in order to help with your property search.
The average Property Paid Price for specific property types in the last three years are:
| Property Type | Average Sold Price | Sold Properties |
|---|---|---|
| Semi Detached House | £217,890.00 | 48 Semi Detached Houses |
| Terraced House | £182,785.00 | 7 Terraced Houses |
| Detached House | £271,388.00 | 9 Detached Houses |
| Flat | £85,000.00 | 3 Flats |
