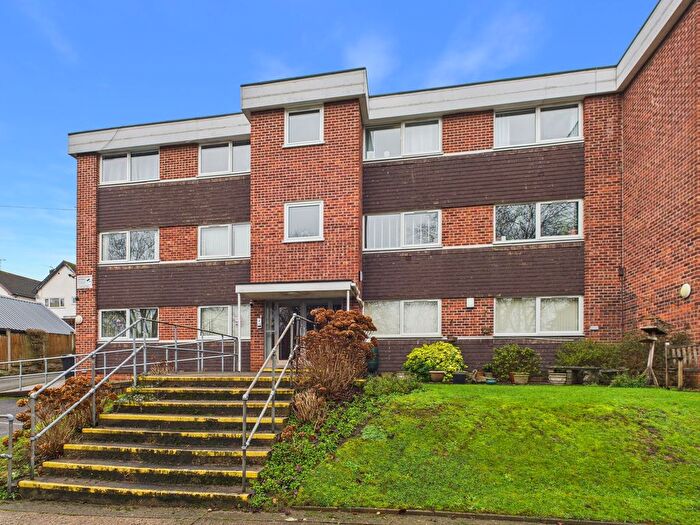
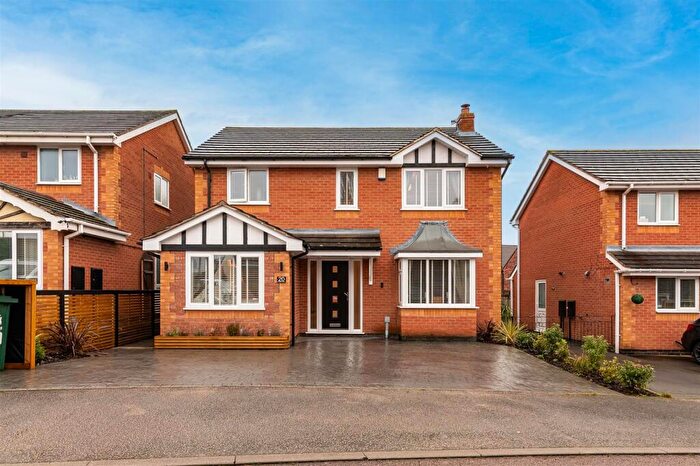
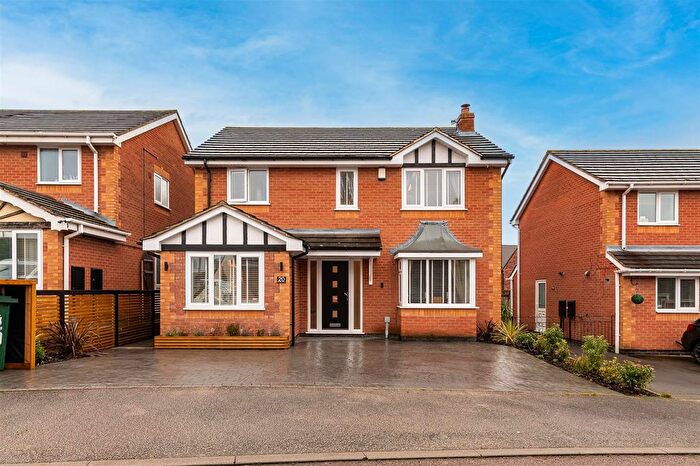
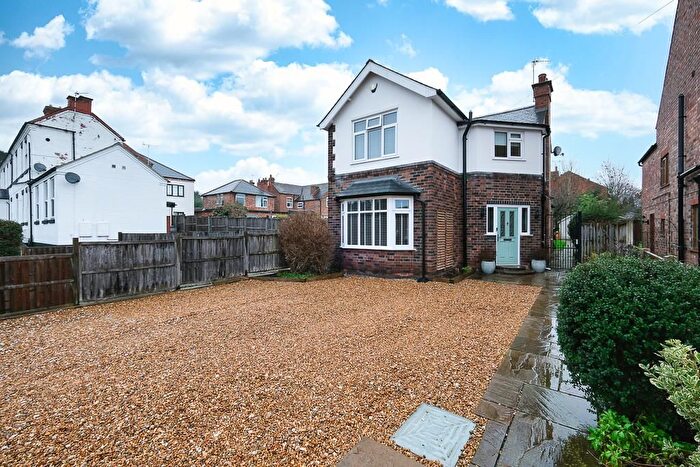
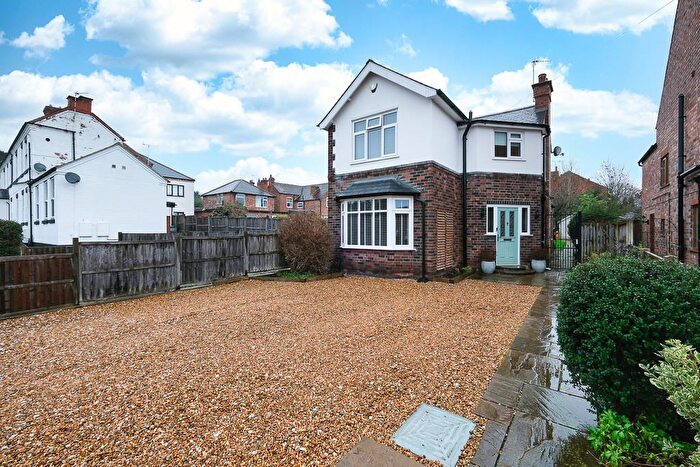
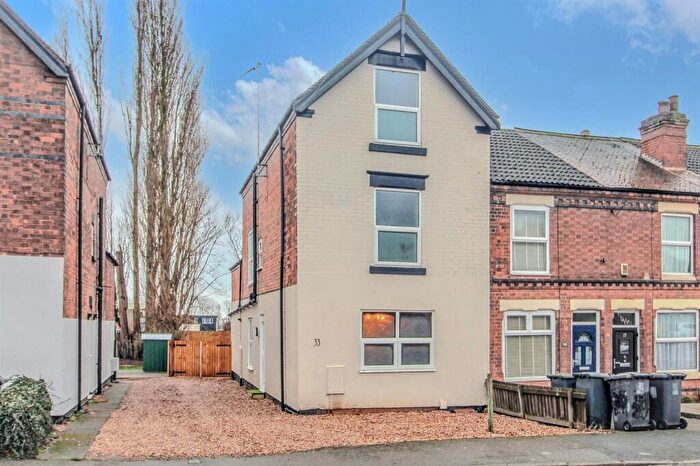
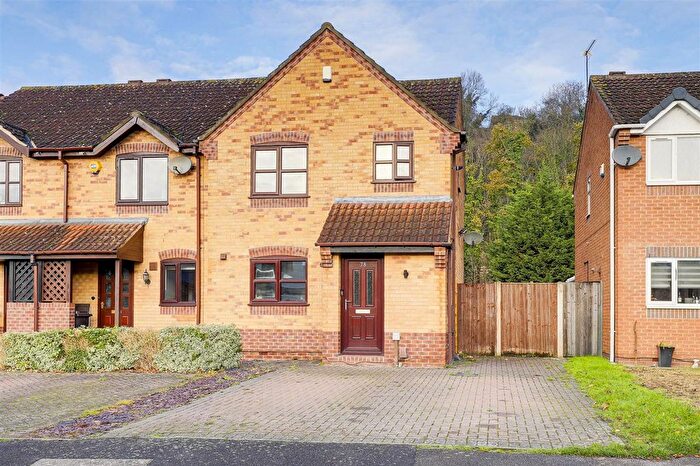
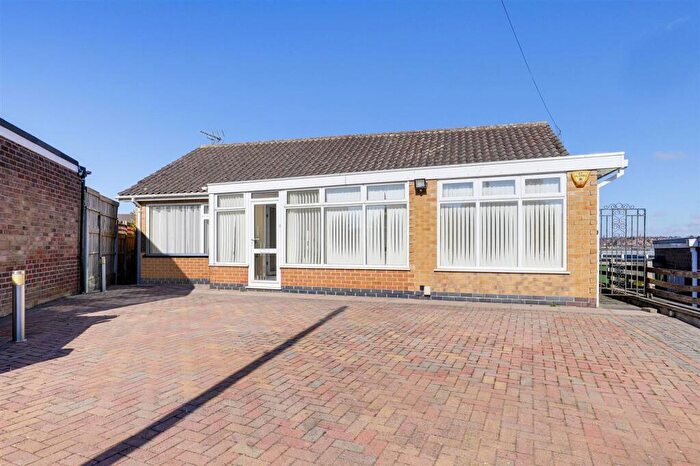
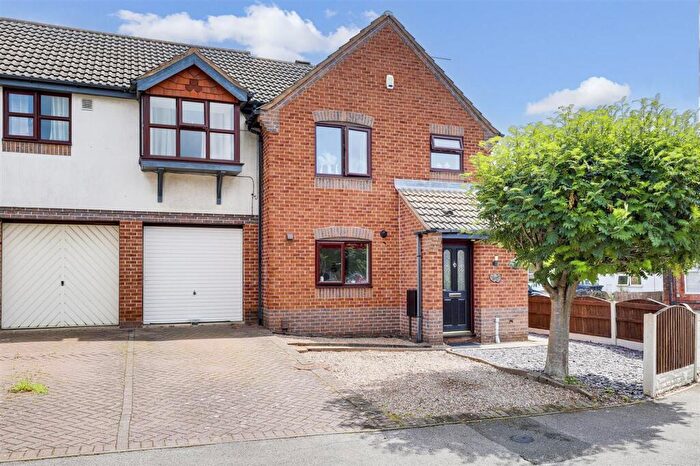
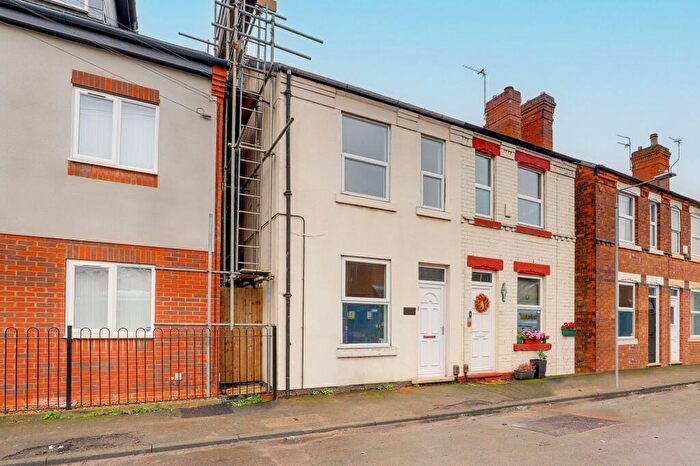
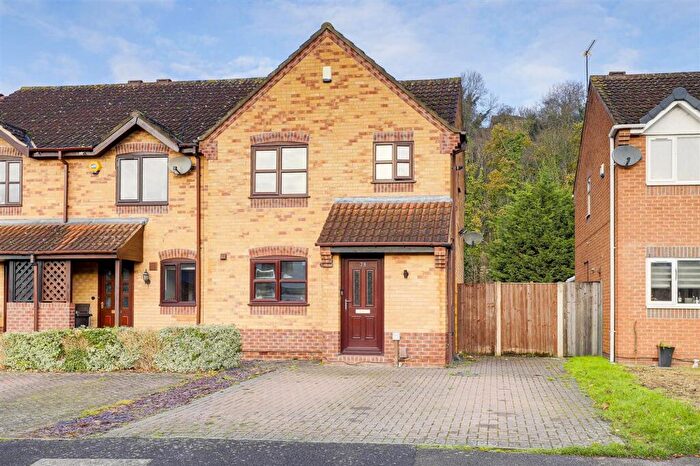
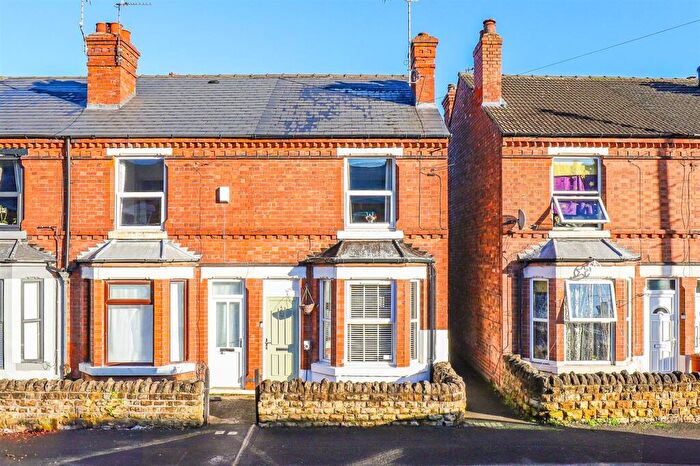
Houses for sale & to rent in Netherfield And Colwick, Nottingham
House Prices in Netherfield And Colwick
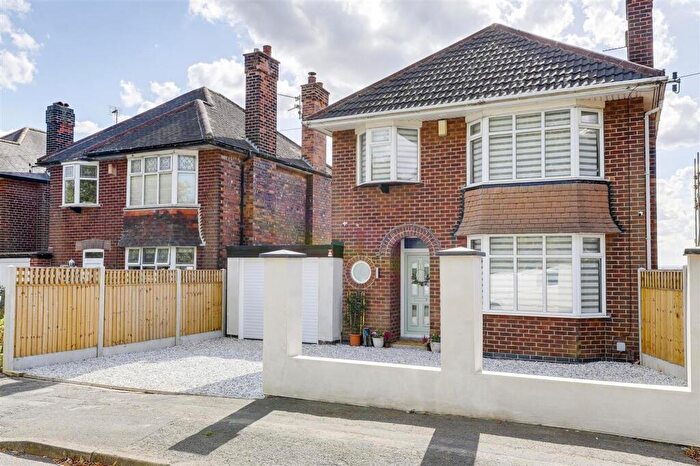
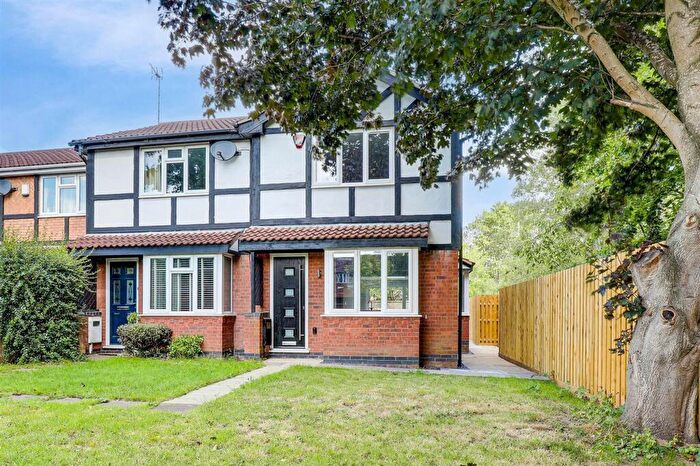
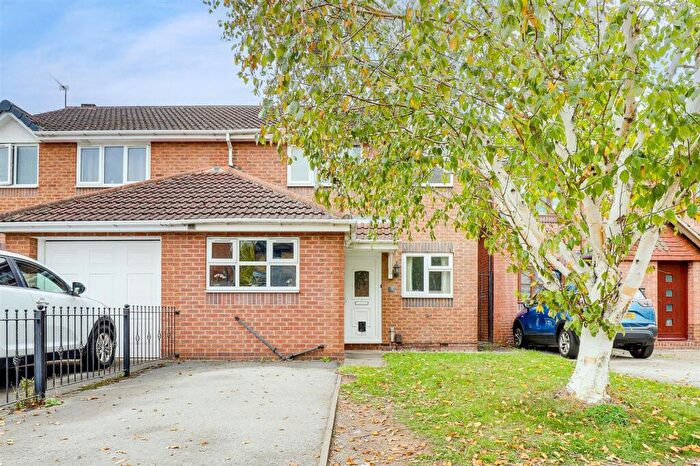
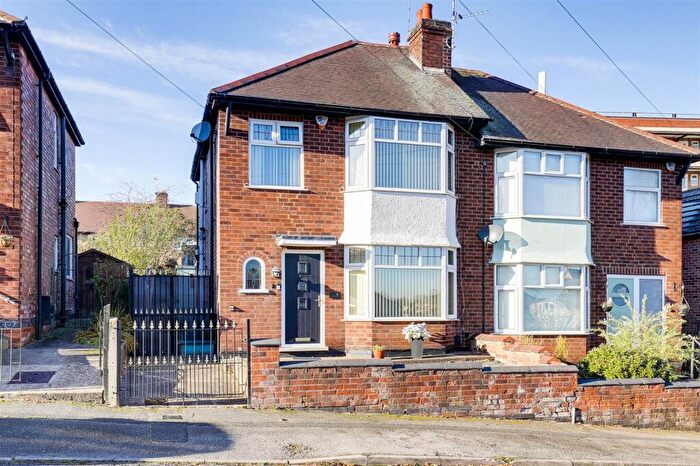
Properties in Netherfield And Colwick have an average house price of £184,089.00 and had 364 Property Transactions within the last 3 years¹.
Netherfield And Colwick is an area in Nottingham, Nottinghamshire with 3,345 households², where the most expensive property was sold for £475,000.00.
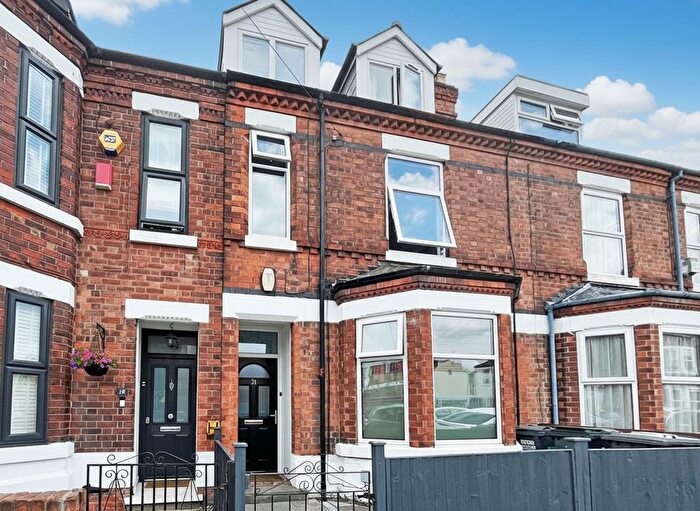
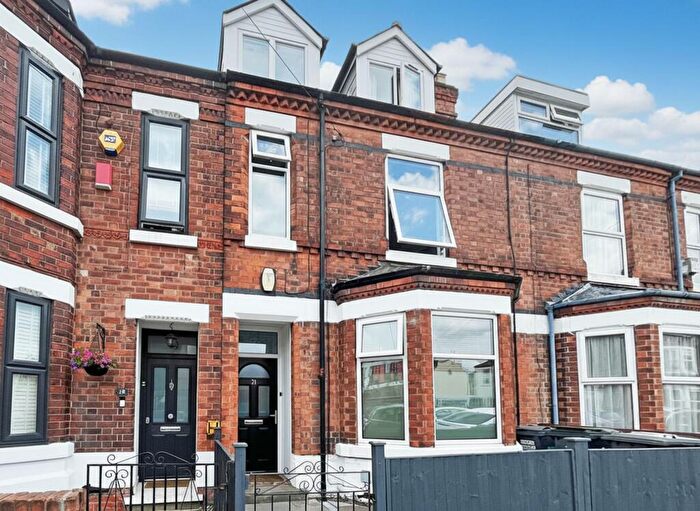
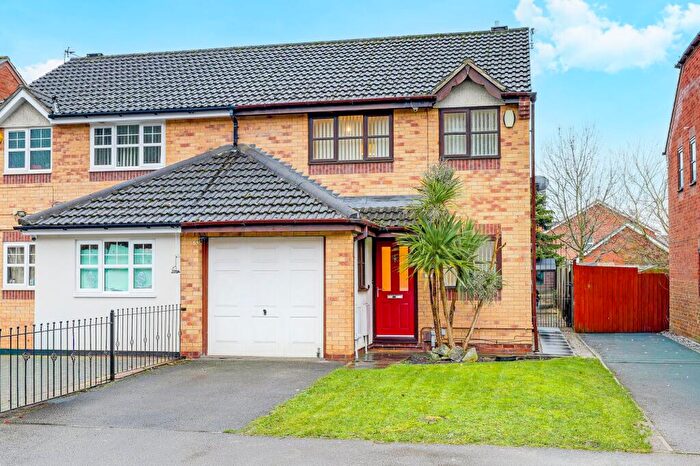
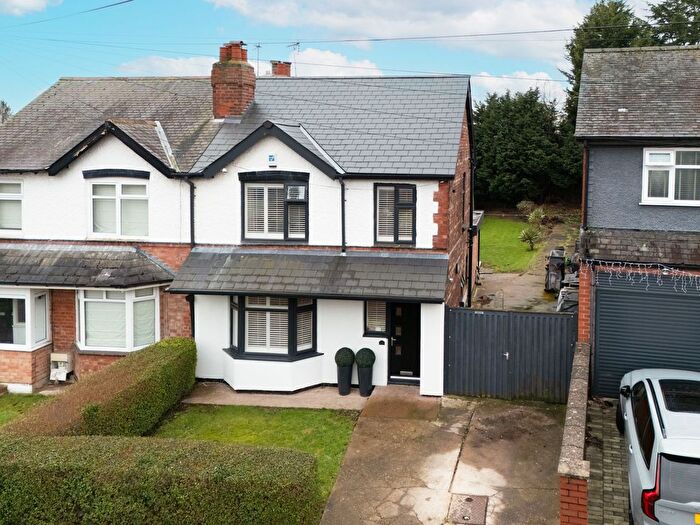
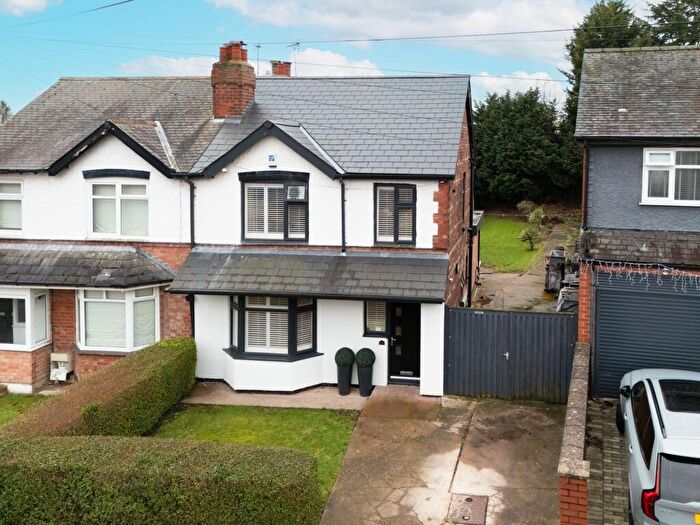
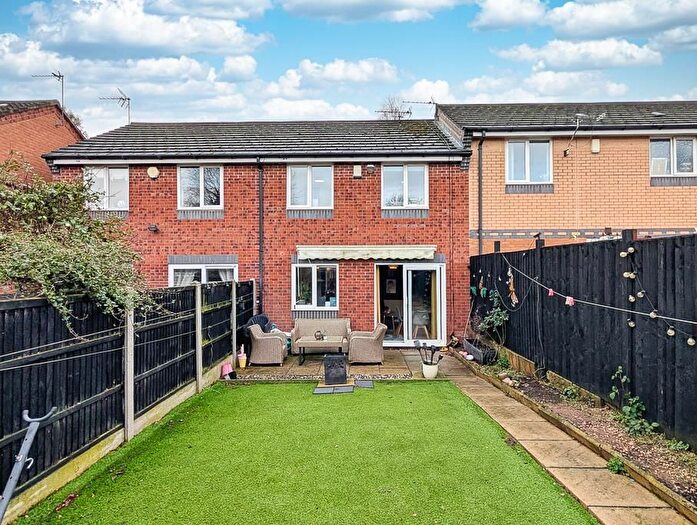
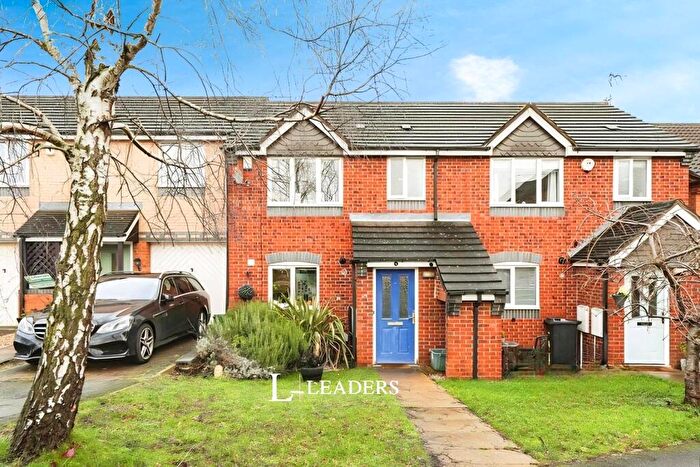
Properties for sale in Netherfield And Colwick
Roads and Postcodes in Netherfield And Colwick
Navigate through our locations to find the location of your next house in Netherfield And Colwick, Nottingham for sale or to rent.
| Streets | Postcodes |
|---|---|
| Ambleside Way | NG4 2QY |
| Arthur Street | NG4 2HN NG4 2HP |
| Ashwell Street | NG4 2FQ |
| Asper Street | NG4 2NS |
| Bailey Street | NG4 2NL |
| Balmoral Grove | NG4 2GB |
| Balmoral Road | NG4 2GD NG4 2GF |
| Beech Avenue | NG4 2FU |
| Belvoir Road | NG4 2LY |
| Bourne Mews | NG4 2GU NG4 2GY |
| Bourne Street | NG4 2FH NG4 2FJ |
| Brierley Green | NG4 2PP |
| Cameo Close | NG4 2BP |
| Carnarvon Street | NG4 2FL NG4 2FP |
| Chandos Avenue | NG4 2NF |
| Chandos Street | NG4 2LP NG4 2LR NG4 2LS NG4 2LW NG4 2NA NG4 2NB |
| Chaworth Road | NG4 2FZ |
| Clumber Avenue | NG4 2LX |
| Colwick Manor Farm | NG4 2DP |
| Colwick Park Close | NG4 2DZ |
| Cooper Street | NG4 2HX |
| Cottage Meadow | NG4 2DG |
| Cross Street | NG4 2NT |
| Crosslands Meadow | NG4 2DJ |
| Curzon Street | NG4 2NQ NG4 2NR NG4 2NU |
| Deabill Court | NG4 2GA |
| Deabill Street | NG4 2HW NG4 2HY NG4 2JB NG4 2JE |
| Denby Court | NG4 2RJ |
| Dennis Street | NG4 2HR |
| Drummond Avenue | NG4 2PR |
| Dunstan Street | NG4 2NW NG4 2NZ NG4 2PB |
| Egling Croft | NG4 2DB |
| Emerys Road | NG4 2QQ NG4 2QR |
| Fenwick Court | NG4 2RH |
| Festus Street | NG4 2LN |
| First Avenue | NG4 2DX |
| Forester Street | NG4 2LJ NG4 2NG NG4 2NJ |
| Fox Covert | NG4 2DD |
| Furzebrook Road | NG4 2BX |
| Garnet Street | NG4 2FB NG4 2FX |
| Glen Helen | NG4 2GE |
| Godfrey Street | NG4 2JG NG4 2JH |
| Green Avenue | NG4 2LZ |
| Harrogate Street | NG4 2FS |
| Henley Close | NG4 2PN |
| Hodgkinson Street | NG4 2HZ |
| Holyoake Villas | NG4 2FY |
| Hotspur Drive | NG4 2BS NG4 2BT |
| Kappler Close | NG4 2PT |
| Kenrick Street | NG4 2LE |
| Kingsley Drive | NG4 2PJ |
| Knight Street | NG4 2FN |
| Kozi Kots | NG4 2FD |
| Langton Close | NG4 2BW |
| Lawrence Avenue | NG4 2GS |
| Ley Street | NG4 2PH |
| Lily Avenue | NG4 2NH |
| Little Ox | NG4 2DA |
| Louise Avenue | NG4 2ND |
| Manvers Street | NG4 2HJ NG4 2HL |
| Matlock Street | NG4 2FT |
| Meadow Cottages | NG4 2FE |
| Meadow Road | NG4 2FF NG4 2FR |
| Midland Grove | NG4 2NE |
| Mile End Road | NG4 2DW |
| Moor Street | NG4 2FG |
| Morris Street | NG4 2LH |
| Musters Croft | NG4 2EY |
| Nether Pasture | NG4 2JZ |
| Newvale Road | NG4 2EA |
| Norman Street | NG4 2JD |
| Ozier Holt | NG4 2DQ |
| Parsons Meadow | NG4 2ES |
| Pearson Street | NG4 2JA |
| Pool Meadow | NG4 2DF |
| Ramblers Close | NG4 2DN |
| Rectory Road | NG4 2DU |
| Revena Close | NG4 2BR |
| Rochester Avenue | NG4 2PL NG4 2PS |
| Sands Close | NG4 2GZ |
| Shakespeare Close | NG4 2DE |
| Shaw Gardens | NG4 2NY |
| Spray Close | NG4 2GT |
| Staffords Court | NG4 2NP |
| Stratford Close | NG4 2DL |
| Swan Meadow | NG4 2ET |
| The Elms | NG4 2FW NG4 2GW |
| Tudor Close | NG4 2DR |
| Vale Gardens | NG4 2DY |
| Vale Road | NG4 2EB NG4 2ED NG4 2GJ NG4 2GL NG4 2GN NG4 2GP |
| Valeside Gardens | NG4 2EL NG4 2EN NG4 2EP |
| Verona Avenue | NG4 2BN |
| Victoria Road | NG4 2HE NG4 2HG NG4 2HH NG4 2HQ NG4 2JF NG4 2JJ NG4 2LA NG4 2NN |
| Wallet Street | NG4 2LT |
| William Close | NG4 2QX |
| Woodland Grove | NG4 2GG |
| York Street | NG4 2LU |
Transport near Netherfield And Colwick
-
Netherfield Station
-
Carlton Station
-
Radcliffe (Nottinghamshire) Station
-
Burton Joyce Station
-
Nottingham Station
- FAQ
- Price Paid By Year
- Property Type Price
Frequently asked questions about Netherfield And Colwick
What is the average price for a property for sale in Netherfield And Colwick?
The average price for a property for sale in Netherfield And Colwick is £184,089. This amount is 35% lower than the average price in Nottingham. There are 1,254 property listings for sale in Netherfield And Colwick.
What streets have the most expensive properties for sale in Netherfield And Colwick?
The streets with the most expensive properties for sale in Netherfield And Colwick are Pool Meadow at an average of £455,000, Ozier Holt at an average of £420,000 and Crosslands Meadow at an average of £384,000.
What streets have the most affordable properties for sale in Netherfield And Colwick?
The streets with the most affordable properties for sale in Netherfield And Colwick are Lily Avenue at an average of £108,000, Garnet Street at an average of £112,000 and Hodgkinson Street at an average of £120,000.
Which train stations are available in or near Netherfield And Colwick?
Some of the train stations available in or near Netherfield And Colwick are Netherfield, Carlton and Radcliffe (Nottinghamshire).
Property Price Paid in Netherfield And Colwick by Year
The average sold property price by year was:
| Year | Average Sold Price | Price Change |
Sold Properties
|
|---|---|---|---|
| 2025 | £199,484 | 11% |
110 Properties |
| 2024 | £178,231 | 1% |
124 Properties |
| 2023 | £176,651 | 5% |
130 Properties |
| 2022 | £168,557 | -0,3% |
141 Properties |
| 2021 | £169,073 | 15% |
203 Properties |
| 2020 | £144,336 | 4% |
137 Properties |
| 2019 | £138,567 | -3% |
180 Properties |
| 2018 | £142,689 | 12% |
169 Properties |
| 2017 | £126,147 | 3% |
162 Properties |
| 2016 | £122,872 | 10% |
167 Properties |
| 2015 | £110,420 | -1% |
167 Properties |
| 2014 | £111,005 | 5% |
176 Properties |
| 2013 | £105,139 | 3% |
153 Properties |
| 2012 | £101,553 | 1% |
102 Properties |
| 2011 | £100,384 | -6% |
85 Properties |
| 2010 | £106,260 | -2% |
137 Properties |
| 2009 | £108,829 | 5% |
85 Properties |
| 2008 | £103,110 | -7% |
126 Properties |
| 2007 | £110,464 | -5% |
266 Properties |
| 2006 | £116,407 | 11% |
247 Properties |
| 2005 | £103,210 | 4% |
196 Properties |
| 2004 | £99,099 | 15% |
256 Properties |
| 2003 | £84,024 | 10% |
275 Properties |
| 2002 | £75,569 | 23% |
331 Properties |
| 2001 | £58,450 | 12% |
274 Properties |
| 2000 | £51,567 | 3% |
284 Properties |
| 1999 | £50,202 | 0,3% |
275 Properties |
| 1998 | £50,046 | 13% |
260 Properties |
| 1997 | £43,648 | 14% |
246 Properties |
| 1996 | £37,622 | -7% |
157 Properties |
| 1995 | £40,349 | - |
155 Properties |
Property Price per Property Type in Netherfield And Colwick
Here you can find historic sold price data in order to help with your property search.
The average Property Paid Price for specific property types in the last three years are:
| Property Type | Average Sold Price | Sold Properties |
|---|---|---|
| Semi Detached House | £200,254.00 | 108 Semi Detached Houses |
| Detached House | £306,307.00 | 26 Detached Houses |
| Terraced House | £164,380.00 | 218 Terraced Houses |
| Flat | £131,841.00 | 12 Flats |

