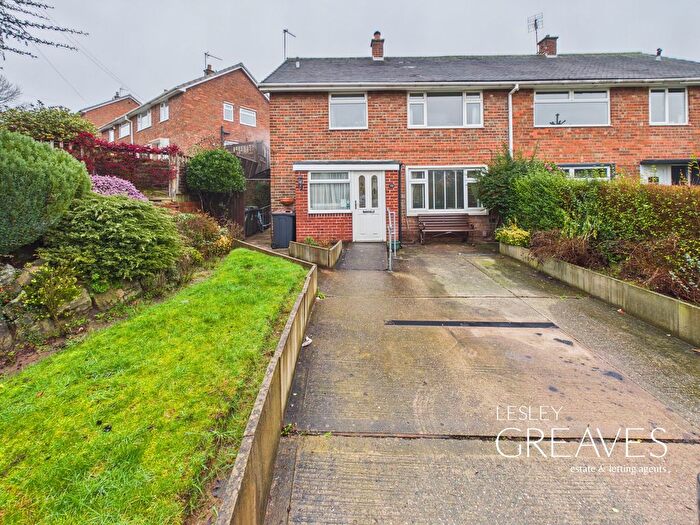
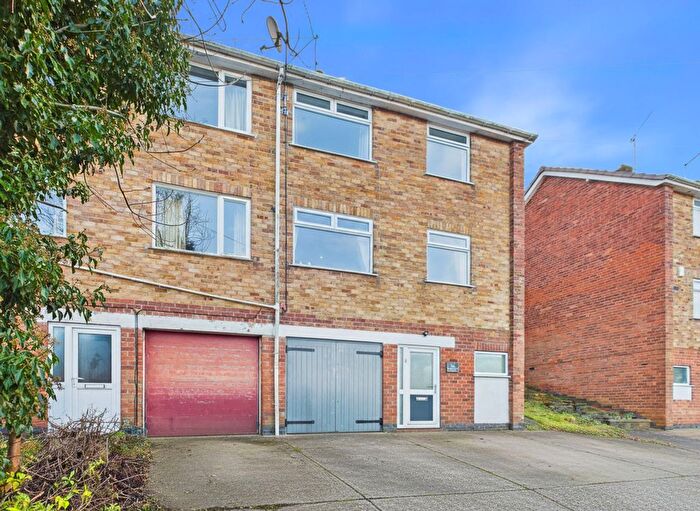
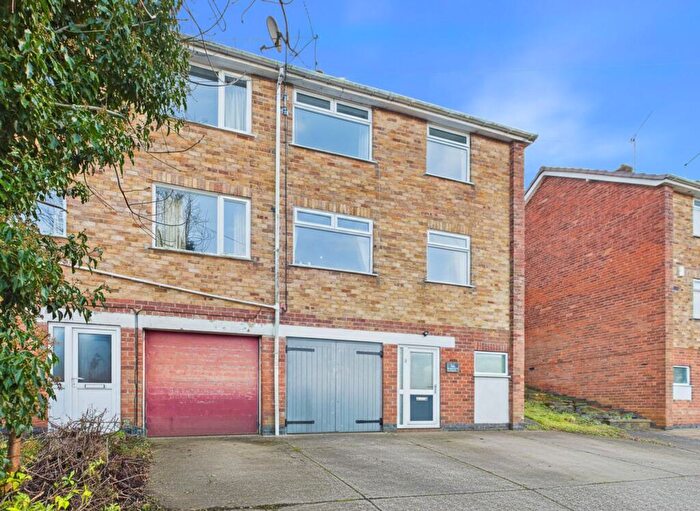
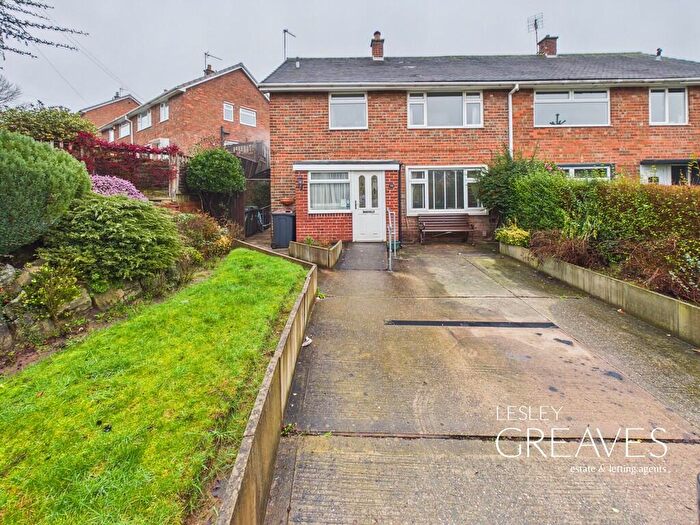
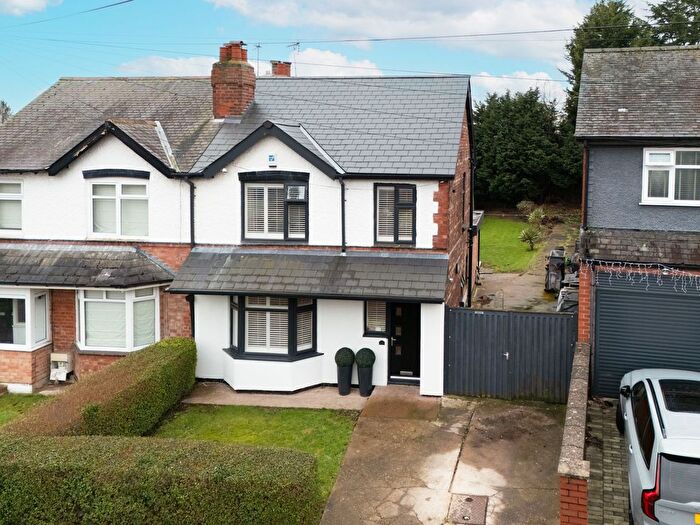
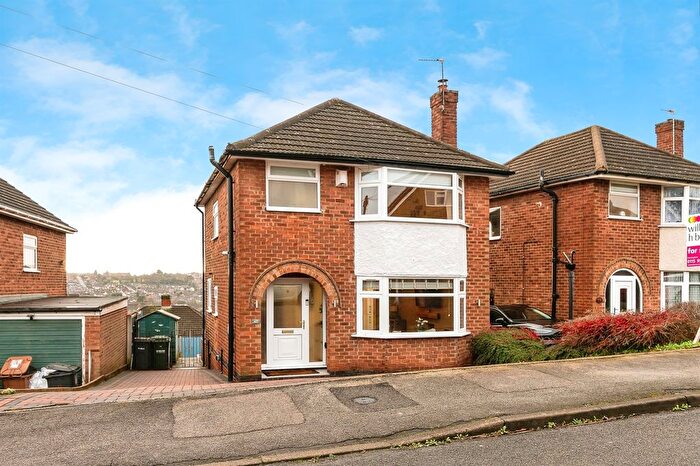
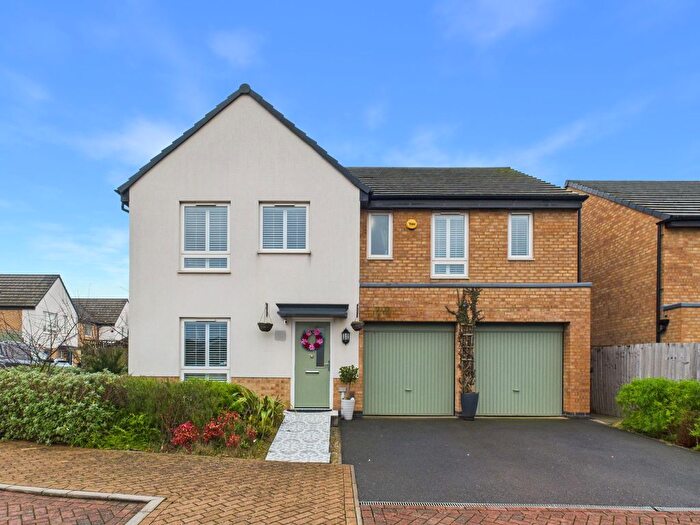
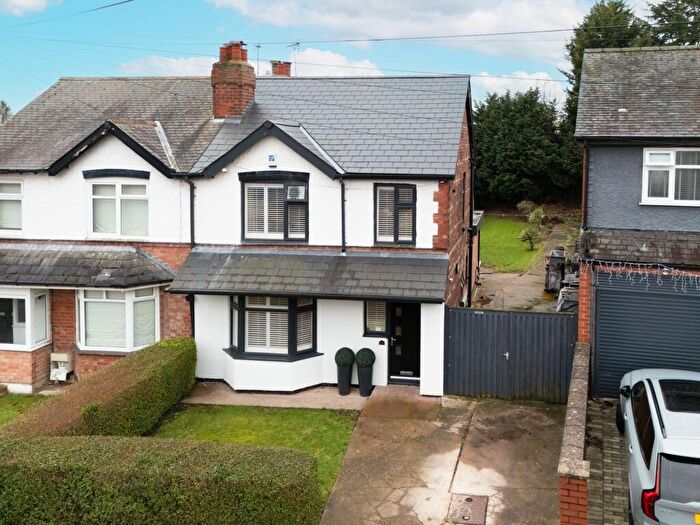
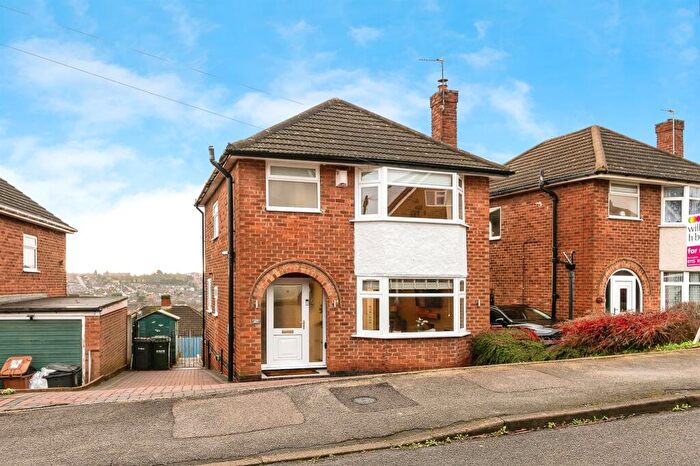
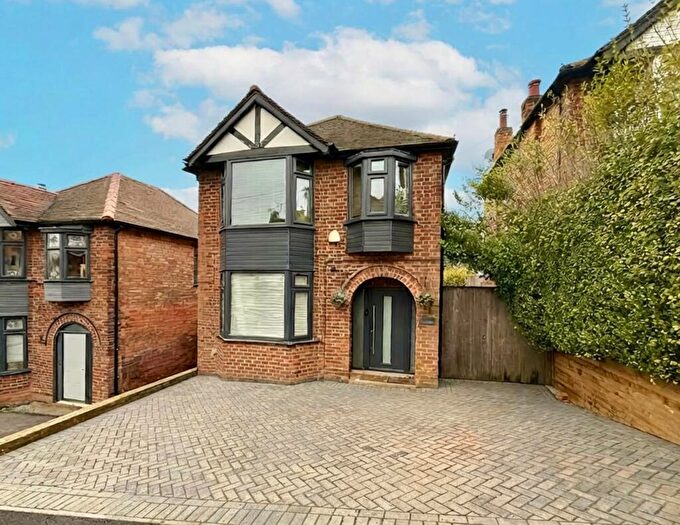
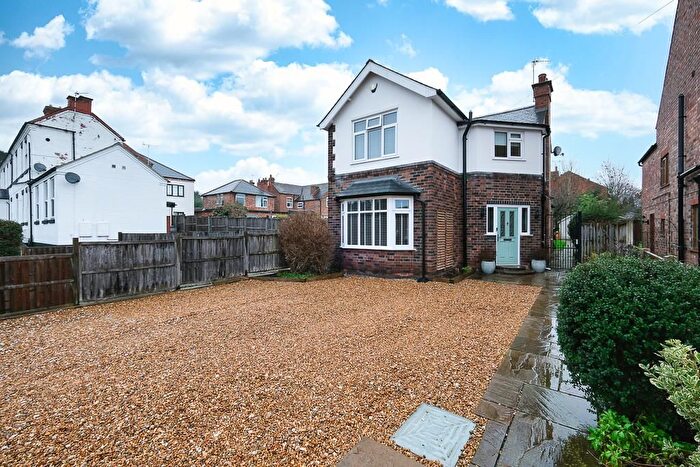
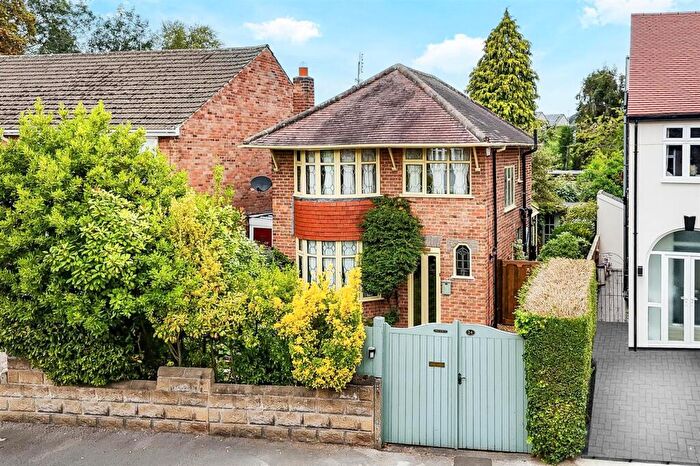
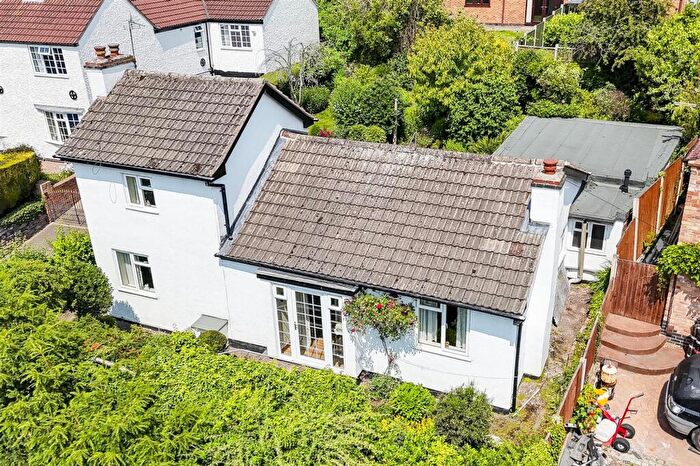
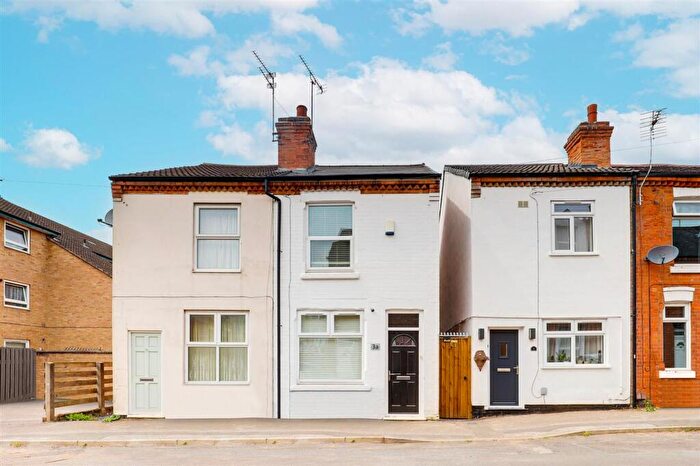
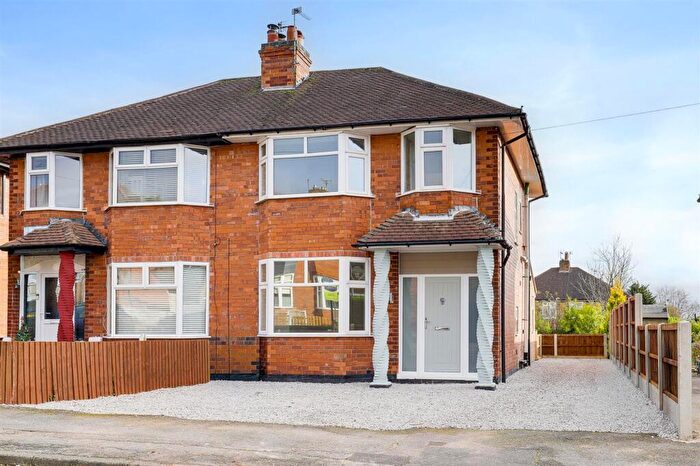
Houses for sale & to rent in Phoenix, Nottingham
House Prices in Phoenix
Properties in Phoenix have an average house price of £205,183.00 and had 223 Property Transactions within the last 3 years¹.
Phoenix is an area in Nottingham, Nottinghamshire with 2,011 households², where the most expensive property was sold for £480,000.00.
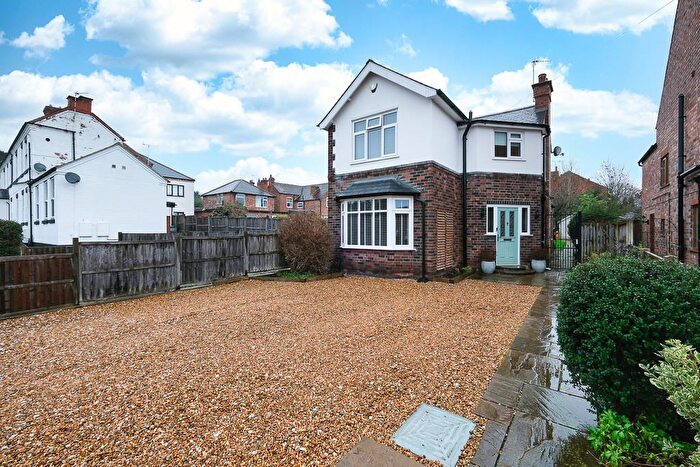
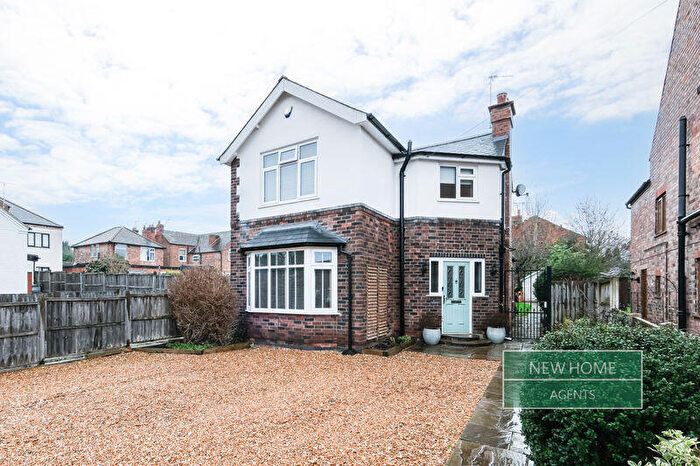
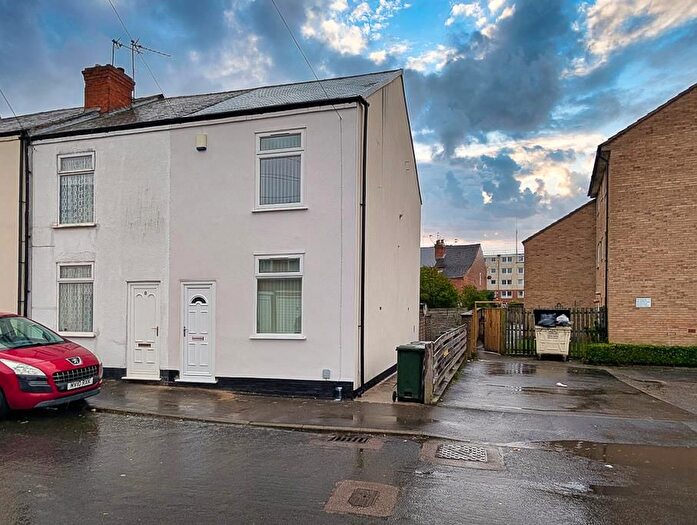
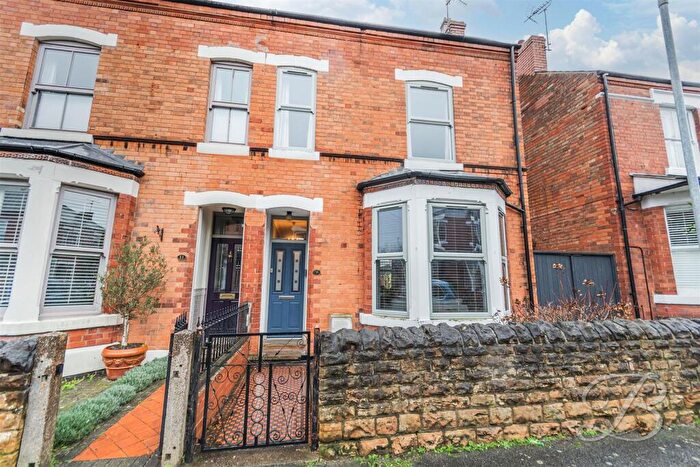
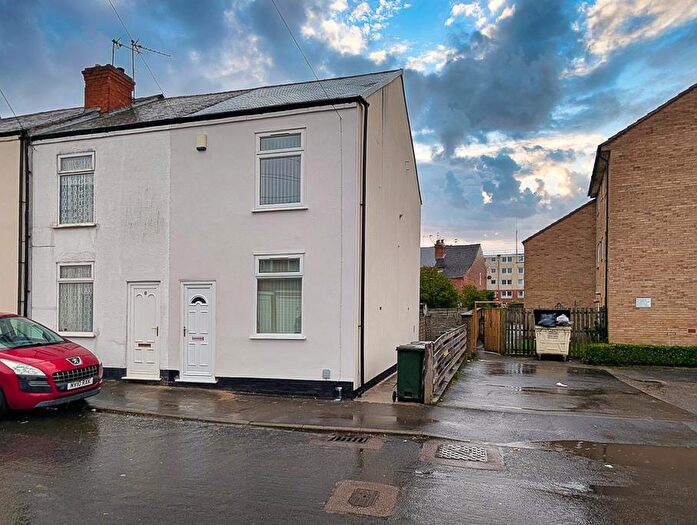
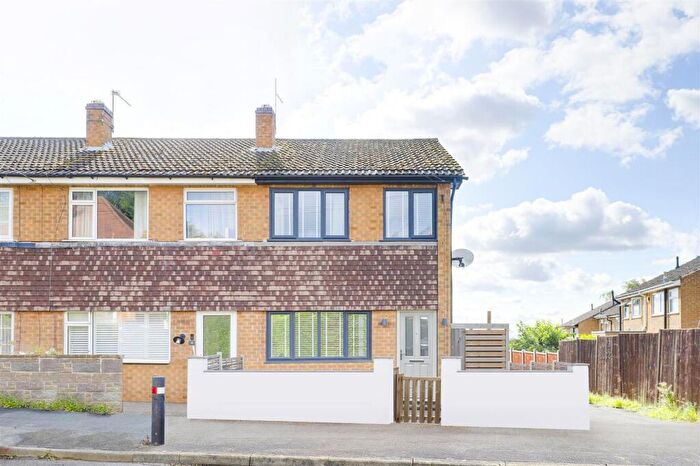
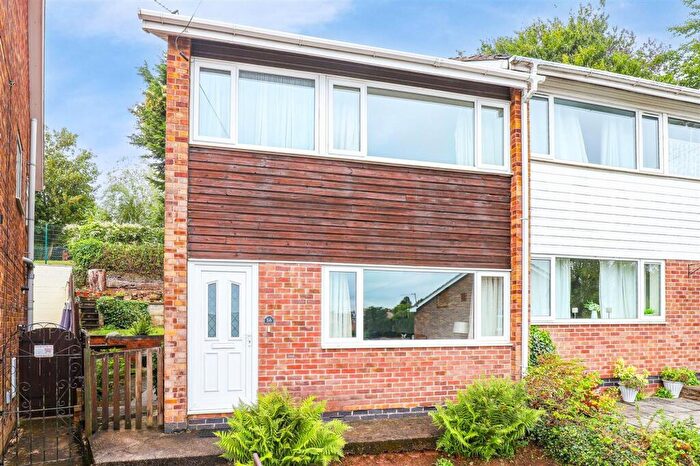
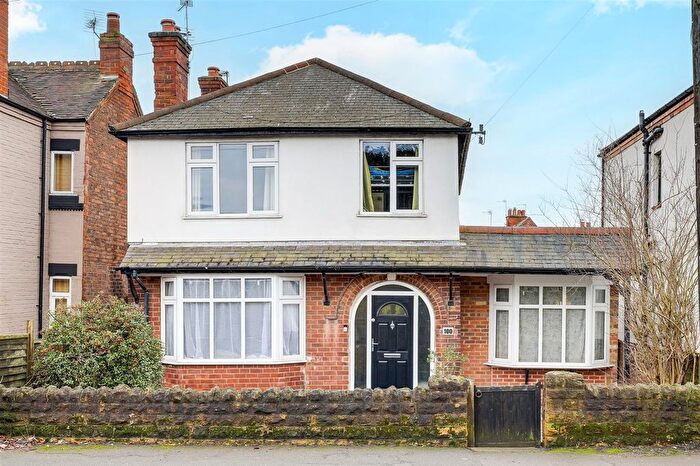
Properties for sale in Phoenix
Roads and Postcodes in Phoenix
Navigate through our locations to find the location of your next house in Phoenix, Nottingham for sale or to rent.
| Streets | Postcodes |
|---|---|
| Acacia Crescent | NG4 3JH |
| Adbolton Avenue | NG4 3NB NG4 3PF |
| Adel Drive | NG4 3NL |
| Albert Street | NG4 3JD |
| All Hallows Drive | NG4 3LD |
| Appletree Lane | NG4 3LA |
| Arnold Lane | NG4 4HA NG4 4HE |
| Babbington Crescent | NG4 4ER |
| Bakewell Avenue | NG4 3NY |
| Barons Close | NG4 3LZ |
| Baslow Avenue | NG4 3NT |
| Belper Crescent | NG4 3RQ |
| Berryhill Grove | NG4 4EF |
| Besecar Avenue | NG4 4DL NG4 4DP NG4 4EN NG4 4EP NG4 4ES NG4 4ET |
| Besecar Close | NG4 4DN |
| Beverley Gardens | NG4 3LF |
| Burlington Road | NG4 3JJ |
| Cambridge Street | NG4 3JS |
| Cantley Avenue | NG4 3PD |
| Castleton Avenue | NG4 3NZ |
| Charles Close | NG4 4EH |
| Chatsworth Avenue | NG4 3JL |
| Chestnut Grove | NG4 3JB |
| Church View | NG4 3HW |
| Cinderhill Grove | NG4 4EQ |
| Clifton Grove | NG4 4DQ |
| Cotgrave Avenue | NG4 4EB |
| Crescent Avenue | NG4 3JQ |
| Darley Avenue | NG4 3PA |
| Elizabeth Grove | NG4 4DY |
| First Avenue | NG4 3JY |
| Friday Lane | NG4 3LB NG4 3LJ |
| Hardys Drive | NG4 3HR |
| Harlow Grove | NG4 4EE |
| Hartington Avenue | NG4 3NR |
| Hucknall Crescent | NG4 4HZ |
| Imperial Avenue | NG4 3NE |
| Jenkins Close | NG4 4NS |
| Kings Avenue | NG4 4ED |
| Linby Close | NG4 4JY |
| Lymn Avenue | NG4 4EA |
| Main Road | NG4 3HS |
| Margaret Crescent | NG4 4DX |
| Marian Murdoch Court | NG4 4DH |
| Mountbatten Grove | NG4 4DU |
| Newcastle Avenue | NG4 3ND |
| Newlands Drive | NG4 3HU |
| Oakham Court | NG4 4AW |
| Oxford Street | NG4 3JR |
| Perlethorpe Avenue | NG4 4GG NG4 4GH |
| Perlethorpe Close | NG4 4GF |
| Perlethorpe Crescent | NG4 4GL |
| Perlethorpe Drive | NG4 4GJ |
| Philip Grove | NG4 4DZ |
| Phoenix Avenue | NG4 4DR NG4 4DT NG4 4EL |
| Pierrepont Avenue | NG4 3NG |
| Princess Close | NG4 4EU |
| Priory Crescent | NG4 3LH |
| Priory Road | NG4 3JX NG4 3JZ NG4 3LE NG4 3LG |
| Queens Avenue | NG4 4DW NG4 4EJ |
| Radford Crescent | NG4 4DS |
| Ramsdale Road | NG4 3JT |
| Redcar Close | NG4 4EW |
| Rhyl Crescent | NG4 4EG |
| Roslyn Avenue | NG4 3NJ NG4 3NQ |
| Shelford Road | NG4 4NP |
| St Marys Avenue | NG4 3NP |
| St Michaels Avenue | NG4 3NN NG4 3PE |
| Storey Avenue | NG4 4GN |
| Third Avenue | NG4 3LL |
| Turpin Avenue | NG4 4HJ |
| Victoria Street | NG4 3JE |
| West View Court | NG4 3ES |
| West View Road | NG4 3FF |
| Westdale Crescent | NG4 3JP |
| Westdale Lane | NG4 3JA NG4 3JF NG4 3JN NG4 3JU NG4 3NA NG4 3NF NG4 3NH NG4 3NS NG4 3NU NG4 3NW NG4 3NX NG4 3PB NG4 4FN NG4 4FP |
| Westdale Lane East | NG4 3PH |
| Wollaton Avenue | NG4 4HY |
Transport near Phoenix
- FAQ
- Price Paid By Year
- Property Type Price
Frequently asked questions about Phoenix
What is the average price for a property for sale in Phoenix?
The average price for a property for sale in Phoenix is £205,183. This amount is 27% lower than the average price in Nottingham. There are 2,390 property listings for sale in Phoenix.
What streets have the most expensive properties for sale in Phoenix?
The streets with the most expensive properties for sale in Phoenix are Bakewell Avenue at an average of £382,500, Pierrepont Avenue at an average of £362,500 and Barons Close at an average of £300,000.
What streets have the most affordable properties for sale in Phoenix?
The streets with the most affordable properties for sale in Phoenix are Princess Close at an average of £107,846, Berryhill Grove at an average of £109,250 and Friday Lane at an average of £116,166.
Which train stations are available in or near Phoenix?
Some of the train stations available in or near Phoenix are Carlton, Netherfield and Burton Joyce.
Property Price Paid in Phoenix by Year
The average sold property price by year was:
| Year | Average Sold Price | Price Change |
Sold Properties
|
|---|---|---|---|
| 2025 | £207,926 | -1% |
69 Properties |
| 2024 | £210,993 | 7% |
76 Properties |
| 2023 | £197,096 | -13% |
78 Properties |
| 2022 | £223,114 | 14% |
86 Properties |
| 2021 | £191,243 | 7% |
110 Properties |
| 2020 | £178,737 | 6% |
70 Properties |
| 2019 | £168,868 | 9% |
95 Properties |
| 2018 | £153,424 | 1% |
90 Properties |
| 2017 | £152,581 | 10% |
79 Properties |
| 2016 | £137,873 | 5% |
86 Properties |
| 2015 | £130,566 | 15% |
90 Properties |
| 2014 | £111,517 | -8% |
95 Properties |
| 2013 | £120,523 | 7% |
63 Properties |
| 2012 | £112,628 | 3% |
66 Properties |
| 2011 | £108,759 | -4% |
61 Properties |
| 2010 | £113,180 | 12% |
53 Properties |
| 2009 | £99,715 | -26% |
44 Properties |
| 2008 | £125,677 | 3% |
46 Properties |
| 2007 | £122,087 | 5% |
114 Properties |
| 2006 | £116,137 | 3% |
115 Properties |
| 2005 | £112,483 | 8% |
78 Properties |
| 2004 | £103,840 | 14% |
108 Properties |
| 2003 | £89,687 | 18% |
98 Properties |
| 2002 | £73,820 | 18% |
128 Properties |
| 2001 | £60,638 | 8% |
129 Properties |
| 2000 | £55,764 | 13% |
121 Properties |
| 1999 | £48,715 | 9% |
105 Properties |
| 1998 | £44,563 | -3% |
98 Properties |
| 1997 | £45,703 | 10% |
101 Properties |
| 1996 | £41,047 | -4% |
91 Properties |
| 1995 | £42,487 | - |
89 Properties |
Property Price per Property Type in Phoenix
Here you can find historic sold price data in order to help with your property search.
The average Property Paid Price for specific property types in the last three years are:
| Property Type | Average Sold Price | Sold Properties |
|---|---|---|
| Semi Detached House | £214,303.00 | 107 Semi Detached Houses |
| Detached House | £291,506.00 | 39 Detached Houses |
| Terraced House | £160,726.00 | 61 Terraced Houses |
| Flat | £103,281.00 | 16 Flats |

