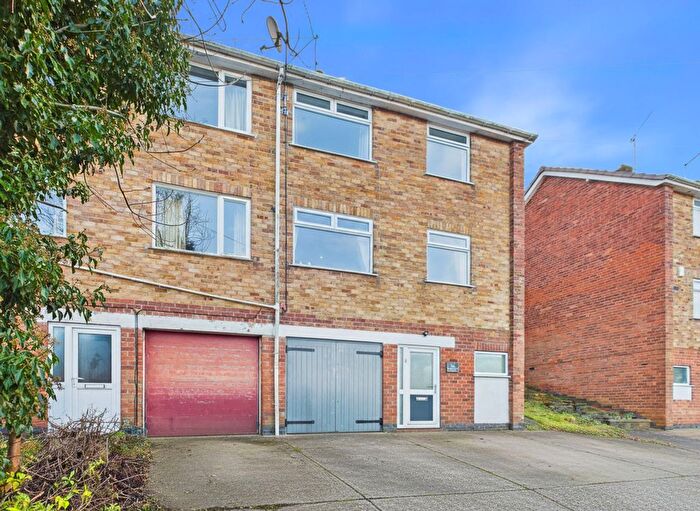
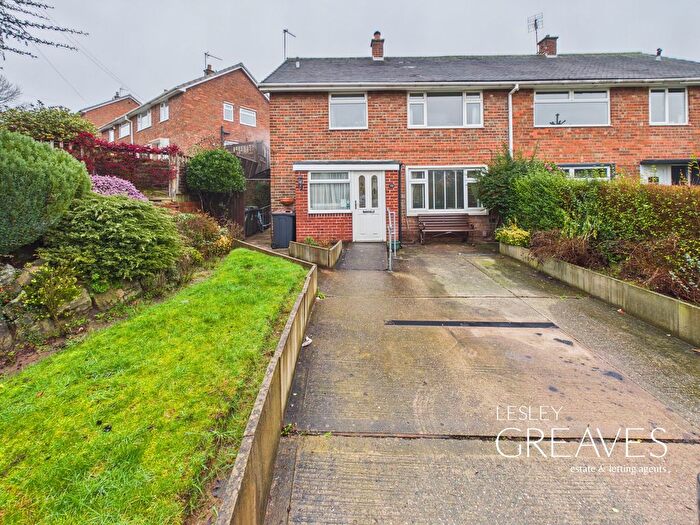
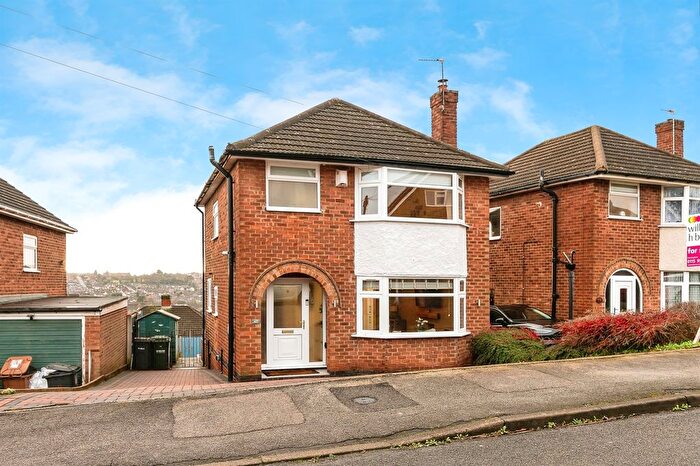
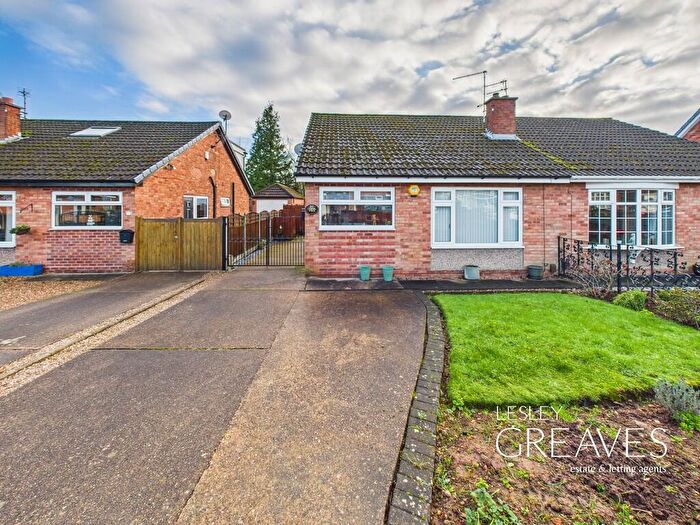
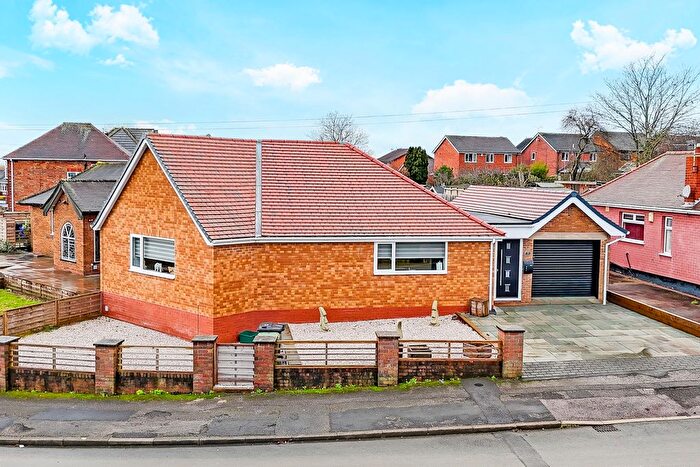
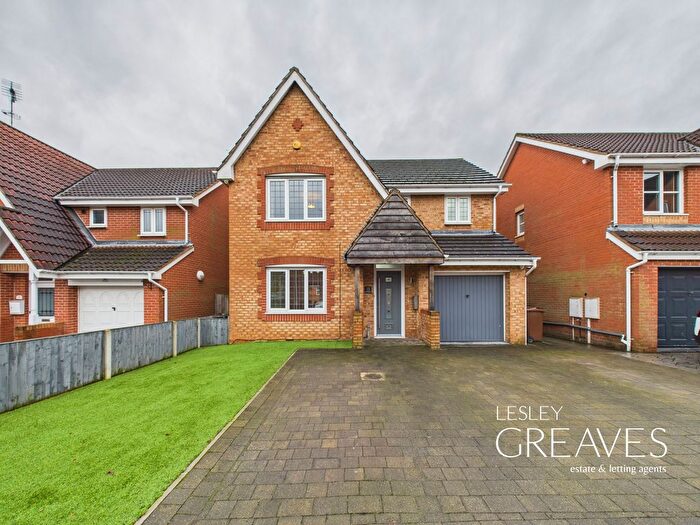
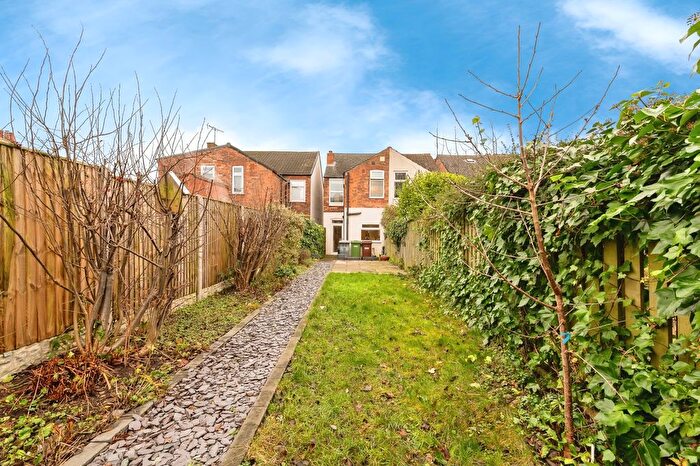
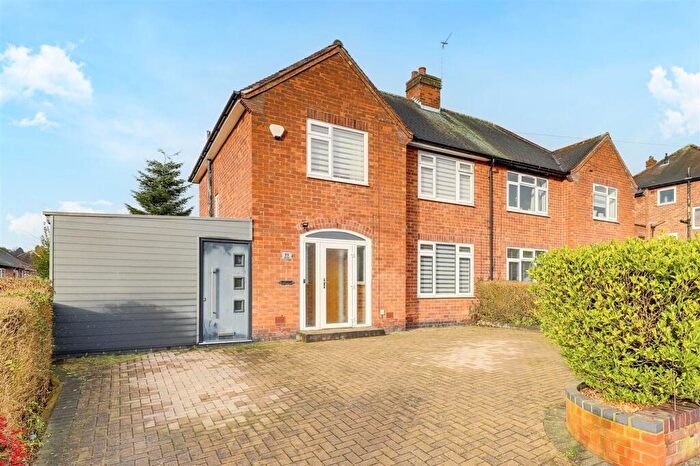
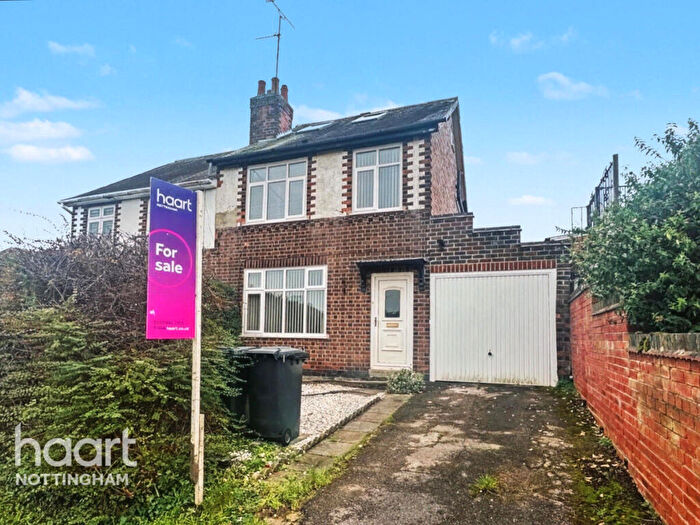
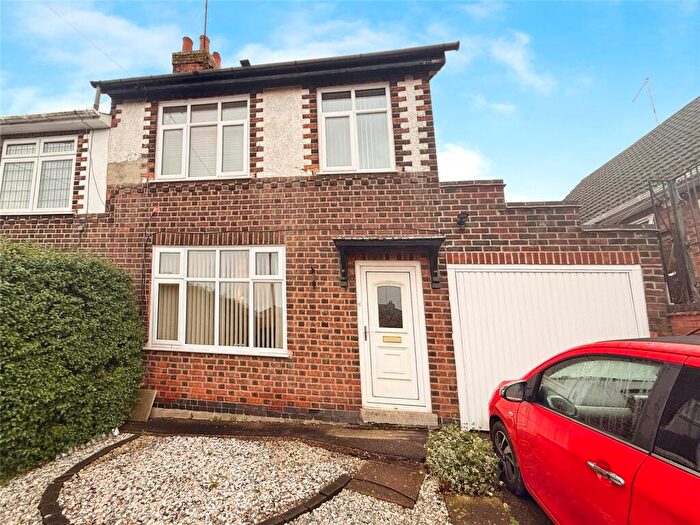
Houses for sale & to rent in Valley, Nottingham
House Prices in Valley
Properties in Valley have an average house price of £222,659.00 and had 143 Property Transactions within the last 3 years¹.
Valley is an area in Nottingham, Nottinghamshire with 1,775 households², where the most expensive property was sold for £600,000.00.
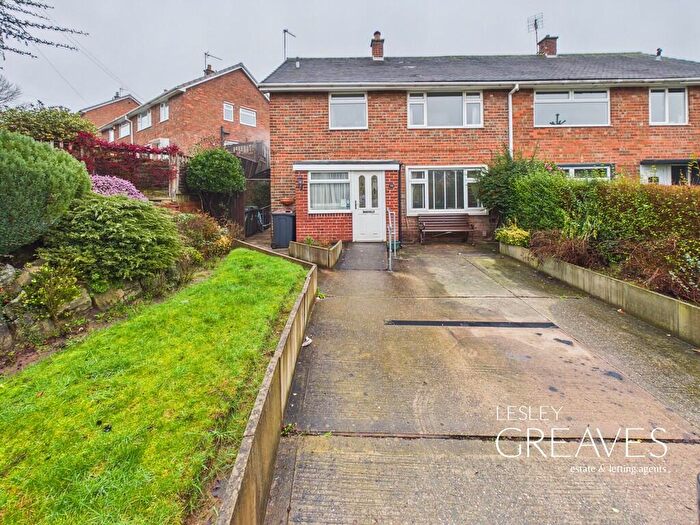
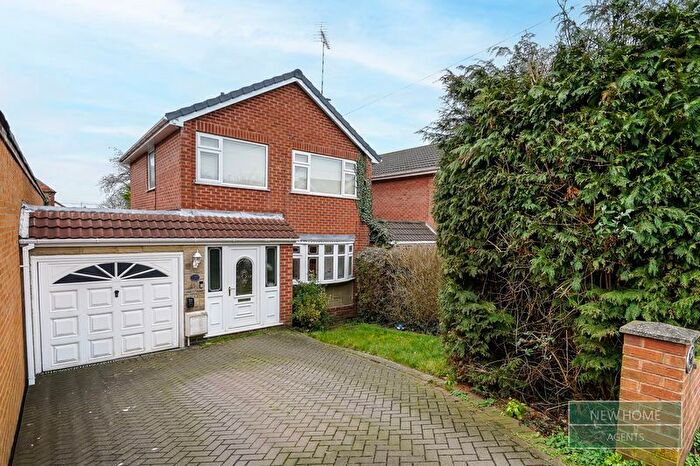
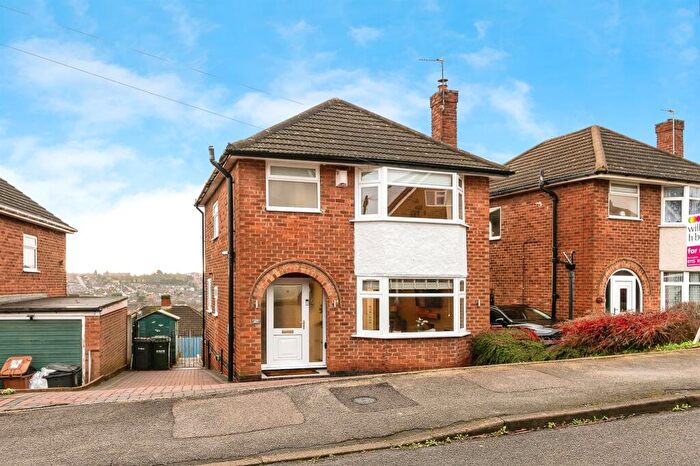
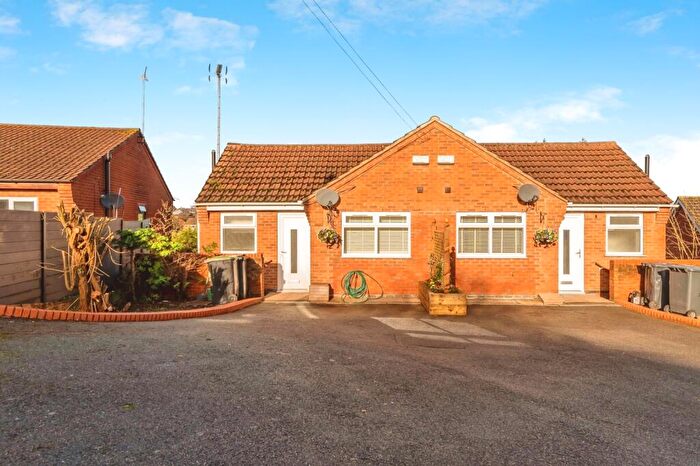
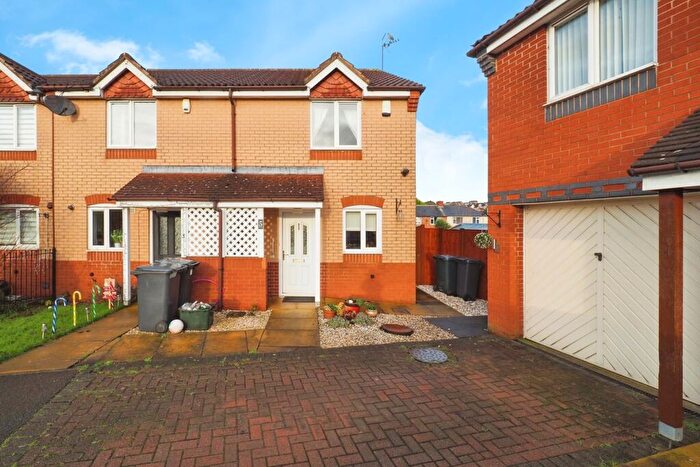
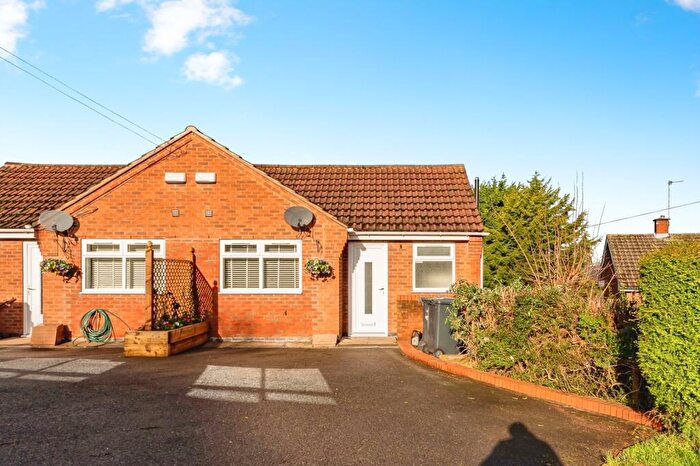
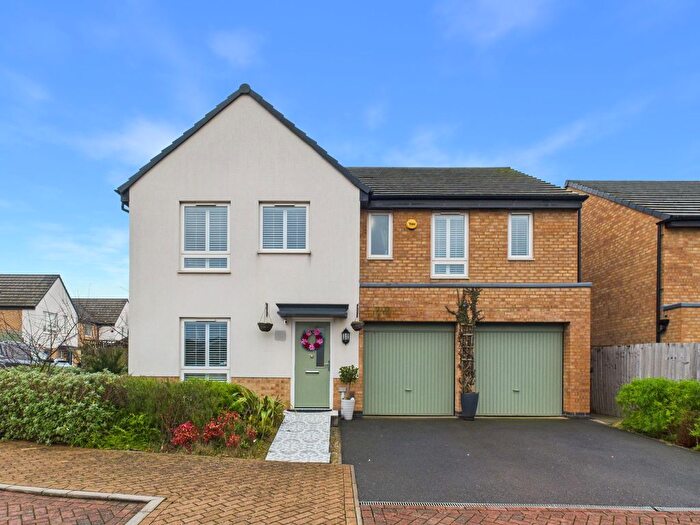
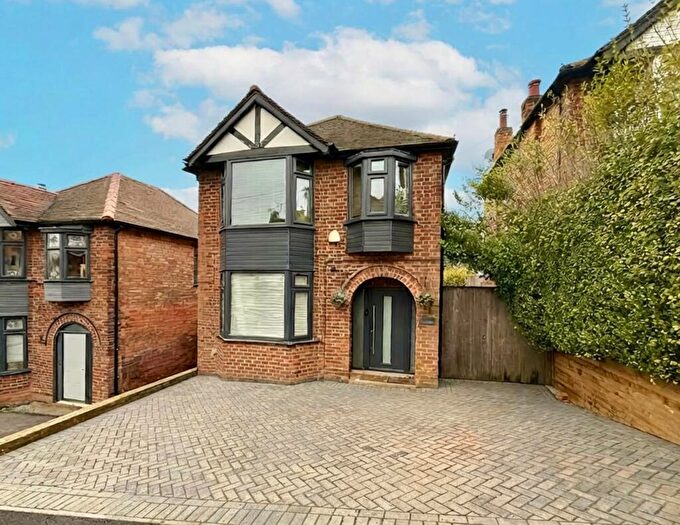
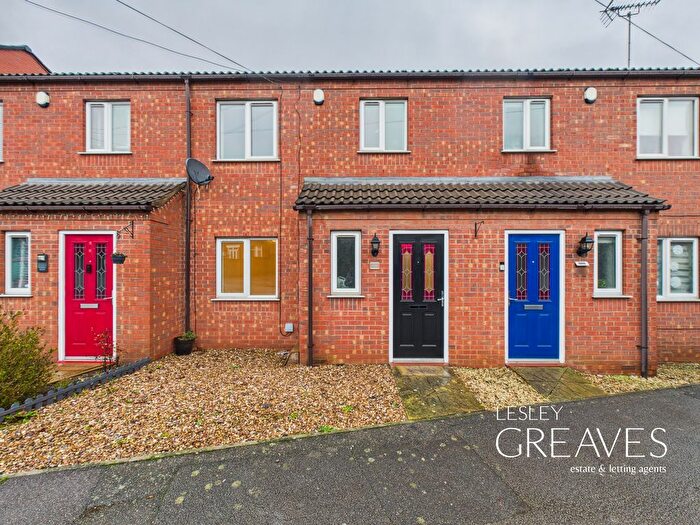
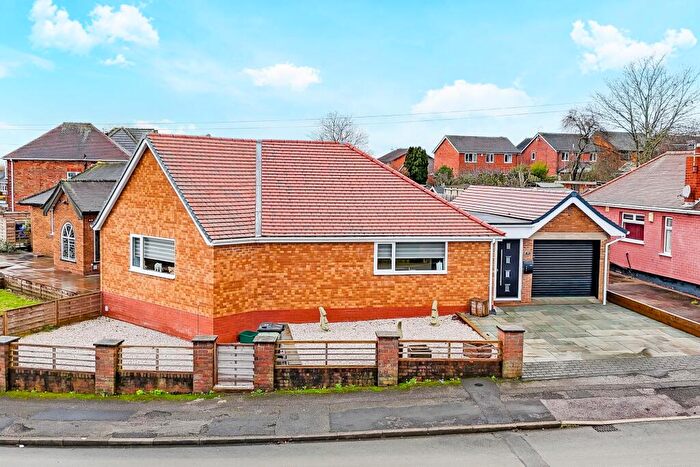
Properties for sale in Valley
Roads and Postcodes in Valley
Navigate through our locations to find the location of your next house in Valley, Nottingham for sale or to rent.
| Streets | Postcodes |
|---|---|
| Allwood Drive | NG4 3EH |
| Alpine Crescent | NG4 3RX |
| Beck Street | NG4 1RU |
| Belper Avenue | NG4 3SD NG4 3SE |
| Bentinck Road | NG4 3QB NG4 3QD |
| Burton Road | NG4 3DQ NG4 3DT |
| Buxton Avenue | NG4 3RR NG4 3RS |
| Carlile Road | NG4 3DW |
| Carlton Vale Close | NG4 3RP |
| Carnarvon Grove | NG4 1RN NG4 1RP |
| Cavendish Drive | NG4 3DX |
| Cavendish Road | NG4 3DZ NG4 3EB NG4 3ED NG4 3EE NG4 3EF NG4 3PS NG4 3QF NG4 3RT NG4 3RY NG4 3SA |
| Coningswath Road | NG4 3SF NG4 3SG NG4 3SH NG4 3SJ |
| Cromford Avenue | NG4 3RU |
| Deep Furrow Avenue | NG4 1RS |
| Fairway Drive | NG4 1SJ |
| Foxhill Road | NG4 1RR NG4 1RT NG4 1SF |
| Francis Road | NG4 3DS |
| Fraser Road | NG4 1NH NG4 1NJ |
| Fraser Square | NG4 1NN |
| Garden City | NG4 3EA |
| Glebe Road | NG4 3PY |
| Green Approach | NG4 1SN |
| Highgate Close | NG4 3PP |
| Huckerbys Field | NG4 3SN |
| Ian Grove | NG4 3EG |
| Kenia Close | NG4 1SA |
| Marwood Crescent | NG4 3PW |
| Marwood Road | NG4 3PU NG4 3PX |
| Millbrook Drive | NG4 3SR |
| Nursery Drive | NG4 3RZ |
| Park Avenue | NG4 3DP |
| Pitch Close | NG4 1SL |
| Portland Road | NG4 3PZ NG4 3QA NG4 3QE |
| Radcliffe Gardens | NG4 1SB |
| Redland Avenue | NG4 3EW |
| Redland Grove | NG4 3ET NG4 3EU |
| Rushcliffe Avenue | NG4 1RQ |
| Slalom Run | NG4 1LH |
| The Green | NG4 1SP |
| Valley Road | NG4 1LS NG4 1LT NG4 1NG |
| Winster Avenue | NG4 3RW |
| Worth Street | NG4 1RX |
Transport near Valley
-
Carlton Station
-
Netherfield Station
-
Burton Joyce Station
-
Nottingham Station
-
Radcliffe (Nottinghamshire) Station
- FAQ
- Price Paid By Year
- Property Type Price
Frequently asked questions about Valley
What is the average price for a property for sale in Valley?
The average price for a property for sale in Valley is £222,659. This amount is 21% lower than the average price in Nottingham. There are 2,397 property listings for sale in Valley.
What streets have the most expensive properties for sale in Valley?
The streets with the most expensive properties for sale in Valley are Nursery Drive at an average of £410,000, Pitch Close at an average of £405,500 and Buxton Avenue at an average of £272,300.
What streets have the most affordable properties for sale in Valley?
The streets with the most affordable properties for sale in Valley are Foxhill Road at an average of £138,632, Garden City at an average of £155,000 and Ian Grove at an average of £175,000.
Which train stations are available in or near Valley?
Some of the train stations available in or near Valley are Carlton, Netherfield and Burton Joyce.
Property Price Paid in Valley by Year
The average sold property price by year was:
| Year | Average Sold Price | Price Change |
Sold Properties
|
|---|---|---|---|
| 2025 | £228,720 | 4% |
40 Properties |
| 2024 | £220,704 | 0,4% |
51 Properties |
| 2023 | £219,915 | 6% |
52 Properties |
| 2022 | £206,088 | 6% |
68 Properties |
| 2021 | £192,708 | 9% |
78 Properties |
| 2020 | £175,548 | 10% |
63 Properties |
| 2019 | £158,543 | 4% |
81 Properties |
| 2018 | £152,372 | -2% |
63 Properties |
| 2017 | £155,274 | 7% |
49 Properties |
| 2016 | £144,736 | 15% |
57 Properties |
| 2015 | £123,528 | -8% |
59 Properties |
| 2014 | £133,611 | 7% |
63 Properties |
| 2013 | £124,290 | 4% |
59 Properties |
| 2012 | £118,738 | -6% |
43 Properties |
| 2011 | £126,351 | 6% |
46 Properties |
| 2010 | £119,288 | -3% |
35 Properties |
| 2009 | £122,772 | 8% |
35 Properties |
| 2008 | £112,627 | -15% |
47 Properties |
| 2007 | £128,973 | 3% |
82 Properties |
| 2006 | £125,092 | -6% |
96 Properties |
| 2005 | £132,596 | 6% |
63 Properties |
| 2004 | £125,168 | 2% |
83 Properties |
| 2003 | £122,330 | 19% |
115 Properties |
| 2002 | £99,586 | 32% |
137 Properties |
| 2001 | £67,312 | 12% |
92 Properties |
| 2000 | £59,063 | 6% |
95 Properties |
| 1999 | £55,349 | 5% |
79 Properties |
| 1998 | £52,830 | 5% |
58 Properties |
| 1997 | £50,000 | 11% |
80 Properties |
| 1996 | £44,653 | 6% |
60 Properties |
| 1995 | £41,790 | - |
36 Properties |
Property Price per Property Type in Valley
Here you can find historic sold price data in order to help with your property search.
The average Property Paid Price for specific property types in the last three years are:
| Property Type | Average Sold Price | Sold Properties |
|---|---|---|
| Semi Detached House | £217,751.00 | 69 Semi Detached Houses |
| Detached House | £294,925.00 | 38 Detached Houses |
| Terraced House | £165,613.00 | 29 Terraced Houses |
| Flat | £115,075.00 | 7 Flats |

