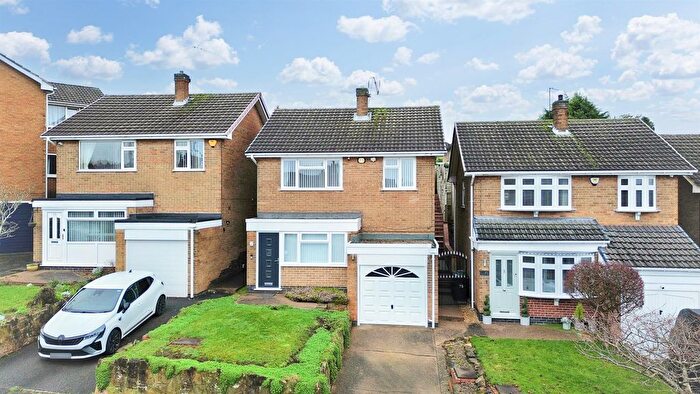
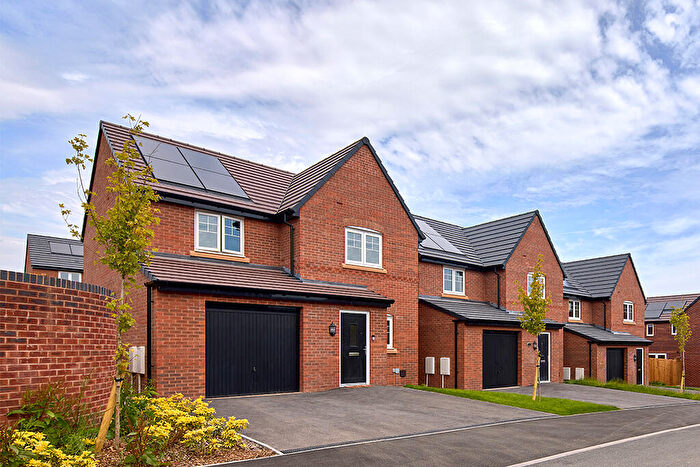
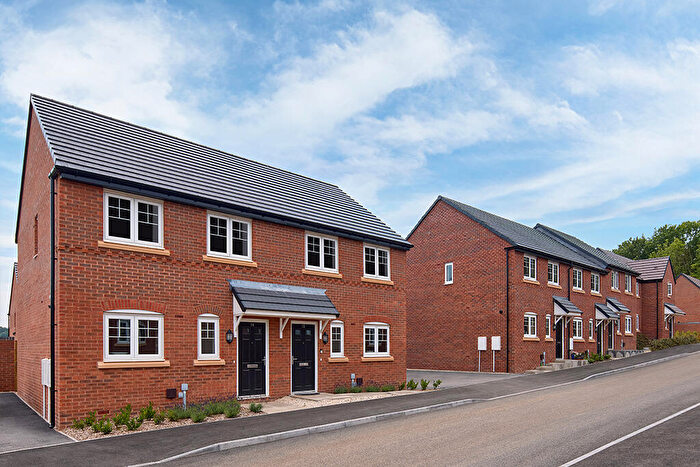
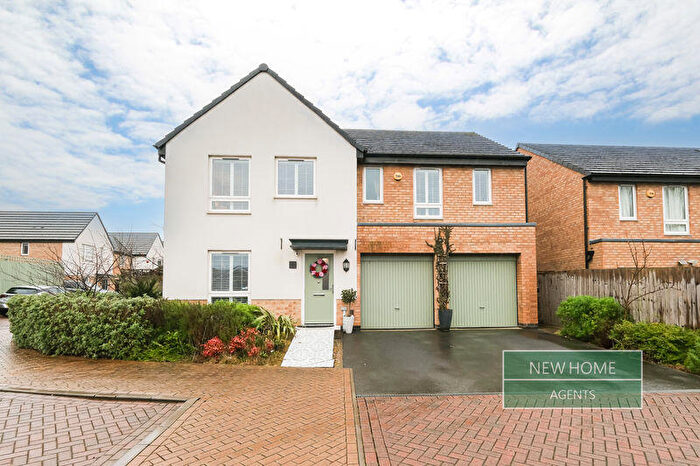
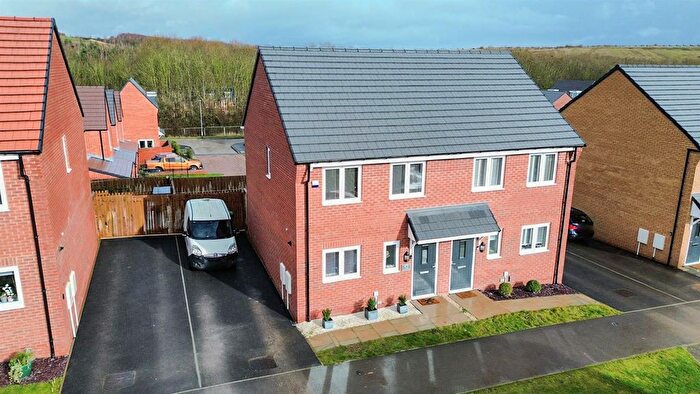
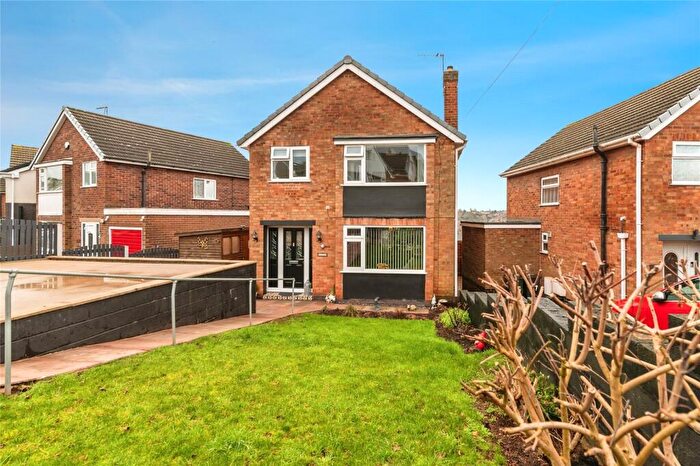
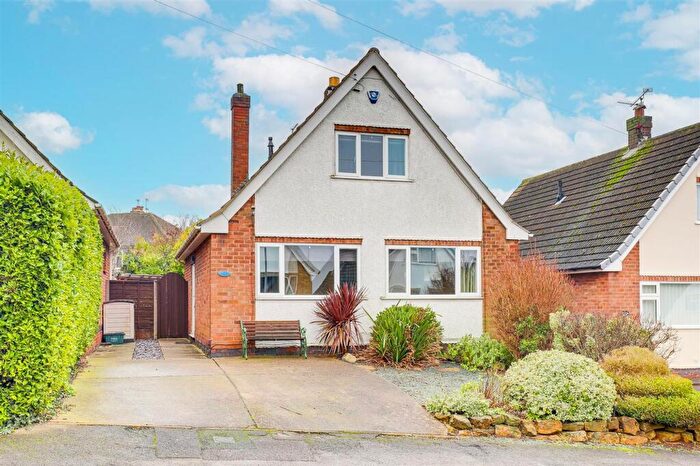
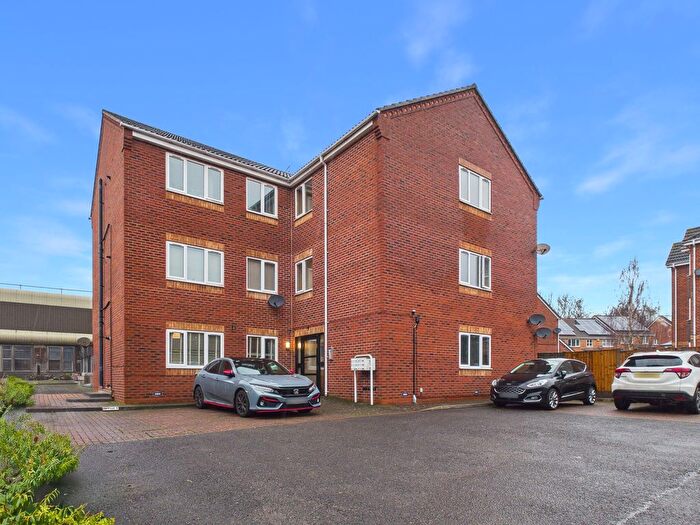
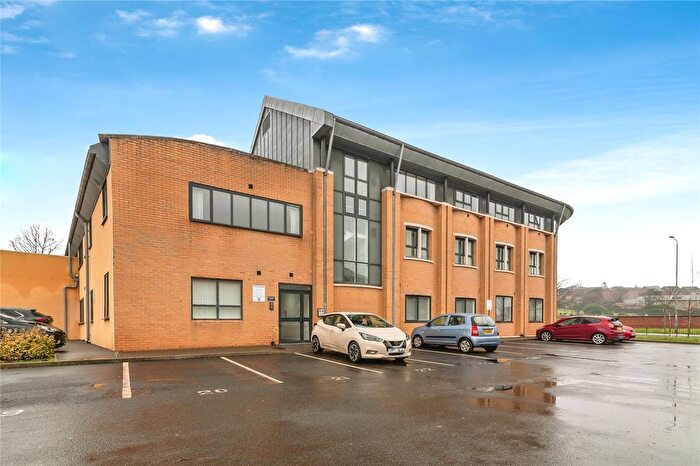
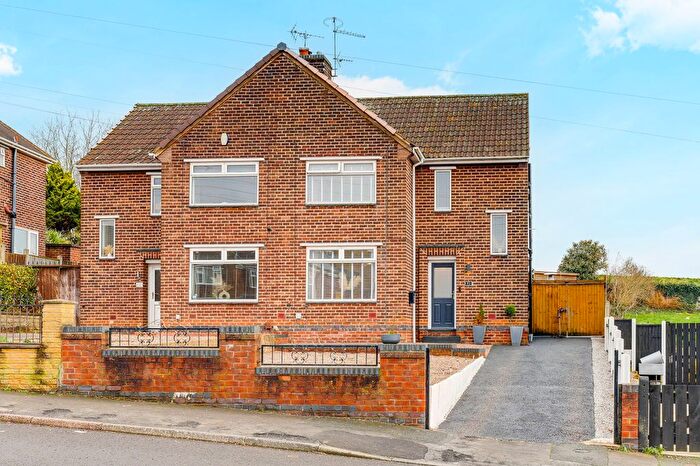
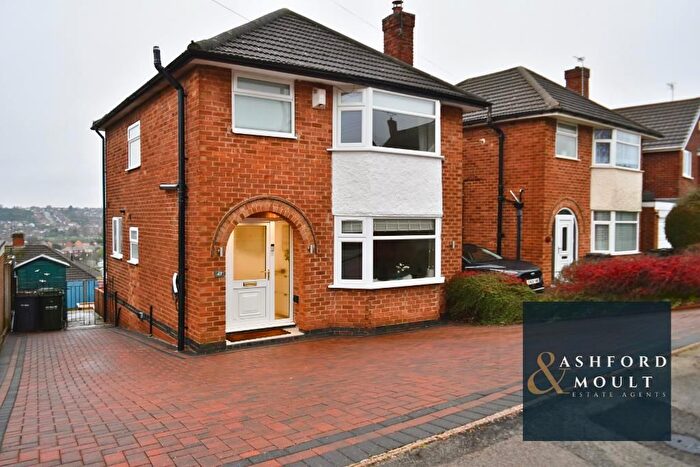
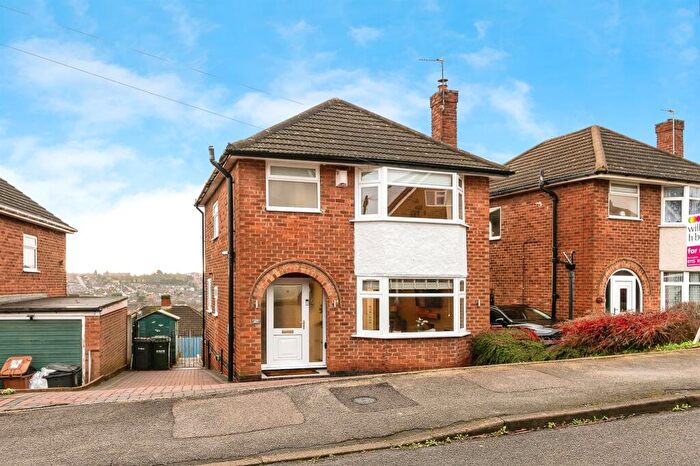
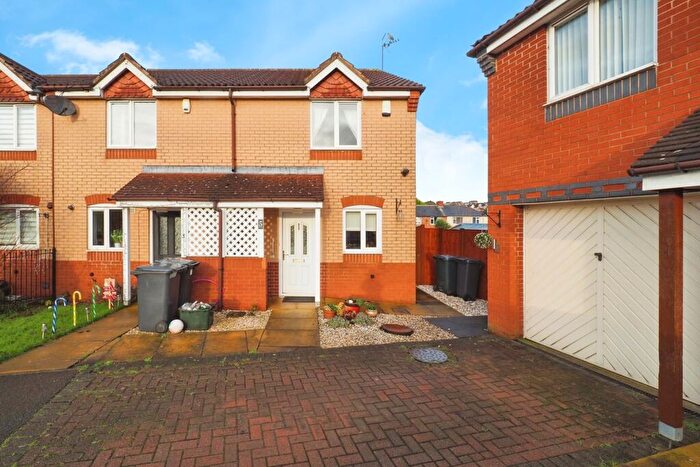
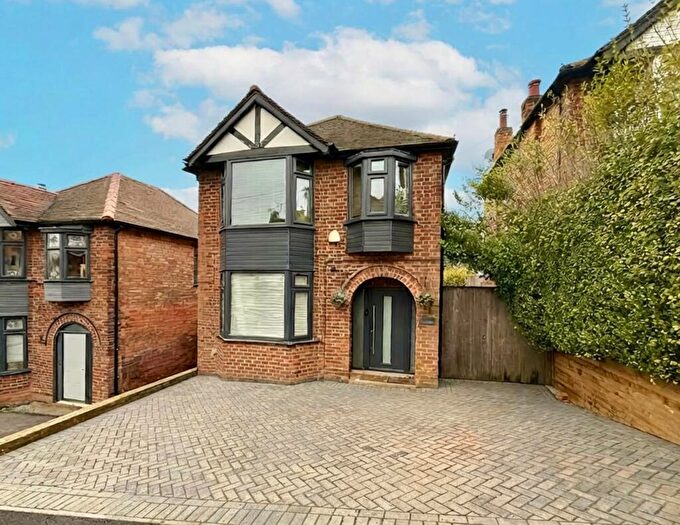
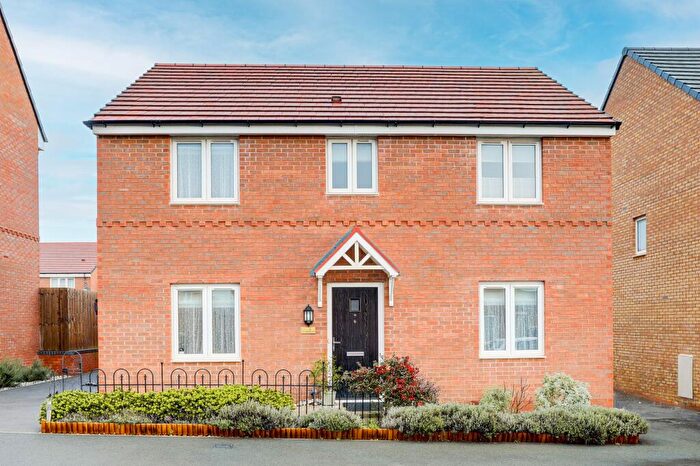
Houses for sale & to rent in St James, Nottingham
House Prices in St James
Properties in St James have an average house price of £235,197.00 and had 192 Property Transactions within the last 3 years¹.
St James is an area in Nottingham, Nottinghamshire with 1,807 households², where the most expensive property was sold for £457,000.00.
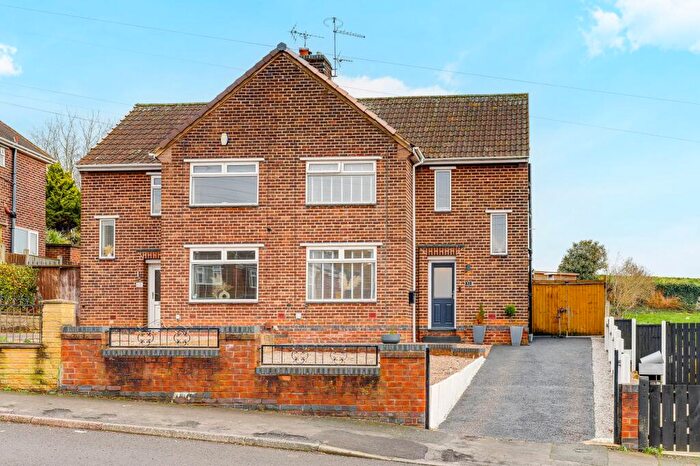
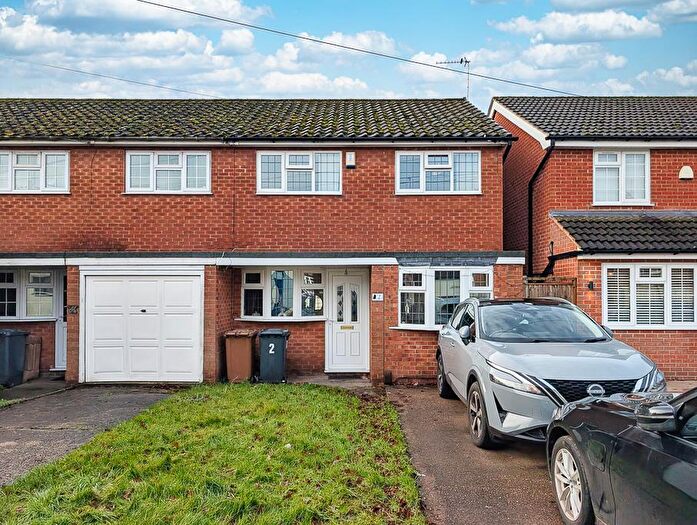
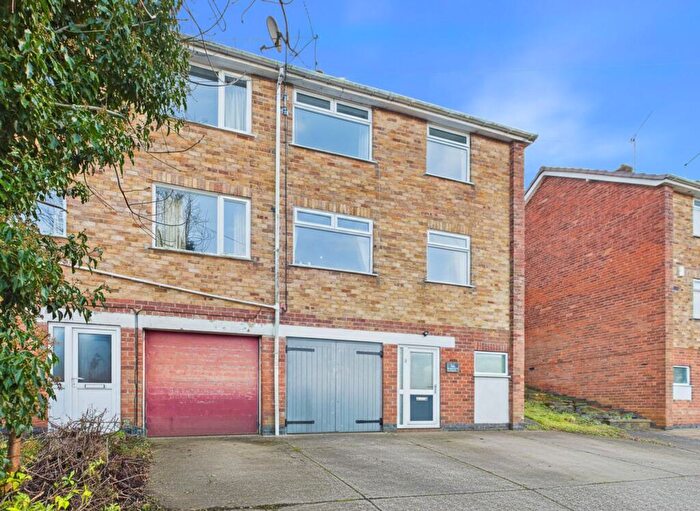
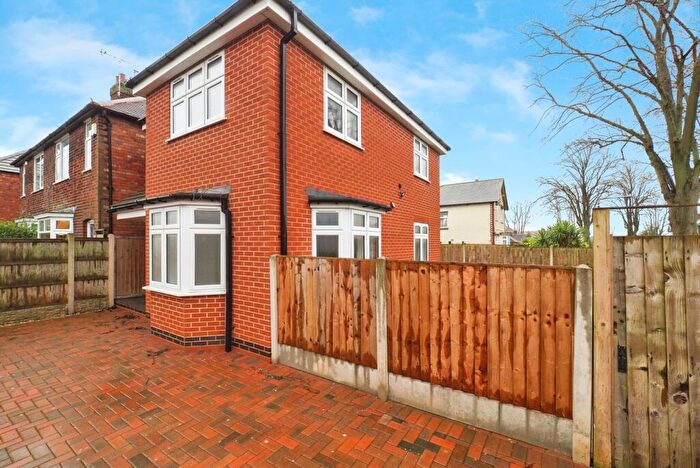
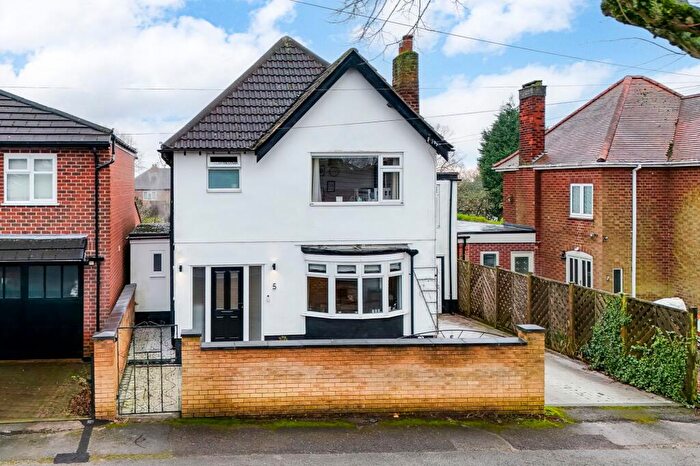
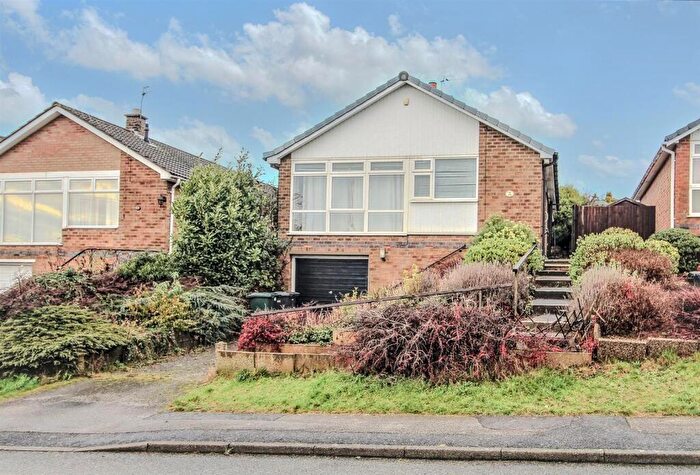
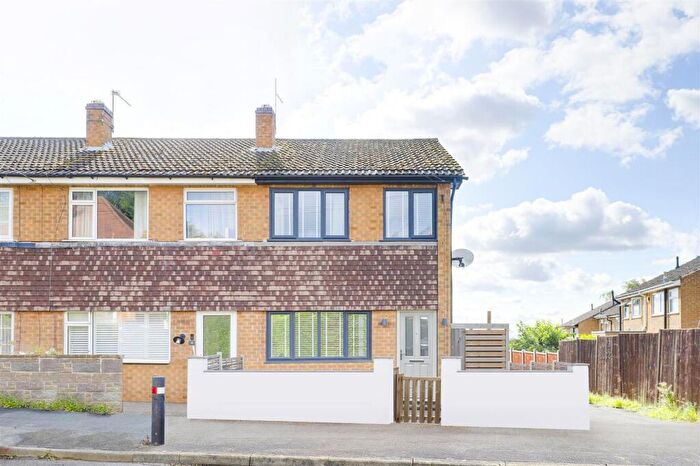
Properties for sale in St James
Roads and Postcodes in St James
Navigate through our locations to find the location of your next house in St James, Nottingham for sale or to rent.
| Streets | Postcodes |
|---|---|
| Arnold Lane | NG4 4HF |
| Bayliss Road | NG4 4JE |
| Beckett Court | NG4 4GS |
| Bracken Close | NG4 3QJ |
| Cator Close | NG4 4HS |
| Cavendish Avenue | NG4 4FZ |
| Cavendish Road | NG4 3PR NG4 3QG NG4 3SB |
| Chesterfield Avenue | NG4 4GD NG4 4GE |
| Chesterfield Court | NG4 4GR |
| Cookson Avenue | NG4 4GA |
| County Road | NG4 4JL NG4 4JN |
| Digby Avenue | NG3 6DT NG3 6DY |
| Digby Hall Drive | NG4 4JT |
| Eastcliffe Avenue | NG4 4HG |
| Featherstone Close | NG4 4JA |
| Freda Avenue | NG4 4FY NG4 4GQ |
| Freda Close | NG4 4GP |
| Glendale Close | NG4 4FD |
| Grassingdale Close | NG4 4FE |
| Gunthorpe Road | NG4 4JF NG4 4JR |
| Haddon Close | NG4 4GT |
| Heather Road | NG4 3QZ |
| High Hazles Close | NG4 4JX |
| Holyoake Road | NG3 6DX |
| Keyworth Road | NG4 4JD |
| Kneeton Close | NG4 4GX |
| Lascelles Avenue | NG4 4GB |
| Lavender Crescent | NG4 3QY |
| Linsdale Gardens | NG4 4GY |
| Lowdham Road | NG4 4JP |
| Mcintosh Road | NG4 4HR |
| Newton Road | NG4 4HL |
| Orchard Court | NG4 4FF |
| Rufford Avenue | NG4 4FS |
| Rutland Road | NG4 4HT NG4 4JQ |
| Salamander Close | NG4 4FJ |
| Shelford Road | NG4 4HH NG4 4HU NG4 4HW NG4 4JB NG4 4JG NG4 4JH NG4 4JJ NG4 4JS |
| Southview Road | NG4 3QL NG4 3QN NG4 3QT NG4 3QU NG4 3QW NG4 3QX |
| Stanhope Road | NG4 4HN NG4 4HP |
| The Fairway | NG4 4EZ |
| Thoresby Avenue | NG4 4FQ |
| Unity Crescent | NG3 6DZ |
| Veronica Drive | NG4 3QS |
| Violet Road | NG4 3QP NG4 3QQ NG4 3QR |
| Welbeck Avenue | NG4 4FR |
| Westcliffe Avenue | NG4 4HQ |
| Westdale Court | NG4 4FH |
| Westdale Lane | NG3 6EU NG4 4FG NG4 4FL NG4 4FT NG4 4FU NG4 4FW NG4 4FX |
| Wollaton Avenue | NG4 4HX |
Transport near St James
- FAQ
- Price Paid By Year
- Property Type Price
Frequently asked questions about St James
What is the average price for a property for sale in St James?
The average price for a property for sale in St James is £235,197. This amount is 17% lower than the average price in Nottingham. There are 2,080 property listings for sale in St James.
What streets have the most expensive properties for sale in St James?
The streets with the most expensive properties for sale in St James are Linsdale Gardens at an average of £304,666, Glendale Close at an average of £302,800 and Cavendish Avenue at an average of £284,075.
What streets have the most affordable properties for sale in St James?
The streets with the most affordable properties for sale in St James are Chesterfield Court at an average of £91,750, Beckett Court at an average of £100,000 and Westdale Court at an average of £108,000.
Which train stations are available in or near St James?
Some of the train stations available in or near St James are Carlton, Netherfield and Burton Joyce.
Property Price Paid in St James by Year
The average sold property price by year was:
| Year | Average Sold Price | Price Change |
Sold Properties
|
|---|---|---|---|
| 2025 | £238,594 | 2% |
57 Properties |
| 2024 | £233,000 | -1% |
63 Properties |
| 2023 | £234,430 | 7% |
72 Properties |
| 2022 | £218,940 | 8% |
72 Properties |
| 2021 | £201,194 | 7% |
92 Properties |
| 2020 | £187,210 | 1% |
71 Properties |
| 2019 | £184,783 | 5% |
69 Properties |
| 2018 | £175,889 | 12% |
75 Properties |
| 2017 | £154,629 | 9% |
80 Properties |
| 2016 | £140,028 | 2% |
84 Properties |
| 2015 | £137,720 | 0,1% |
61 Properties |
| 2014 | £137,517 | 7% |
75 Properties |
| 2013 | £128,320 | 4% |
39 Properties |
| 2012 | £123,788 | -6% |
46 Properties |
| 2011 | £130,922 | 8% |
54 Properties |
| 2010 | £120,757 | -5% |
31 Properties |
| 2009 | £127,367 | -5% |
31 Properties |
| 2008 | £134,325 | -0,2% |
42 Properties |
| 2007 | £134,551 | 0,2% |
68 Properties |
| 2006 | £134,346 | -4% |
68 Properties |
| 2005 | £139,646 | 7% |
63 Properties |
| 2004 | £129,852 | 15% |
72 Properties |
| 2003 | £110,975 | 22% |
73 Properties |
| 2002 | £86,726 | 19% |
90 Properties |
| 2001 | £70,346 | 7% |
89 Properties |
| 2000 | £65,628 | 13% |
87 Properties |
| 1999 | £56,813 | 9% |
86 Properties |
| 1998 | £51,930 | -1% |
82 Properties |
| 1997 | £52,346 | 6% |
79 Properties |
| 1996 | £49,047 | -2% |
70 Properties |
| 1995 | £50,004 | - |
74 Properties |
Property Price per Property Type in St James
Here you can find historic sold price data in order to help with your property search.
The average Property Paid Price for specific property types in the last three years are:
| Property Type | Average Sold Price | Sold Properties |
|---|---|---|
| Semi Detached House | £226,423.00 | 80 Semi Detached Houses |
| Detached House | £270,211.00 | 82 Detached Houses |
| Terraced House | £191,044.00 | 17 Terraced Houses |
| Flat | £126,069.00 | 13 Flats |

