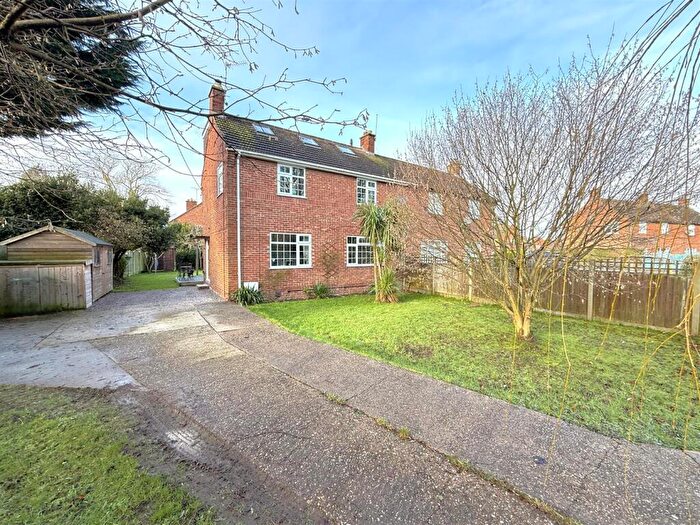
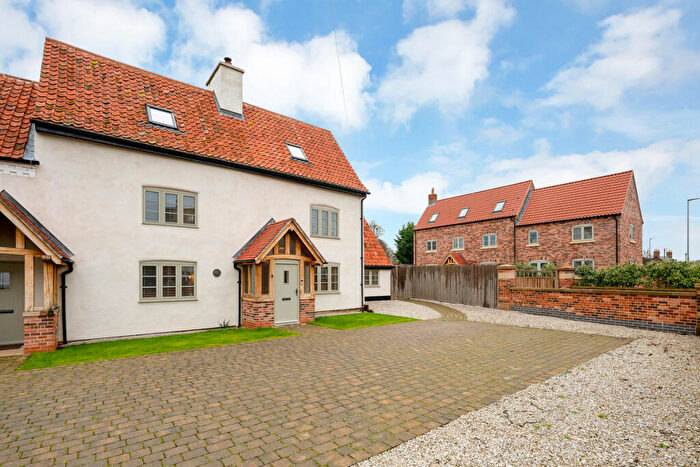
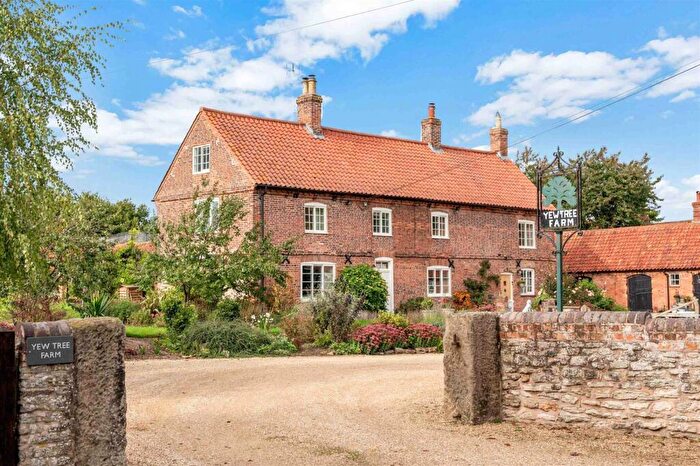
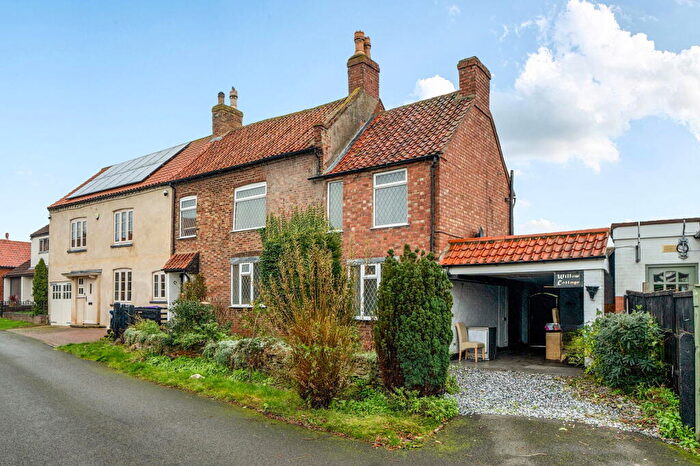
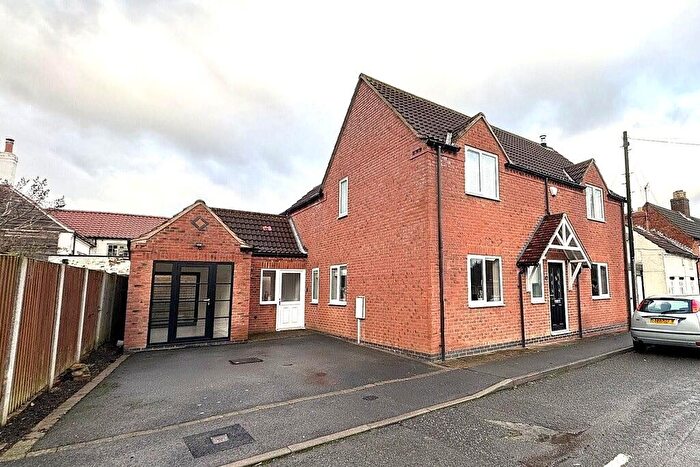
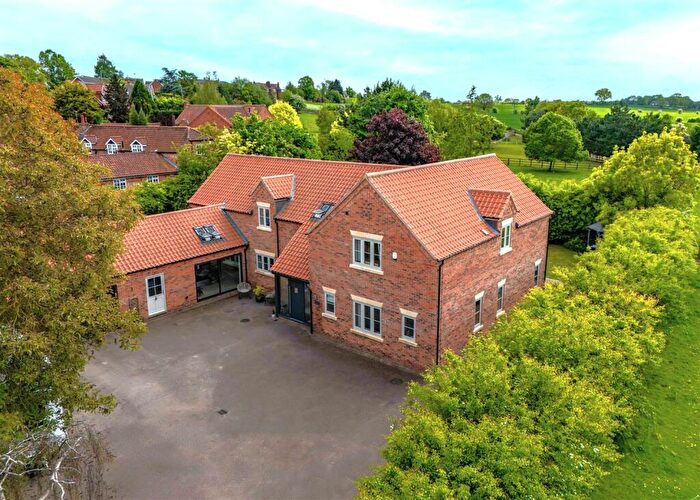
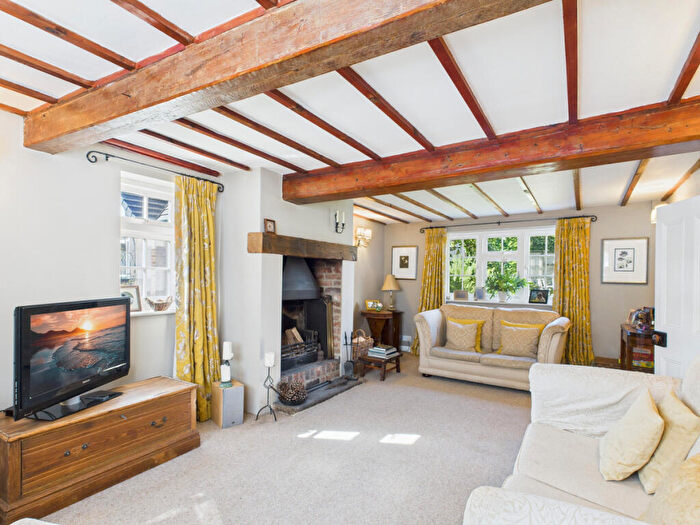
Houses for sale & to rent in Thoroton, Nottingham
House Prices in Thoroton
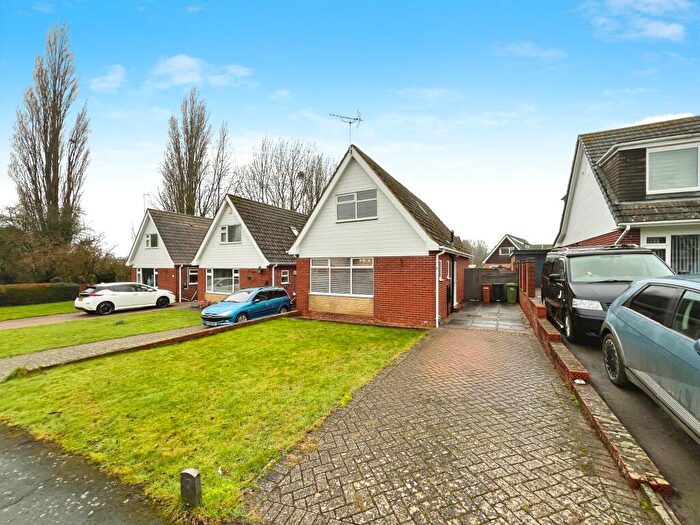
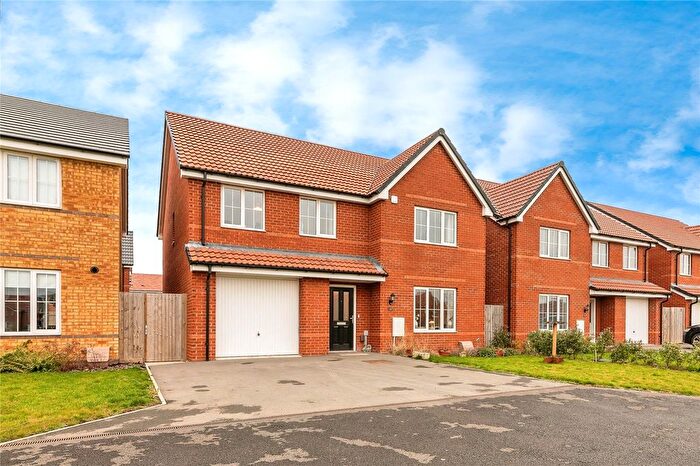
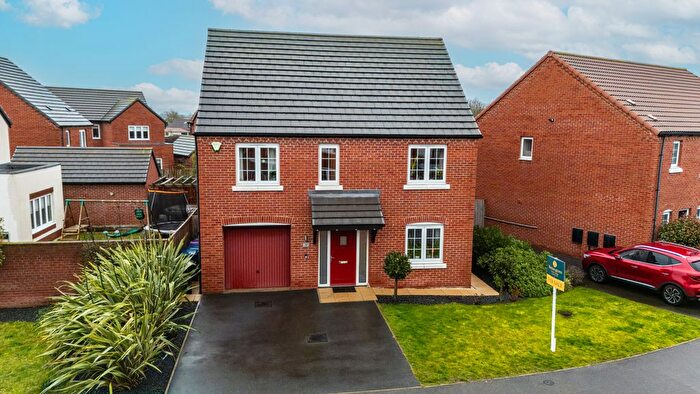
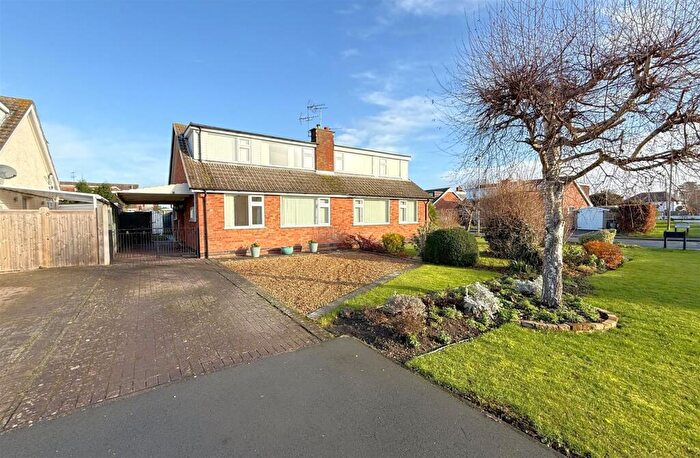
Properties in Thoroton have an average house price of £486,680.00 and had 30 Property Transactions within the last 3 years¹.
Thoroton is an area in Nottingham, Nottinghamshire with 507 households², where the most expensive property was sold for £975,000.00.
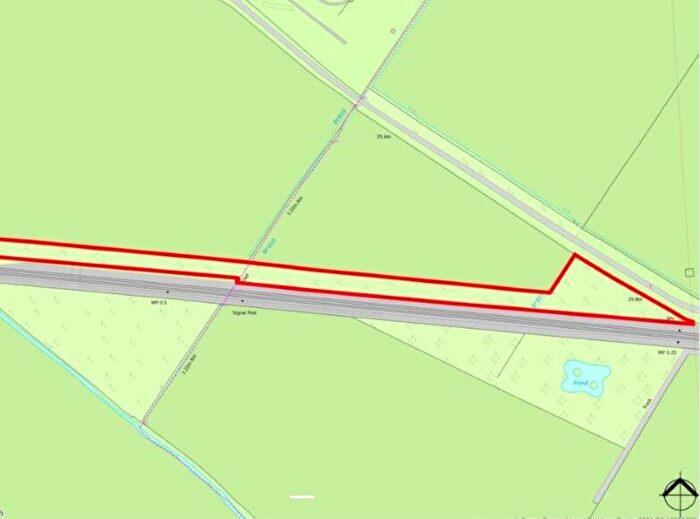
Properties for sale in Thoroton
Roads and Postcodes in Thoroton
Navigate through our locations to find the location of your next house in Thoroton, Nottingham for sale or to rent.
| Streets | Postcodes |
|---|---|
| Barnstone Road | NG13 9PP |
| Bingham Road | NG13 9QE |
| Bottesford Lane | NG13 9NX |
| Bottesford Road | NG13 0AW |
| Chapel Garth | NG13 9NY |
| Chapel Lane | NG13 9PW |
| Chapel Street | NG13 9NL NG13 9NR |
| Church Street | NG13 9NS NG13 9PU NG13 9NW |
| Dragon Street | NG13 9PN |
| Green Lane | NG13 9PR |
| Hawksworth Road | NG13 9BU |
| High Street | NG13 9NU |
| Hill Road | NG13 9ND |
| Hill Top | NG13 9PG |
| Langar Road | NG13 9GH |
| Launder Street | NG13 9NT |
| Lombard Street | NG13 9NF |
| Longhedge Lane | NG13 9NQ NG13 9PL |
| Lordship Lane | NG13 9NA |
| Loughbon | NG13 9NH NG13 9NJ |
| Main Road | NG13 9DA NG13 9DD NG13 9LB NG13 9LD |
| Main Street | NG13 9PQ |
| Maule Court | NG13 9NP |
| Mill Lane | NG13 9NE |
| New Road | NG13 9DE |
| Occupation Road | NG13 9LH |
| Old Forge Lane | NG13 9PS |
| Plungar Road | NG13 9PX |
| Redmile Lane | NG13 9FA NG13 9LJ |
| Scarrington Road | NG13 9DH |
| Smite Lane | NG13 9DU |
| Station Road | NG13 9LF NG13 9LG NG13 9NB |
| Sutton Lane | NG13 9LA NG13 9PY |
| The Green | NG13 9NZ |
| The Row | NG13 9LE NG13 9NG |
| The Walk | NG13 9NN |
| Thoroton Road | NG13 9DT |
| Town Street | NG13 9DB |
| Willow Close | NG13 9PZ |
| NG13 9DS NG13 9PA NG13 9QA NG13 9DF NG13 9DR NG13 9JT |
Transport near Thoroton
- FAQ
- Price Paid By Year
- Property Type Price
Frequently asked questions about Thoroton
What is the average price for a property for sale in Thoroton?
The average price for a property for sale in Thoroton is £486,680. This amount is 72% higher than the average price in Nottingham. There are 618 property listings for sale in Thoroton.
What streets have the most expensive properties for sale in Thoroton?
The streets with the most expensive properties for sale in Thoroton are The Row at an average of £601,833, Sutton Lane at an average of £543,125 and Maule Court at an average of £540,000.
What streets have the most affordable properties for sale in Thoroton?
The streets with the most affordable properties for sale in Thoroton are Chapel Street at an average of £212,000, High Street at an average of £312,500 and Main Road at an average of £340,000.
Which train stations are available in or near Thoroton?
Some of the train stations available in or near Thoroton are Elton and Orston, Aslockton and Bottesford.
Property Price Paid in Thoroton by Year
The average sold property price by year was:
| Year | Average Sold Price | Price Change |
Sold Properties
|
|---|---|---|---|
| 2025 | £512,272 | 10% |
11 Properties |
| 2024 | £463,191 | -4% |
10 Properties |
| 2023 | £481,500 | -15% |
9 Properties |
| 2022 | £553,125 | 7% |
16 Properties |
| 2021 | £515,350 | -3% |
40 Properties |
| 2020 | £531,264 | 8% |
17 Properties |
| 2019 | £489,094 | 19% |
12 Properties |
| 2018 | £397,923 | -20% |
13 Properties |
| 2017 | £477,471 | 2% |
21 Properties |
| 2016 | £467,288 | 19% |
26 Properties |
| 2015 | £377,246 | 10% |
16 Properties |
| 2014 | £339,140 | -6% |
21 Properties |
| 2013 | £360,346 | 2% |
13 Properties |
| 2012 | £353,535 | -6% |
14 Properties |
| 2011 | £373,981 | 20% |
16 Properties |
| 2010 | £298,533 | -36% |
15 Properties |
| 2009 | £406,153 | 19% |
13 Properties |
| 2008 | £327,875 | -9% |
22 Properties |
| 2007 | £357,498 | 13% |
21 Properties |
| 2006 | £312,713 | 5% |
22 Properties |
| 2005 | £298,447 | 1% |
19 Properties |
| 2004 | £296,098 | 4% |
25 Properties |
| 2003 | £284,841 | 15% |
23 Properties |
| 2002 | £241,516 | 11% |
24 Properties |
| 2001 | £214,765 | 25% |
21 Properties |
| 2000 | £160,489 | 22% |
29 Properties |
| 1999 | £124,922 | -26% |
27 Properties |
| 1998 | £157,655 | 16% |
17 Properties |
| 1997 | £132,814 | 4% |
25 Properties |
| 1996 | £127,795 | 32% |
22 Properties |
| 1995 | £87,237 | - |
18 Properties |
Property Price per Property Type in Thoroton
Here you can find historic sold price data in order to help with your property search.
The average Property Paid Price for specific property types in the last three years are:
| Property Type | Average Sold Price | Sold Properties |
|---|---|---|
| Semi Detached House | £442,500.00 | 4 Semi Detached Houses |
| Detached House | £526,973.00 | 22 Detached Houses |
| Terraced House | £309,250.00 | 4 Terraced Houses |

