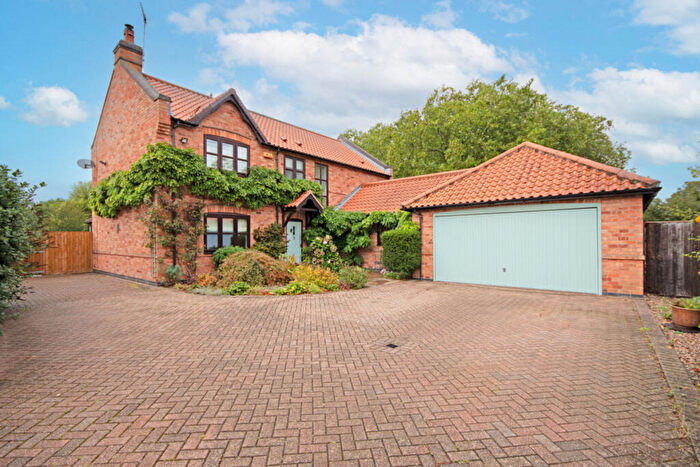
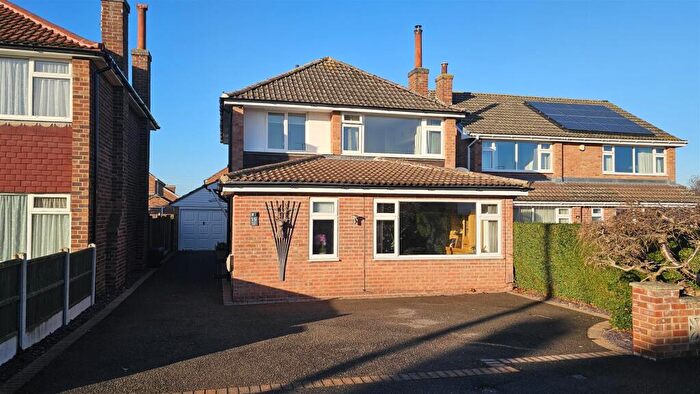
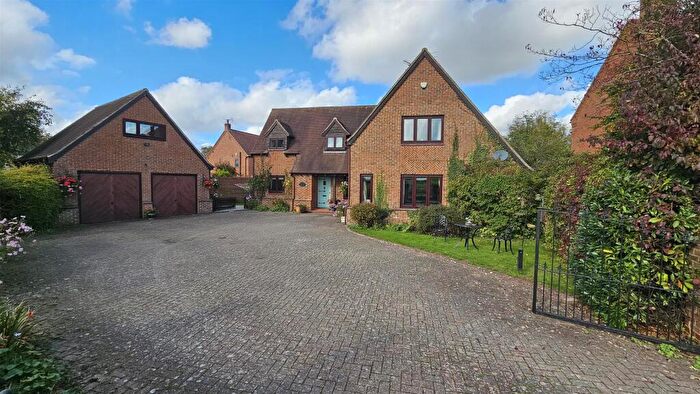
Houses for sale & to rent in Cranmer, Nottingham
House Prices in Cranmer
Properties in Cranmer have an average house price of £371,846.00 and had 91 Property Transactions within the last 3 years¹.
Cranmer is an area in Nottingham, Nottinghamshire with 841 households², where the most expensive property was sold for £1,500,000.00.
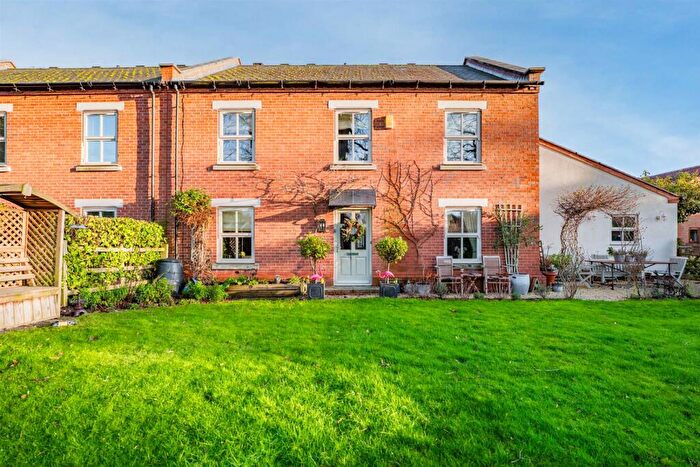
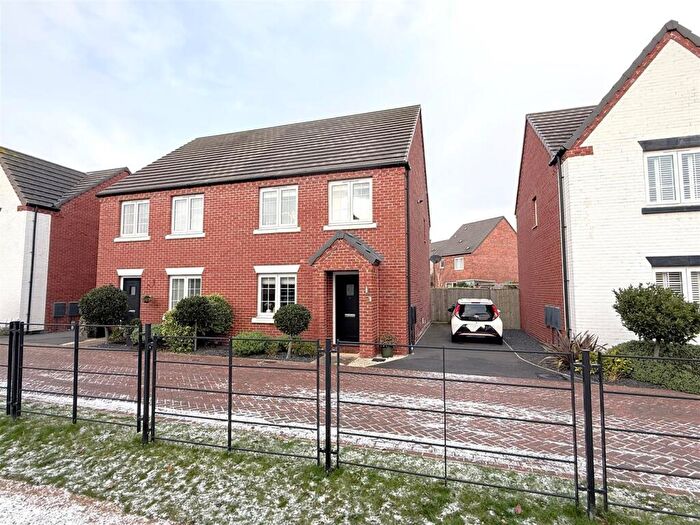
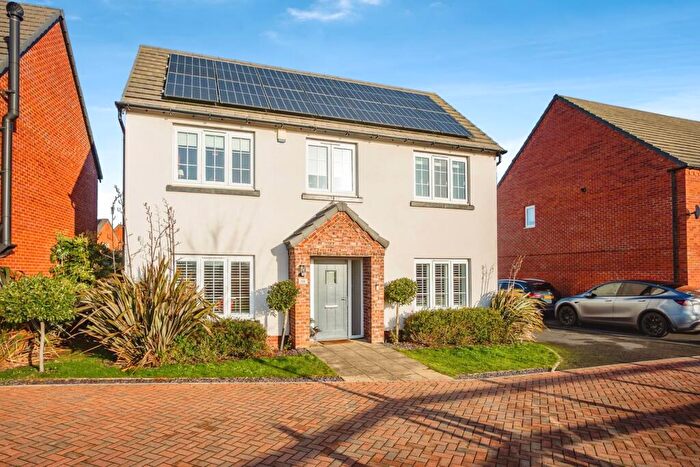
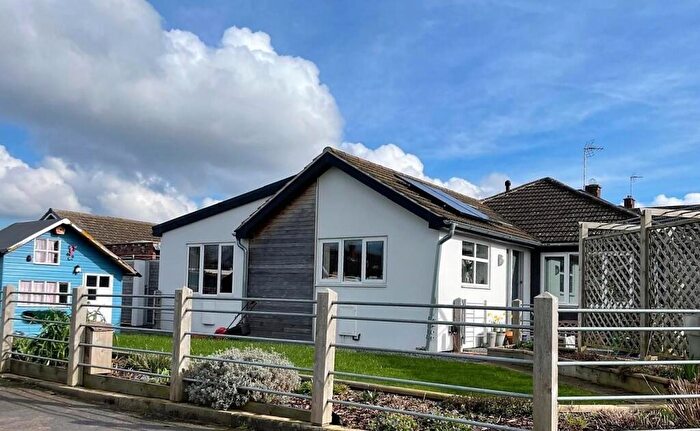
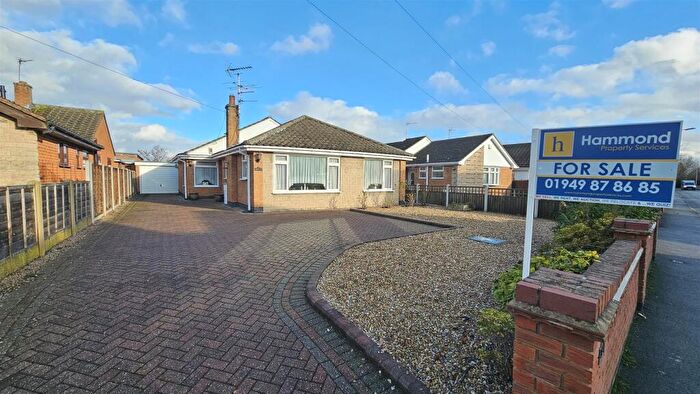
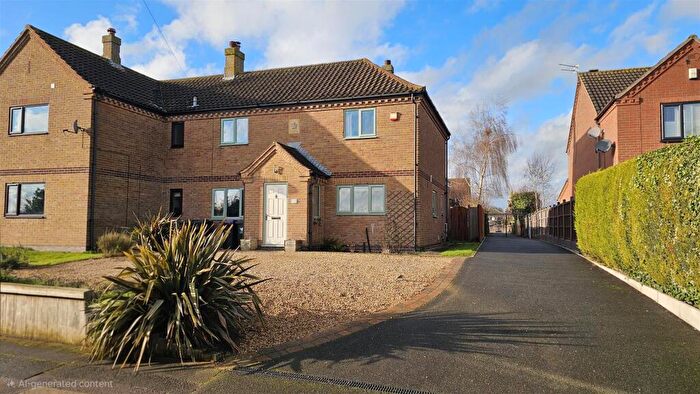
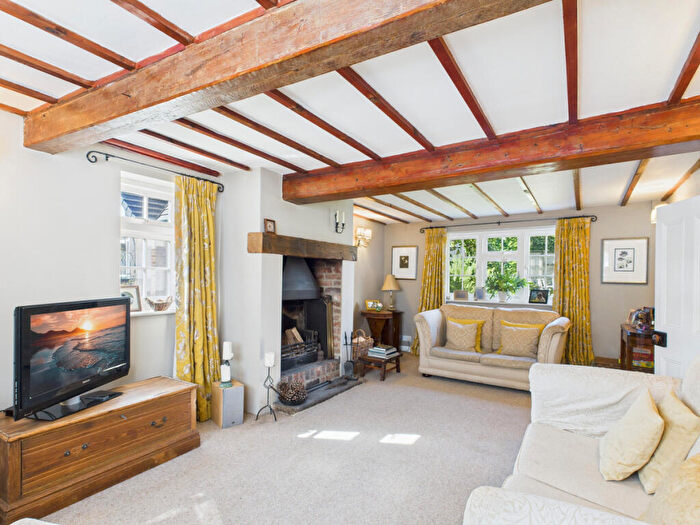
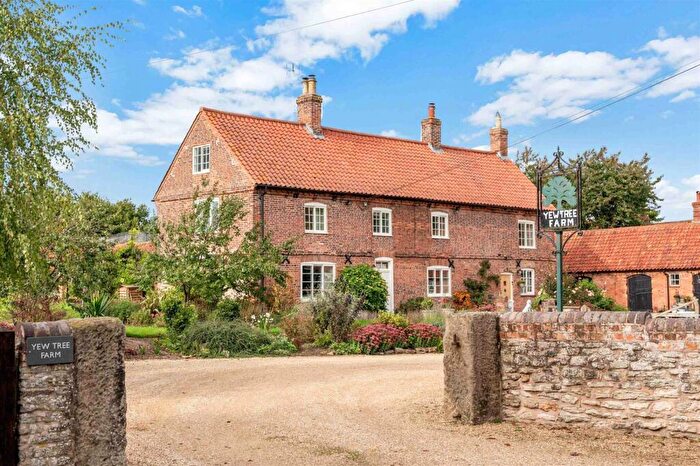
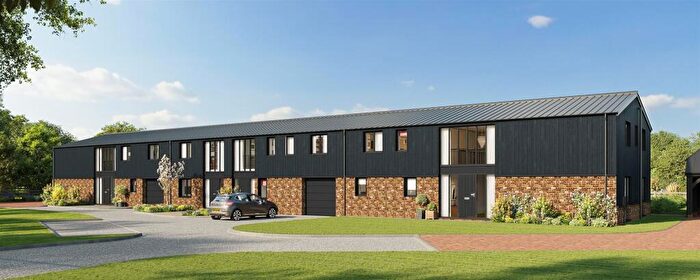
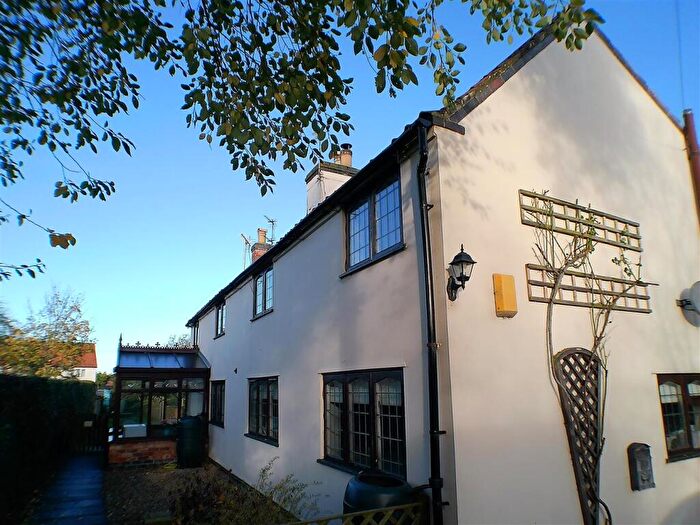
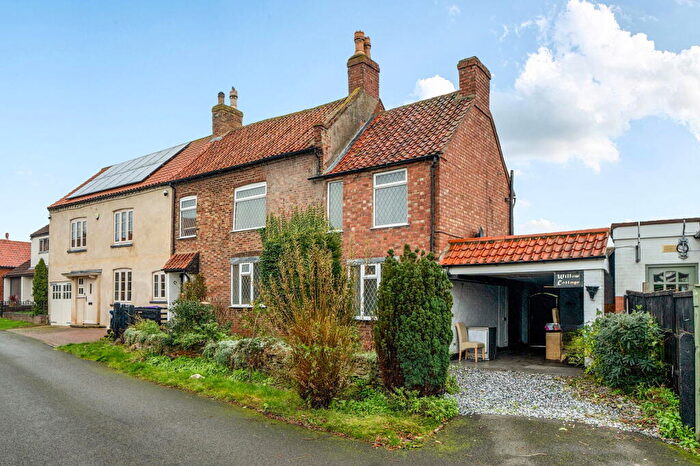
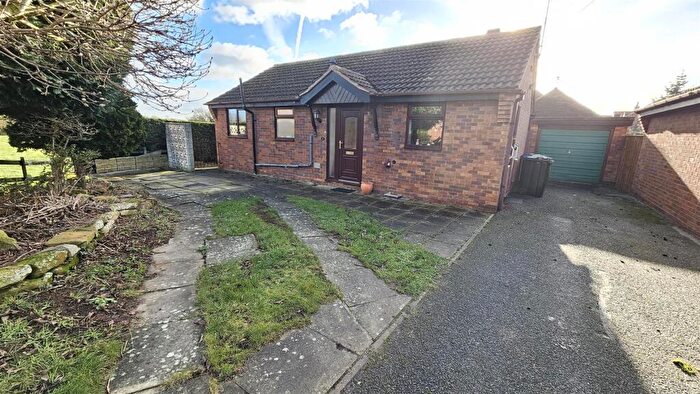
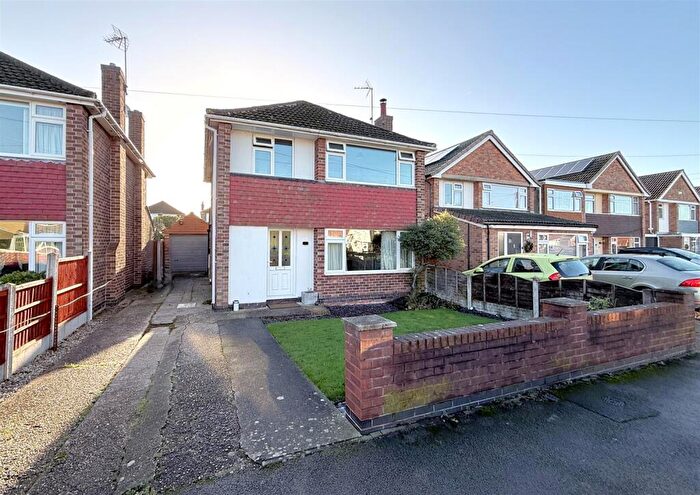
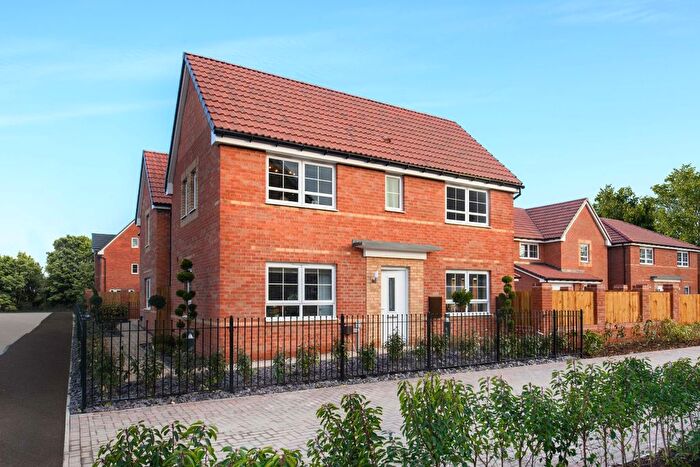
Properties for sale in Cranmer
Roads and Postcodes in Cranmer
Navigate through our locations to find the location of your next house in Cranmer, Nottingham for sale or to rent.
| Streets | Postcodes |
|---|---|
| Abbey Close | NG13 9AF |
| Abbey Lane | NG13 9AE |
| Aslockton Road | NG13 9BP |
| Azimghur Road | NG13 9FF |
| Belvoir Close | NG13 9FL |
| Beverleys Avenue | NG13 9AU |
| Birch Close | NG13 9DL |
| Boundary Close | NG13 9BL |
| Buckthorn Drive | NG13 9DN |
| Burton Lane | NG13 9EQ |
| Car Colston Road | NG13 9BY |
| Car Lane | NG13 8QU |
| Chapel Lane | NG13 9BX |
| Chapel Row | NG13 9AR |
| Chapel Walk | NG13 9EH |
| Church Street | NG13 9EL |
| Cliff Hill Lane | NG13 9AP |
| Conery Gardens | NG13 9FD |
| Conery Lane | NG13 9FB NG13 9FJ NG13 9FH |
| Cottage Avenue | NG13 9FS |
| Cranmer Avenue | NG13 9FP |
| Crawfords Meadow | NG13 9BJ |
| Cromwell Road | NG13 9FN |
| Dark Lane | NG13 9AA NG13 9FE |
| Dawns Lane | NG13 9AD NG13 9BN |
| Fields Drive | NG13 9AG |
| Fosse Road | NG13 8JA NG13 8JB |
| Granby Lane | NG13 9FZ |
| Grantham Road | NG13 9AJ NG13 9EU NG13 9EW |
| Green Walk | NG13 9FT |
| Griffins End | NG13 9EE |
| Hawksworth Road | NG13 9BS NG13 9BT |
| Ivy Row | NG13 9EY |
| Little Green | NG13 8JH |
| Main Street | NG13 9AB NG13 9AL NG13 9BQ NG13 9EP NG13 9BH NG13 9BZ |
| Manor Arms Place | NG13 9LL |
| Manor Lane | NG13 9EX |
| Meadow Close | NG13 9AQ |
| Mill Lane | NG13 9AS |
| New Lane | NG13 9AH NG13 9FQ |
| New Row | NG13 9AN |
| Noble Lane | NG13 9AY |
| Old Grantham Road | NG13 9FR NG13 9FG NG13 9FX |
| Old Greyhound Close | NG13 9AT |
| Old Hall Gardens | NG13 8HX |
| Orston Lane | NG13 9ET |
| Private Road | NG13 9EN |
| Riverside | NG13 9EJ |
| School Lane | NG13 9AW NG13 9ES |
| Smite Close | NG13 9FU |
| St Thomas Drive | NG13 9BD |
| Sunbeam Street | NG13 9ER |
| Tenman Lane | NG13 8JD |
| The Capes | NG13 9AZ |
| The Lawns | NG13 9EZ |
| The Saucers | NG13 9BW |
| The Sidings | NG13 9BE |
| Thornfield Way | NG13 9DJ |
| Vale Close | NG13 9BA |
| Walnut Close | NG13 9AX |
| Whipling Close | NG13 9EA |
| NG13 9FW |
Transport near Cranmer
- FAQ
- Price Paid By Year
- Property Type Price
Frequently asked questions about Cranmer
What is the average price for a property for sale in Cranmer?
The average price for a property for sale in Cranmer is £371,846. This amount is 32% higher than the average price in Nottingham. There are 418 property listings for sale in Cranmer.
What streets have the most expensive properties for sale in Cranmer?
The streets with the most expensive properties for sale in Cranmer are Car Lane at an average of £1,025,000, Church Street at an average of £960,000 and The Saucers at an average of £840,000.
What streets have the most affordable properties for sale in Cranmer?
The streets with the most affordable properties for sale in Cranmer are Mill Lane at an average of £170,000, Azimghur Road at an average of £170,000 and Smite Close at an average of £210,000.
Which train stations are available in or near Cranmer?
Some of the train stations available in or near Cranmer are Aslockton, Elton and Orston and Bingham.
Property Price Paid in Cranmer by Year
The average sold property price by year was:
| Year | Average Sold Price | Price Change |
Sold Properties
|
|---|---|---|---|
| 2025 | £351,607 | -13% |
28 Properties |
| 2024 | £398,257 | 9% |
33 Properties |
| 2023 | £361,683 | -47% |
30 Properties |
| 2022 | £531,957 | 36% |
51 Properties |
| 2021 | £341,869 | 1% |
43 Properties |
| 2020 | £339,844 | -5% |
29 Properties |
| 2019 | £357,961 | 6% |
52 Properties |
| 2018 | £337,929 | 16% |
62 Properties |
| 2017 | £282,836 | -8% |
35 Properties |
| 2016 | £306,200 | 2% |
32 Properties |
| 2015 | £301,594 | 16% |
26 Properties |
| 2014 | £252,513 | 3% |
43 Properties |
| 2013 | £244,575 | -1% |
26 Properties |
| 2012 | £246,074 | -3% |
31 Properties |
| 2011 | £254,549 | 5% |
28 Properties |
| 2010 | £241,416 | 6% |
30 Properties |
| 2009 | £226,270 | -26% |
22 Properties |
| 2008 | £285,000 | -3% |
21 Properties |
| 2007 | £293,848 | 12% |
37 Properties |
| 2006 | £258,988 | 9% |
38 Properties |
| 2005 | £236,338 | 2% |
36 Properties |
| 2004 | £232,085 | 7% |
40 Properties |
| 2003 | £215,690 | 16% |
36 Properties |
| 2002 | £182,066 | 24% |
47 Properties |
| 2001 | £139,168 | 12% |
44 Properties |
| 2000 | £122,043 | -6% |
40 Properties |
| 1999 | £129,910 | 16% |
49 Properties |
| 1998 | £109,343 | 14% |
48 Properties |
| 1997 | £94,189 | 7% |
39 Properties |
| 1996 | £87,268 | 3% |
51 Properties |
| 1995 | £84,324 | - |
35 Properties |
Property Price per Property Type in Cranmer
Here you can find historic sold price data in order to help with your property search.
The average Property Paid Price for specific property types in the last three years are:
| Property Type | Average Sold Price | Sold Properties |
|---|---|---|
| Semi Detached House | £238,768.00 | 41 Semi Detached Houses |
| Detached House | £502,411.00 | 45 Detached Houses |
| Terraced House | £288,000.00 | 5 Terraced Houses |

