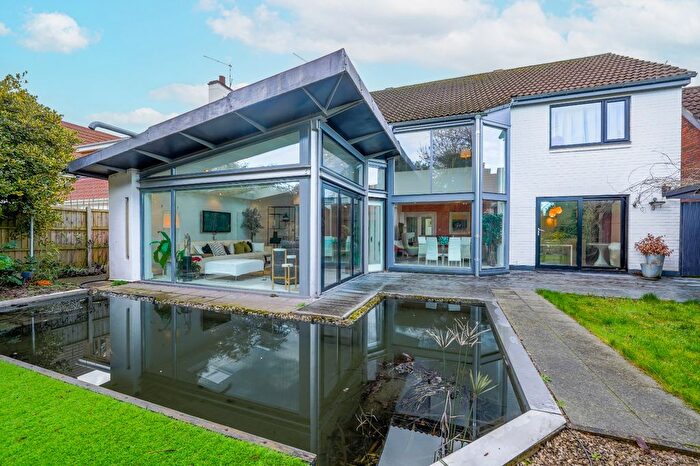
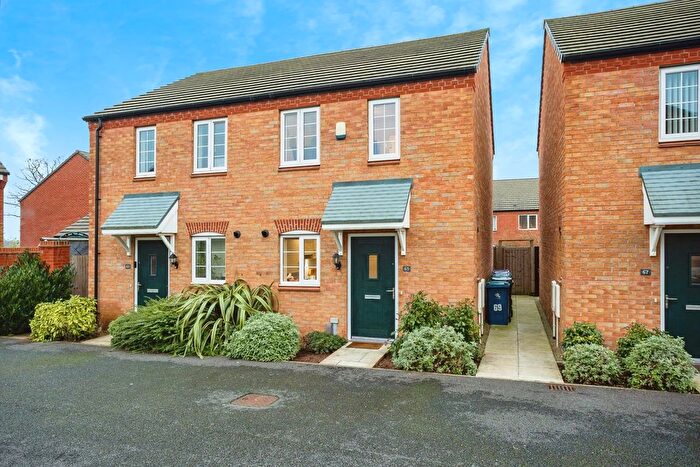
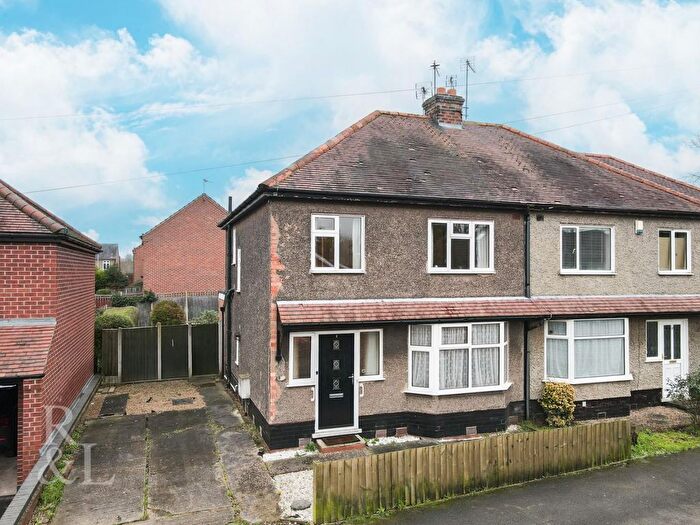
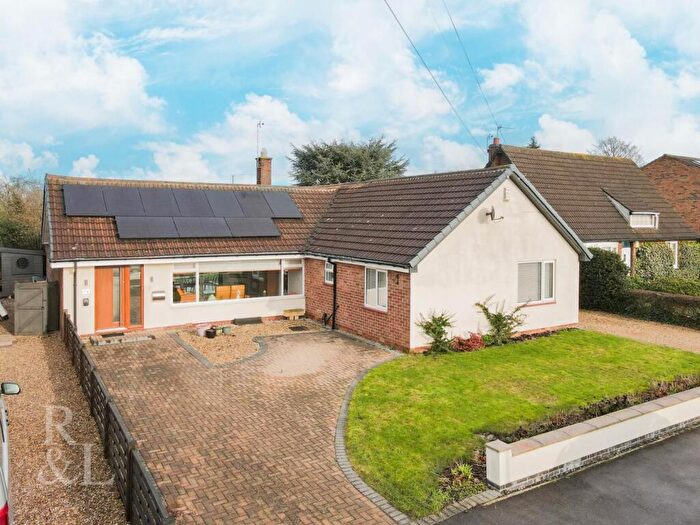
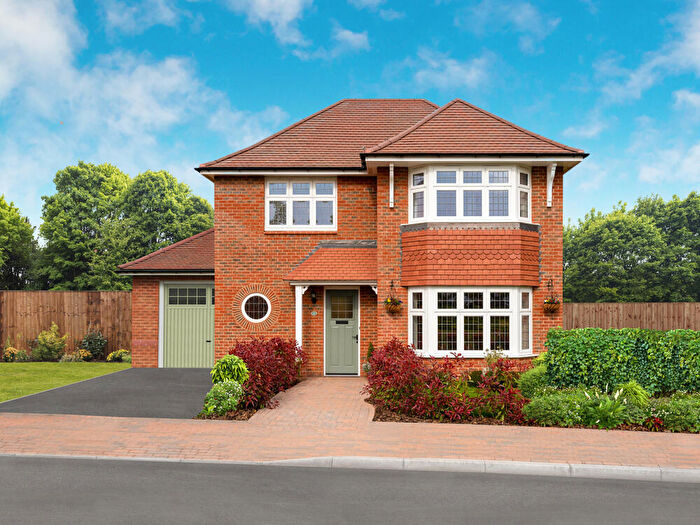
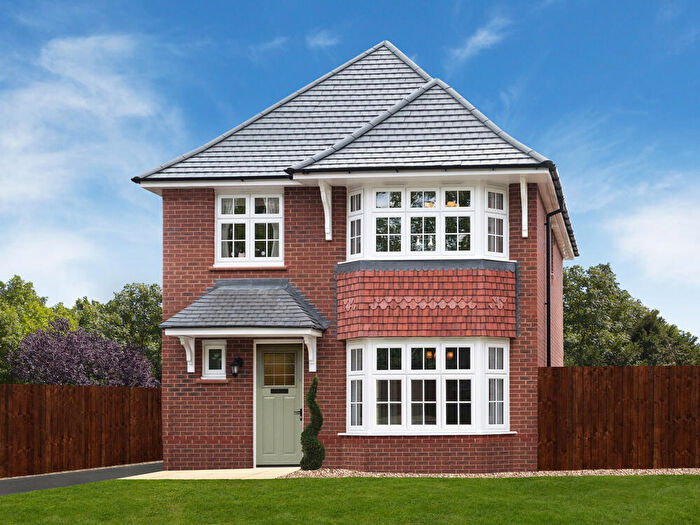
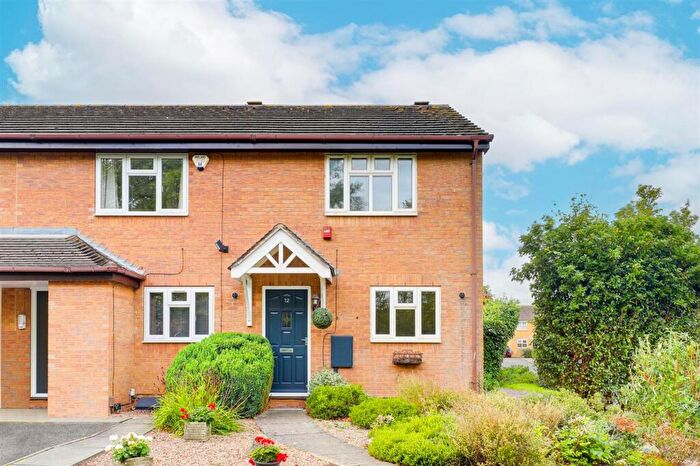
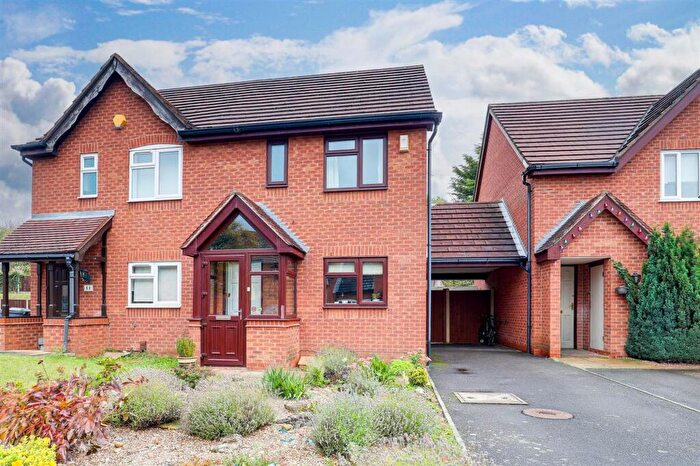
Houses for sale & to rent in Tollerton, Nottingham
House Prices in Tollerton
Properties in Tollerton have an average house price of £446,693.00 and had 64 Property Transactions within the last 3 years¹.
Tollerton is an area in Nottingham, Nottinghamshire with 796 households², where the most expensive property was sold for £993,750.00.
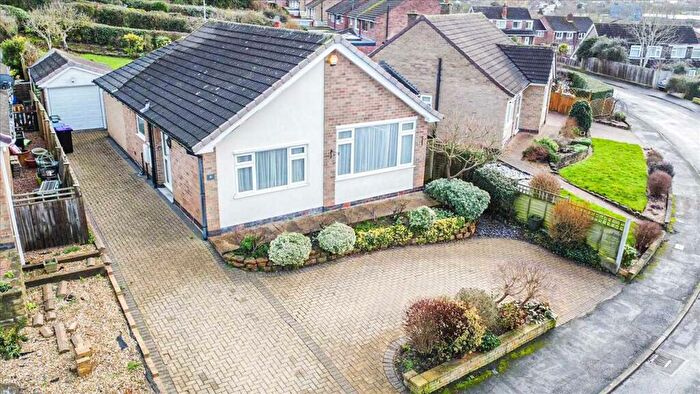
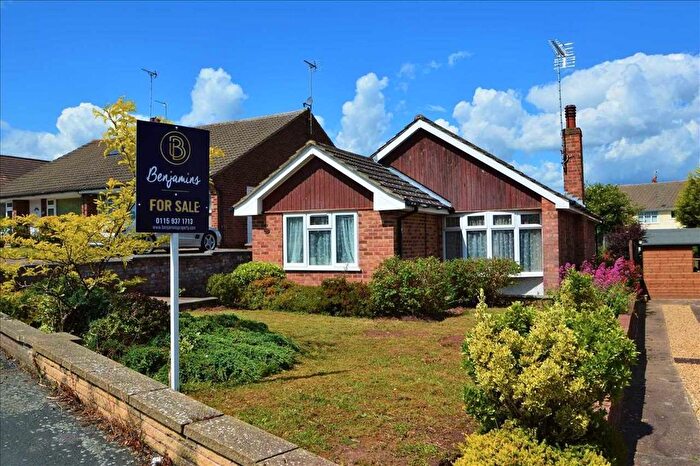
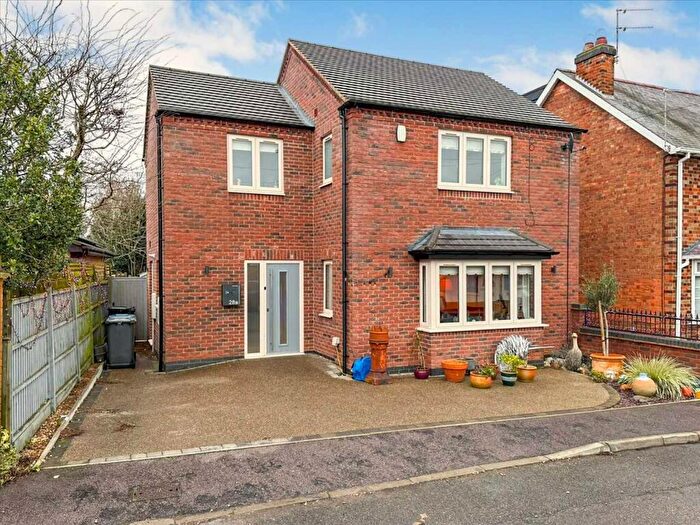
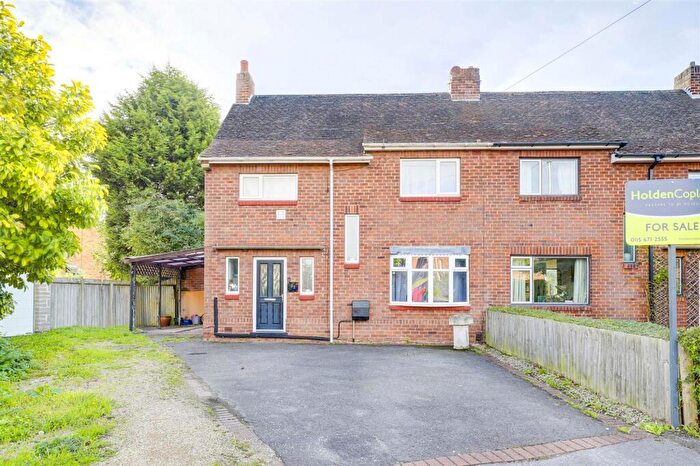
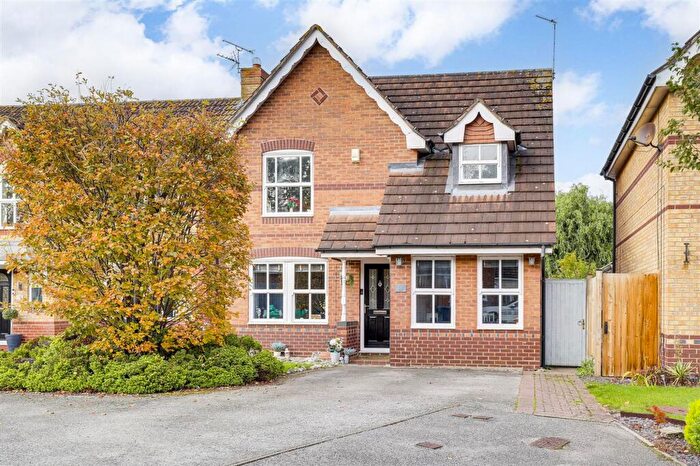
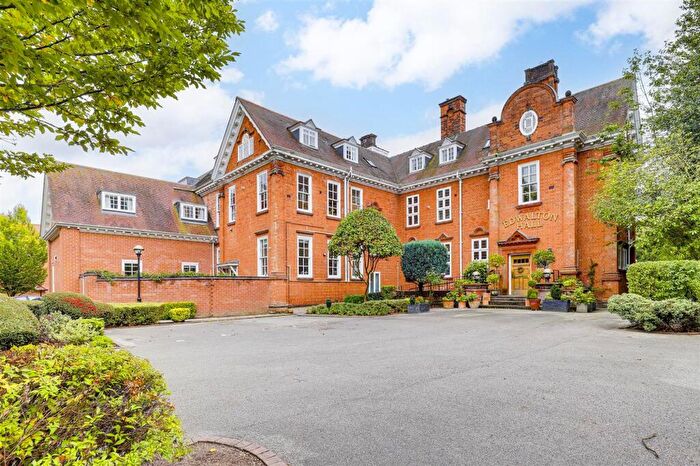
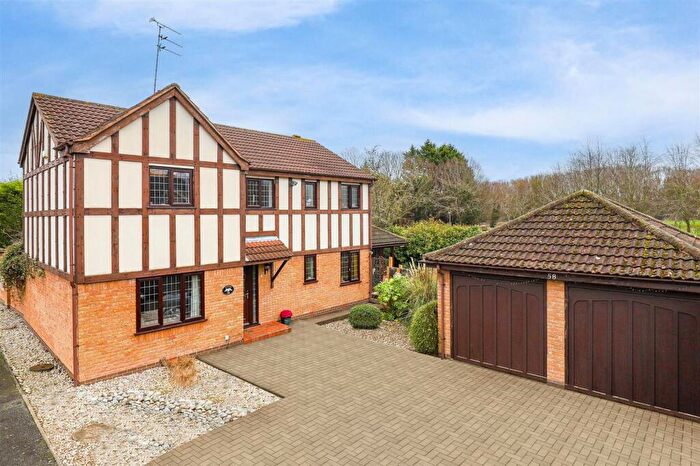
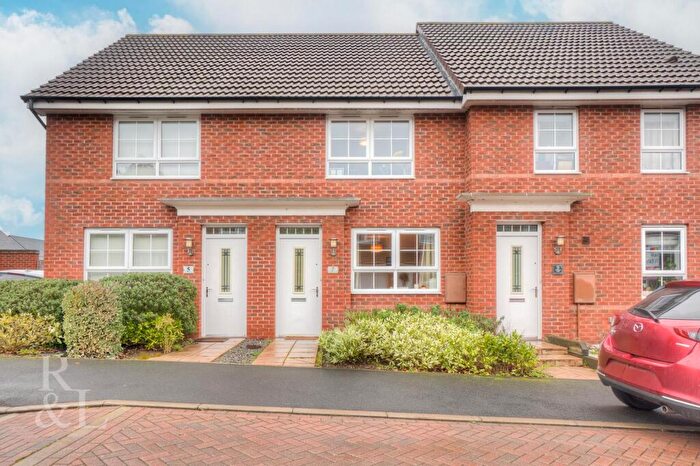
Properties for sale in Tollerton
Roads and Postcodes in Tollerton
Navigate through our locations to find the location of your next house in Tollerton, Nottingham for sale or to rent.
| Streets | Postcodes |
|---|---|
| Bentinck Avenue | NG12 4ED |
| Burnside Grove | NG12 4EB NG12 4ET |
| Chestnut Mews | NG12 4GA |
| Church Gate | NG12 5PA |
| Cotgrave Lane | NG12 4FX NG12 4FY |
| Cotgrave Road | NG12 5NX NG12 5PE |
| Franklin Drive | NG12 4ER |
| Gilliver Lane | NG12 5PD |
| Hall Farm Close | NG12 4DY |
| High Meadow | NG12 4DZ |
| Hoe Hill View | NG12 4GE |
| Lenton Avenue | NG12 4EG |
| Lenton Circus | NG12 4EJ |
| Little Lane | NG12 4FU |
| Lothian Road | NG12 4EH |
| Medina Drive | NG12 4EP NG12 4EQ |
| Melton Road | NG12 4EL NG12 4EN |
| Muir Avenue | NG12 4EZ |
| Oak Tree Court | NG12 4HJ |
| Orchard Close | NG12 4EW |
| Pendock Court | NG12 4FN |
| Priory Avenue | NG12 4EE |
| Priory Circus | NG12 4EF |
| Russell Farm Close | NG12 4HH |
| Sedgley Road | NG12 4EU |
| Stanstead Avenue | NG12 4EA |
| Stella Avenue | NG12 4EX |
| Stella Grove | NG12 4EY |
| Sunnindale Drive | NG12 4ES |
| Tollerton Lane | NG12 4FP NG12 4FQ NG12 4FR NG12 4FS NG12 4FT NG12 4FW NG12 4GB |
| Tollerton Park Lane | NG12 4GD |
| Wolds Lane | NG12 5PB NG12 5PF |
| NG12 4GQ |
Transport near Tollerton
- FAQ
- Price Paid By Year
- Property Type Price
Frequently asked questions about Tollerton
What is the average price for a property for sale in Tollerton?
The average price for a property for sale in Tollerton is £446,693. This amount is 58% higher than the average price in Nottingham. There are 688 property listings for sale in Tollerton.
What streets have the most expensive properties for sale in Tollerton?
The streets with the most expensive properties for sale in Tollerton are Church Gate at an average of £615,000, Tollerton Lane at an average of £614,138 and Lenton Avenue at an average of £488,333.
What streets have the most affordable properties for sale in Tollerton?
The streets with the most affordable properties for sale in Tollerton are Chestnut Mews at an average of £235,000, Hall Farm Close at an average of £325,000 and Sunnindale Drive at an average of £365,666.
Which train stations are available in or near Tollerton?
Some of the train stations available in or near Tollerton are Nottingham, Radcliffe (Nottinghamshire) and Netherfield.
Property Price Paid in Tollerton by Year
The average sold property price by year was:
| Year | Average Sold Price | Price Change |
Sold Properties
|
|---|---|---|---|
| 2025 | £451,205 | 5% |
17 Properties |
| 2024 | £426,870 | -8% |
22 Properties |
| 2023 | £461,070 | -13% |
25 Properties |
| 2022 | £519,627 | 12% |
27 Properties |
| 2021 | £458,166 | 17% |
43 Properties |
| 2020 | £380,588 | -0,3% |
31 Properties |
| 2019 | £381,841 | 6% |
24 Properties |
| 2018 | £359,273 | 5% |
36 Properties |
| 2017 | £341,704 | 9% |
43 Properties |
| 2016 | £310,493 | 8% |
31 Properties |
| 2015 | £285,818 | -15% |
33 Properties |
| 2014 | £329,677 | 13% |
36 Properties |
| 2013 | £286,188 | -26% |
39 Properties |
| 2012 | £359,678 | 7% |
21 Properties |
| 2011 | £334,818 | 12% |
27 Properties |
| 2010 | £293,807 | 10% |
26 Properties |
| 2009 | £264,269 | -3% |
23 Properties |
| 2008 | £271,500 | 5% |
11 Properties |
| 2007 | £256,894 | -7% |
26 Properties |
| 2006 | £275,740 | -19% |
42 Properties |
| 2005 | £329,491 | 17% |
25 Properties |
| 2004 | £274,429 | 15% |
34 Properties |
| 2003 | £234,455 | 17% |
36 Properties |
| 2002 | £194,889 | 12% |
34 Properties |
| 2001 | £171,298 | 13% |
41 Properties |
| 2000 | £148,360 | 15% |
25 Properties |
| 1999 | £125,459 | 8% |
44 Properties |
| 1998 | £114,863 | 21% |
32 Properties |
| 1997 | £90,840 | 1% |
31 Properties |
| 1996 | £89,582 | -14% |
33 Properties |
| 1995 | £102,345 | - |
21 Properties |
Property Price per Property Type in Tollerton
Here you can find historic sold price data in order to help with your property search.
The average Property Paid Price for specific property types in the last three years are:
| Property Type | Average Sold Price | Sold Properties |
|---|---|---|
| Semi Detached House | £373,194.00 | 18 Semi Detached Houses |
| Detached House | £483,543.00 | 44 Detached Houses |
| Terraced House | £297,500.00 | 2 Terraced Houses |

