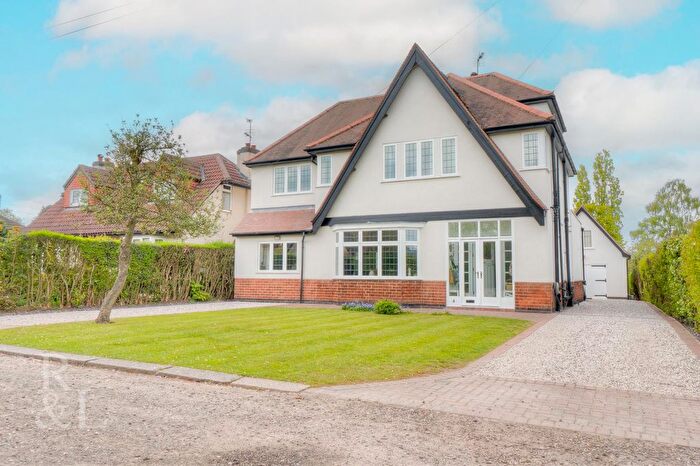
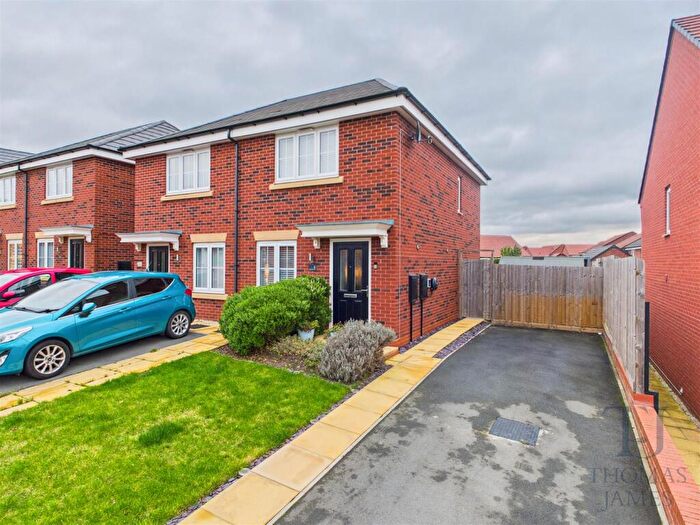
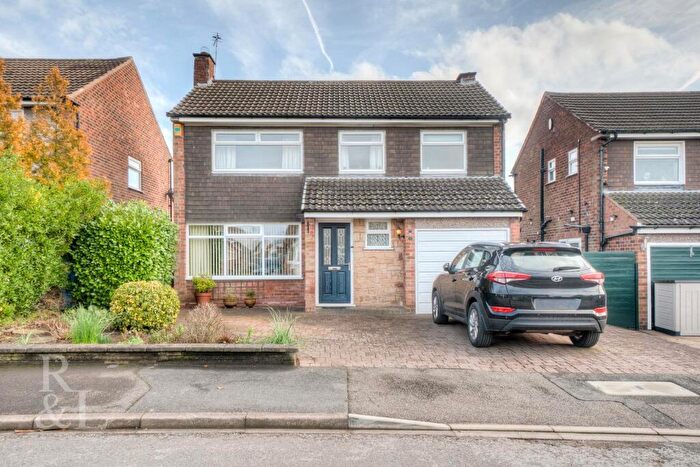
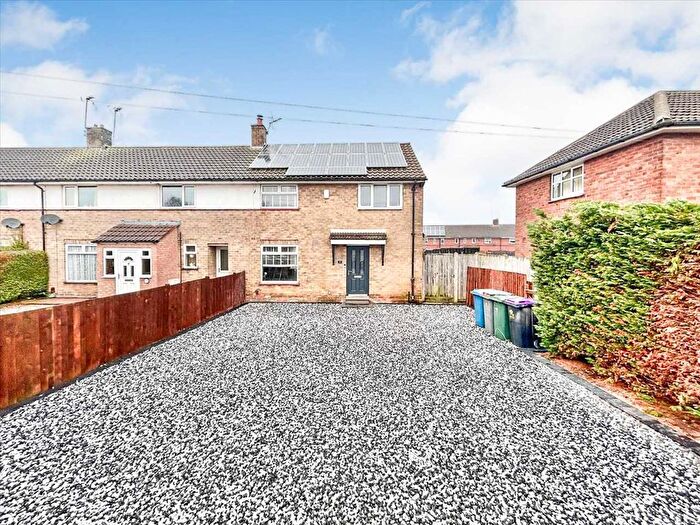
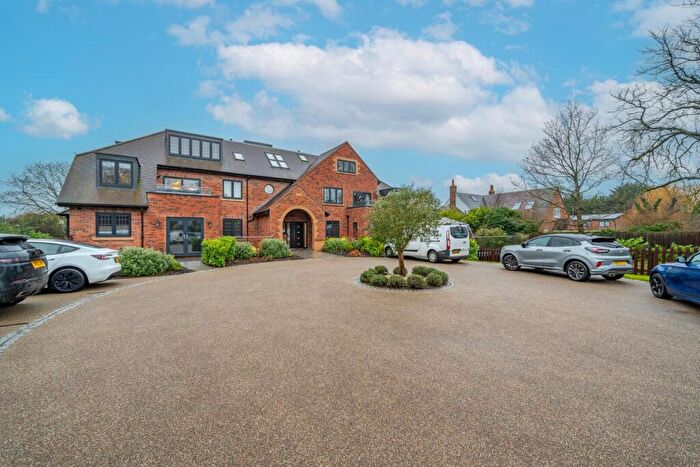
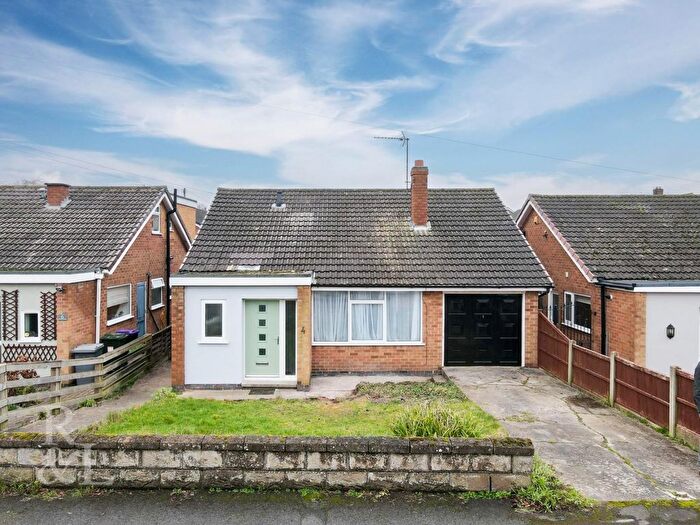
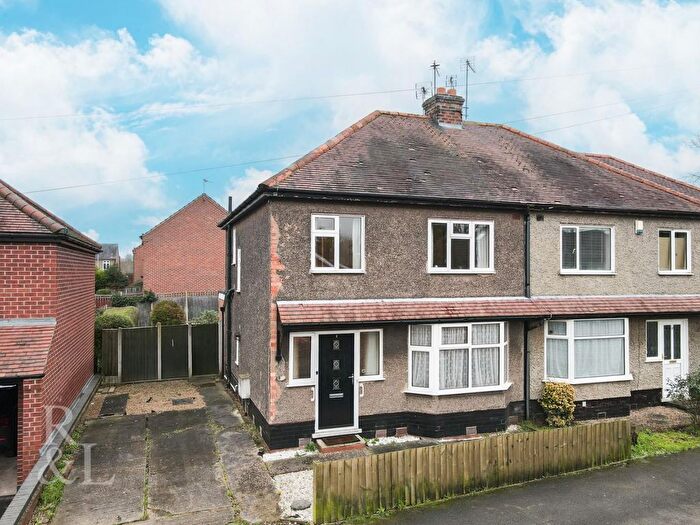
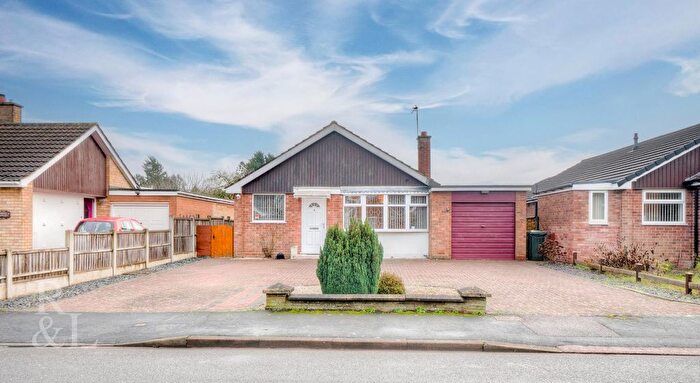
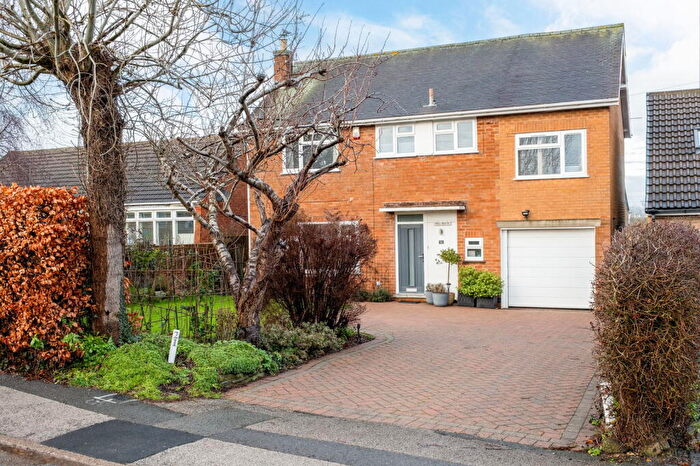
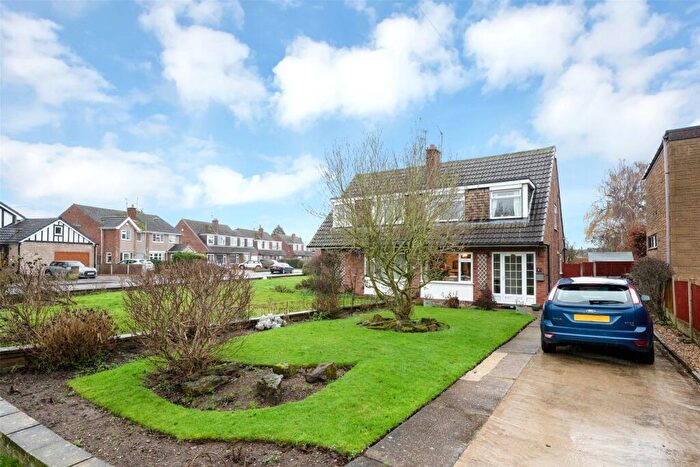
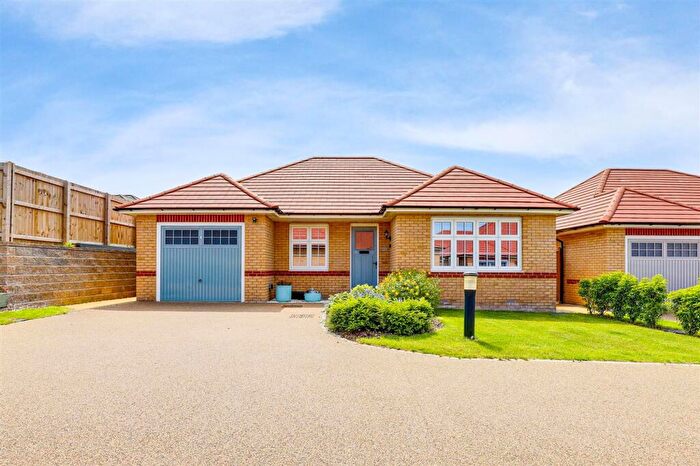
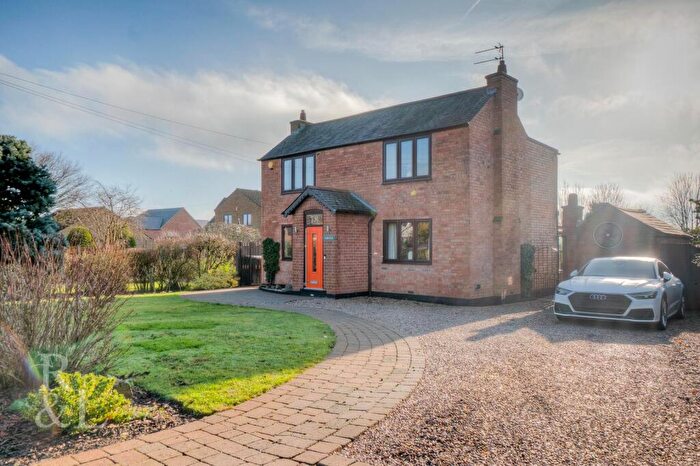
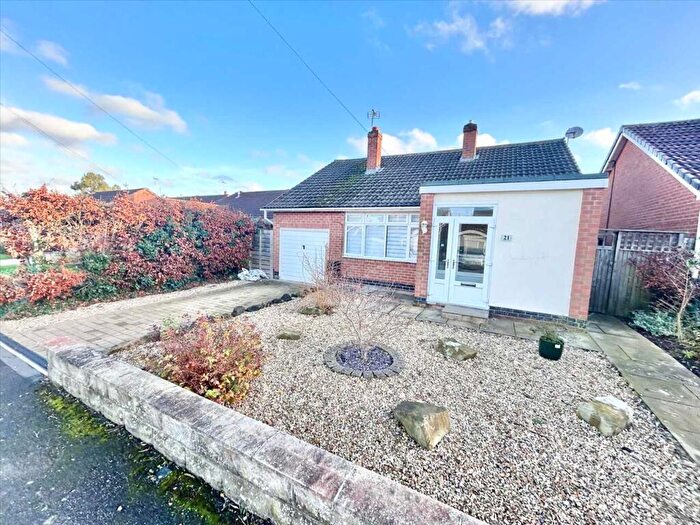
Houses for sale & to rent in Keyworth South, Nottingham
House Prices in Keyworth South
Properties in Keyworth South have an average house price of £300,255.00 and had 238 Property Transactions within the last 3 years¹.
Keyworth South is an area in Nottingham, Nottinghamshire with 2,214 households², where the most expensive property was sold for £1,345,000.00.
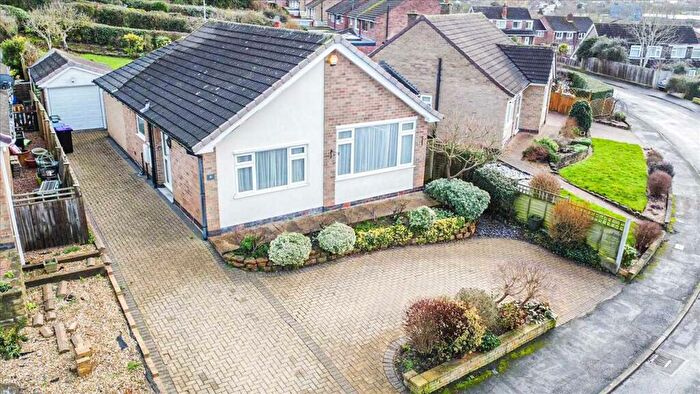
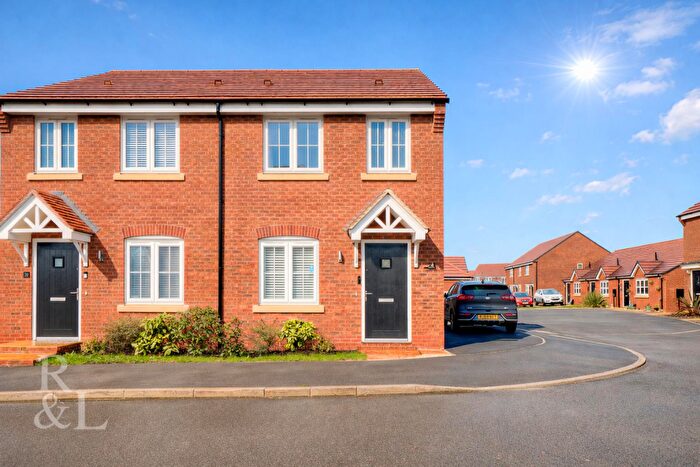
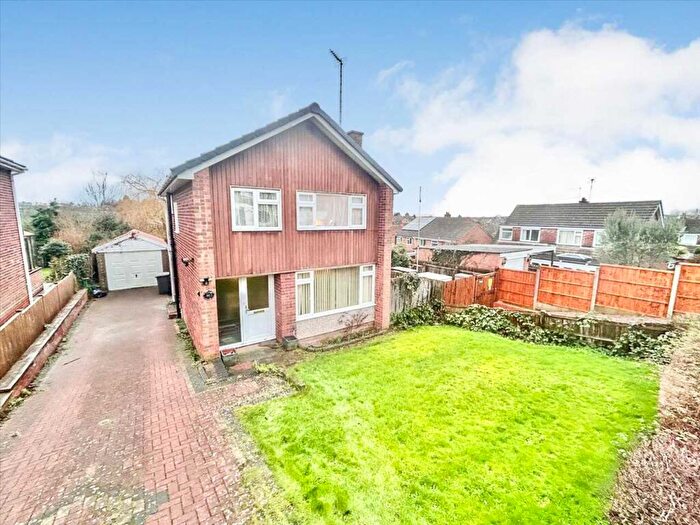
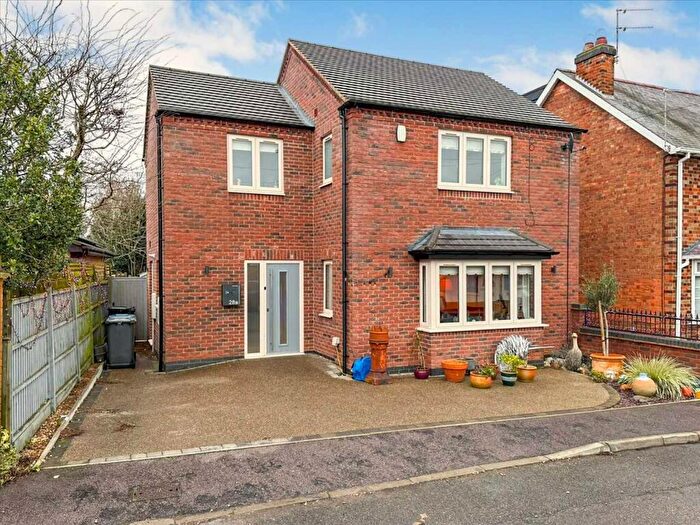
Properties for sale in Keyworth South
Roads and Postcodes in Keyworth South
Navigate through our locations to find the location of your next house in Keyworth South, Nottingham for sale or to rent.
| Streets | Postcodes |
|---|---|
| Alder Way | NG12 5DX |
| Ash Grove | NG12 5DH |
| Ashley Crescent | NG12 5GF |
| Ashley Road | NG12 5FH NG12 5FJ NG12 5FL |
| Barnett Court | NG12 5GX |
| Barrow Slade | NG12 5JQ |
| Beech Avenue | NG12 5DD NG12 5DE NG12 5DJ |
| Blind Lane | NG12 5GH |
| Brook View Court | NG12 5AS |
| Brook View Drive | NG12 5JN NG12 5RA |
| Bunny Lane | NG12 5JU NG12 5JW |
| Cedar Drive | NG12 5AB |
| Charnwood Avenue | NG12 5JX |
| Cherry Hill | NG12 5EJ |
| Chestnut Close | NG12 5PX |
| Church Drive | NG12 5FE NG12 5FF NG12 5FG |
| Crantock Gardens | NG12 5FR |
| Croft Road | NG12 5LB NG12 5LD |
| Dale Road | NG12 5HS |
| Debdale Lane | NG12 5HT |
| East Close | NG12 5GN |
| Elm Avenue | NG12 5AN |
| Elm Close | NG12 5AP |
| Fairham Road | NG12 5LF |
| Fairway | NG12 5DL NG12 5DP NG12 5DU NG12 5DW |
| Far Pastures Close | NG12 5RB |
| Gorse Road | NG12 5LL |
| Hawthorn Close | NG12 5JP |
| Hayes Road | NG12 5LJ |
| High Court Drive | NG12 5LY |
| High View Avenue | NG12 5EL |
| Holly Farm Cottages | NG12 5AU |
| Holmsfield | NG12 5RD |
| Intake Road | NG12 5LE |
| Laburnum Avenue | NG12 5DT |
| Larch Way | NG12 5DS |
| Laurel Avenue | NG12 5DF |
| Lilac Close | NG12 5DN |
| Lime Tree Close | NG12 5DG |
| Lings Lane | NG12 5AF NG12 5AY |
| Lyncombe Gardens | NG12 5FZ |
| Main Street | NG12 5AA NG12 5AD |
| Manor Road | NG12 5GL NG12 5GP NG12 5HW NG12 5LR |
| Maple Close | NG12 5DQ |
| Meadow Drive | NG12 5EE |
| Mount Pleasant | NG12 5EG NG12 5EH NG12 5EP NG12 5ES NG12 5ET |
| Nicker Hill | NG12 5ED |
| Nottingham Road | NG12 5FB NG12 5FD NG12 5GS NG12 5GT NG12 5GU |
| Park Avenue | NG12 5JY NG12 5LA |
| Park Avenue East | NG12 5JZ |
| Plantation Road | NG12 5LG NG12 5LH |
| Private Road | NG12 5ER |
| Rannock Gardens | NG12 5FQ |
| Rose Hill | NG12 5GR |
| Roseland Close | NG12 5LQ |
| Rowan Drive | NG12 5DR |
| Selby Lane | NG12 5AH NG12 5AJ NG12 5AL NG12 5AQ |
| Spinney Road | NG12 5LN NG12 5NG |
| The Ridings | NG12 5EF |
| The Square | NG12 5JT |
| Thelda Avenue | NG12 5HU |
| Walton Drive | NG12 5FN NG12 5FP |
| West Close | NG12 5GQ |
| Willow Brook | NG12 5BB |
| Windmill Court | NG12 5AX |
| Wolds Drive | NG12 5DA NG12 5DB NG12 5FS NG12 5FT NG12 5FX |
| Wolds Rise | NG12 5FU |
| Woodleigh | NG12 5NF |
| Wrights Orchard | NG12 5RE |
| Wynbreck Drive | NG12 5FY |
| Wysall Lane | NG12 5AG NG12 5AR |
Transport near Keyworth South
-
Radcliffe (Nottinghamshire) Station
-
Nottingham Station
-
Beeston Station
-
Netherfield Station
-
Carlton Station
-
Attenborough Station
-
East Midlands Parkway Station
-
Burton Joyce Station
-
Loughborough Station
-
Bingham Station
- FAQ
- Price Paid By Year
- Property Type Price
Frequently asked questions about Keyworth South
What is the average price for a property for sale in Keyworth South?
The average price for a property for sale in Keyworth South is £300,255. This amount is 6% higher than the average price in Nottingham. There are 488 property listings for sale in Keyworth South.
What streets have the most expensive properties for sale in Keyworth South?
The streets with the most expensive properties for sale in Keyworth South are High View Avenue at an average of £800,000, Lings Lane at an average of £680,000 and Larch Way at an average of £570,000.
What streets have the most affordable properties for sale in Keyworth South?
The streets with the most affordable properties for sale in Keyworth South are Barnett Court at an average of £130,800, Woodleigh at an average of £141,600 and Windmill Court at an average of £156,428.
Which train stations are available in or near Keyworth South?
Some of the train stations available in or near Keyworth South are Radcliffe (Nottinghamshire), Nottingham and Beeston.
Property Price Paid in Keyworth South by Year
The average sold property price by year was:
| Year | Average Sold Price | Price Change |
Sold Properties
|
|---|---|---|---|
| 2025 | £278,768 | -17% |
80 Properties |
| 2024 | £327,061 | 9% |
72 Properties |
| 2023 | £297,802 | 1% |
86 Properties |
| 2022 | £293,942 | 5% |
97 Properties |
| 2021 | £280,021 | 7% |
123 Properties |
| 2020 | £259,953 | 12% |
69 Properties |
| 2019 | £228,797 | -16% |
74 Properties |
| 2018 | £265,194 | 22% |
84 Properties |
| 2017 | £205,724 | -9% |
100 Properties |
| 2016 | £224,977 | 6% |
86 Properties |
| 2015 | £212,018 | -1% |
103 Properties |
| 2014 | £215,093 | 10% |
103 Properties |
| 2013 | £194,552 | 8% |
81 Properties |
| 2012 | £178,247 | 9% |
63 Properties |
| 2011 | £162,970 | -16% |
65 Properties |
| 2010 | £189,465 | 5% |
57 Properties |
| 2009 | £179,389 | -5% |
65 Properties |
| 2008 | £187,566 | 1% |
38 Properties |
| 2007 | £186,208 | 2% |
104 Properties |
| 2006 | £182,996 | 5% |
104 Properties |
| 2005 | £173,131 | 2% |
57 Properties |
| 2004 | £168,861 | 6% |
86 Properties |
| 2003 | £158,151 | 25% |
89 Properties |
| 2002 | £118,020 | 23% |
83 Properties |
| 2001 | £91,427 | - |
107 Properties |
| 2000 | £91,471 | 14% |
89 Properties |
| 1999 | £79,063 | 8% |
111 Properties |
| 1998 | £72,369 | 13% |
84 Properties |
| 1997 | £62,975 | 1% |
102 Properties |
| 1996 | £62,053 | -3% |
81 Properties |
| 1995 | £63,626 | - |
80 Properties |
Property Price per Property Type in Keyworth South
Here you can find historic sold price data in order to help with your property search.
The average Property Paid Price for specific property types in the last three years are:
| Property Type | Average Sold Price | Sold Properties |
|---|---|---|
| Semi Detached House | £261,504.00 | 111 Semi Detached Houses |
| Detached House | £402,910.00 | 83 Detached Houses |
| Terraced House | £199,525.00 | 39 Terraced Houses |
| Flat | £242,160.00 | 5 Flats |

