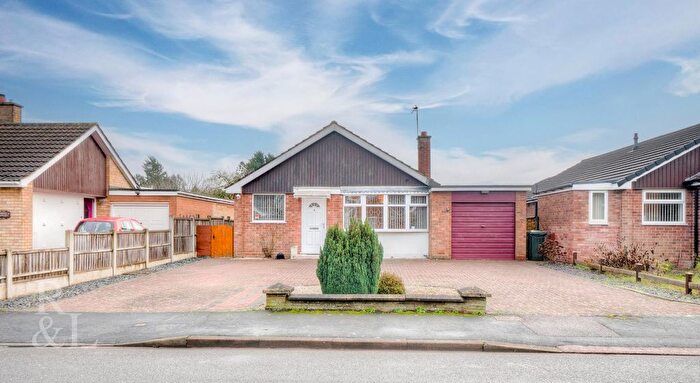
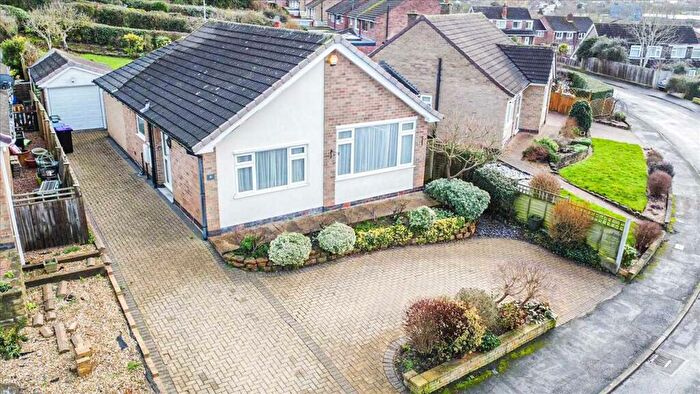
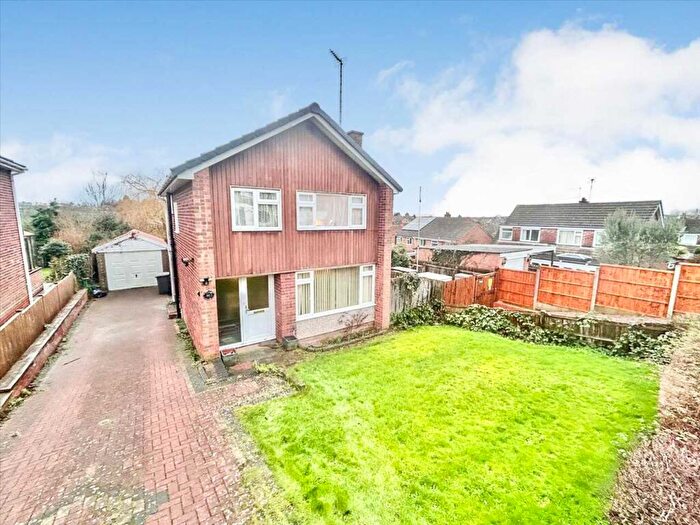
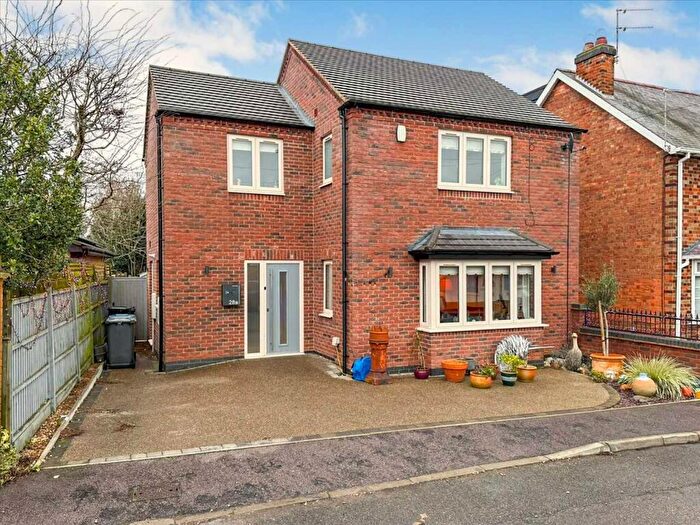
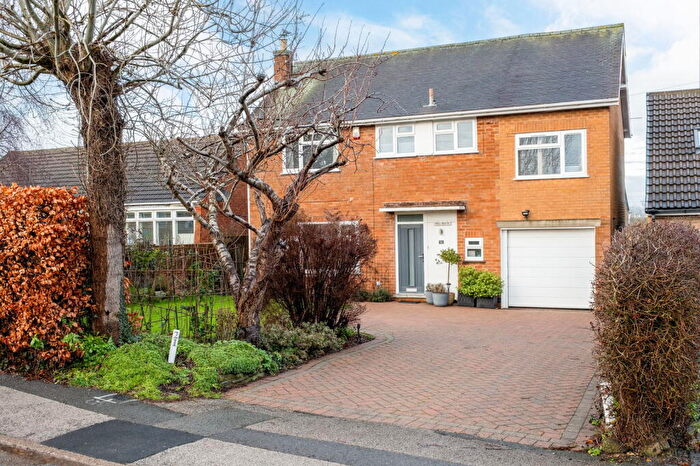
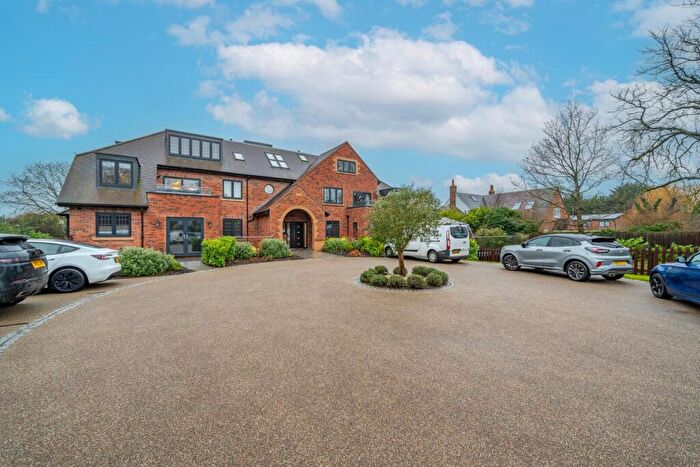
Houses for sale & to rent in Keyworth North, Nottingham
House Prices in Keyworth North
Properties in Keyworth North have an average house price of £383,358.00 and had 78 Property Transactions within the last 3 years¹.
Keyworth North is an area in Nottingham, Nottinghamshire with 753 households², where the most expensive property was sold for £1,100,000.00.
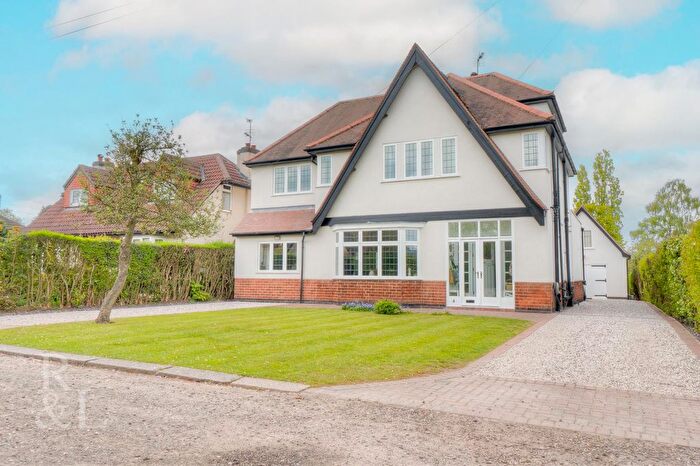
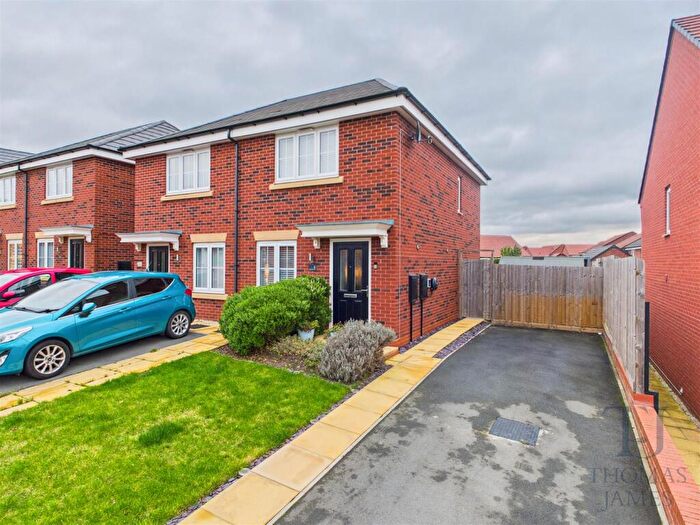
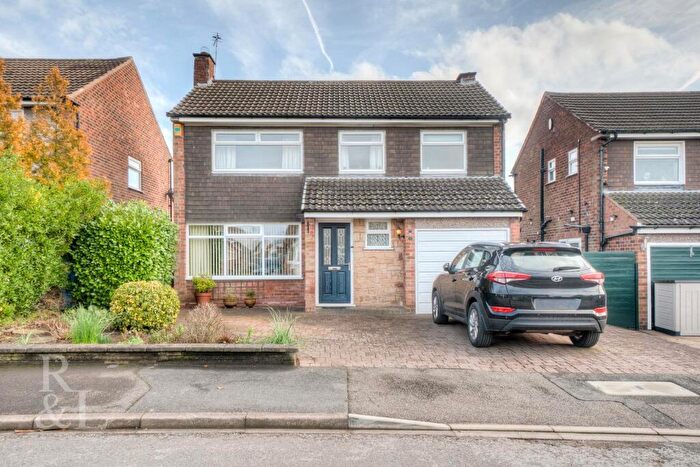
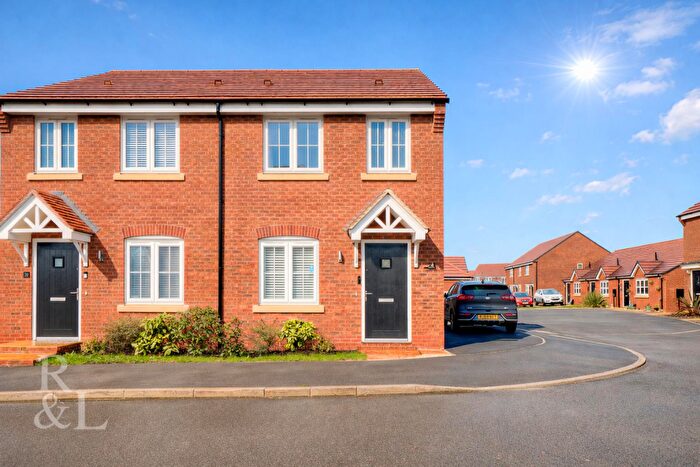
Properties for sale in Keyworth North
Roads and Postcodes in Keyworth North
Navigate through our locations to find the location of your next house in Keyworth North, Nottingham for sale or to rent.
| Streets | Postcodes |
|---|---|
| Abbot Close | NG12 5JG |
| Adams Hill | NG12 5GY |
| Beaumont Close | NG12 5JJ |
| Belvedere Close | NG12 5JF |
| Bishops Close | NG12 5LS |
| Briar Close | NG12 5JR |
| Brockdale Gardens | NG12 5HR |
| Brockwood Crescent | NG12 5HQ |
| Clifford Close | NG12 5GZ |
| Covert Close | NG12 5GB |
| Crossdale Drive | NG12 5HP |
| Debdale Lane | NG12 5HZ NG12 5JD |
| Delville Avenue | NG12 5JA |
| Feignies Court | NG12 5EU |
| Franklyn Gardens | NG12 5HX |
| Green Close | NG12 5HJ |
| Highbury Road | NG12 5JB |
| Highfield Road | NG12 5JE |
| Hillcrest Road | NG12 5JH |
| Lowlands Drive | NG12 5HG |
| Mount Pleasant | NG12 5EQ |
| Nicker Hill | NG12 5EA NG12 5EN NG12 5GD |
| Normanton Lane | NG12 5HA NG12 5HB |
| Nottingham Road | NG12 5GW |
| Park Avenue | NG12 5LU |
| Park Road | NG12 5LX |
| Park Terrace | NG12 5LW |
| Parkside | NG12 5HF |
| Platt Lane | NG12 5GE |
| Poplars Close | NG12 5HL |
| Rancliffe Avenue | NG12 5HY |
| Rose Grove | NG12 5HE |
| Sidmouth Close | NG12 5JL |
| Station Road | NG12 5HH NG12 5LT |
| Villa Road | NG12 5HD |
| Wolds Drive | NG12 5FW NG12 5GA |
Transport near Keyworth North
-
Radcliffe (Nottinghamshire) Station
-
Nottingham Station
-
Netherfield Station
-
Beeston Station
-
Carlton Station
-
Attenborough Station
-
Burton Joyce Station
-
East Midlands Parkway Station
-
Bingham Station
-
Loughborough Station
- FAQ
- Price Paid By Year
- Property Type Price
Frequently asked questions about Keyworth North
What is the average price for a property for sale in Keyworth North?
The average price for a property for sale in Keyworth North is £383,358. This amount is 36% higher than the average price in Nottingham. There are 503 property listings for sale in Keyworth North.
What streets have the most expensive properties for sale in Keyworth North?
The streets with the most expensive properties for sale in Keyworth North are Rancliffe Avenue at an average of £645,000, Briar Close at an average of £645,000 and Nicker Hill at an average of £600,000.
What streets have the most affordable properties for sale in Keyworth North?
The streets with the most affordable properties for sale in Keyworth North are Feignies Court at an average of £129,750, Brockwood Crescent at an average of £282,000 and Wolds Drive at an average of £283,200.
Which train stations are available in or near Keyworth North?
Some of the train stations available in or near Keyworth North are Radcliffe (Nottinghamshire), Nottingham and Netherfield.
Property Price Paid in Keyworth North by Year
The average sold property price by year was:
| Year | Average Sold Price | Price Change |
Sold Properties
|
|---|---|---|---|
| 2025 | £391,748 | -1% |
25 Properties |
| 2024 | £396,141 | 12% |
34 Properties |
| 2023 | £349,447 | -10% |
19 Properties |
| 2022 | £384,230 | -12% |
28 Properties |
| 2021 | £431,178 | 25% |
35 Properties |
| 2020 | £322,248 | 0,3% |
32 Properties |
| 2019 | £321,369 | -8% |
33 Properties |
| 2018 | £348,016 | 5% |
37 Properties |
| 2017 | £330,155 | -2% |
29 Properties |
| 2016 | £337,596 | 12% |
32 Properties |
| 2015 | £297,831 | 9% |
37 Properties |
| 2014 | £269,959 | 7% |
42 Properties |
| 2013 | £252,125 | 5% |
38 Properties |
| 2012 | £238,500 | -2% |
24 Properties |
| 2011 | £242,742 | 1% |
19 Properties |
| 2010 | £240,147 | -8% |
17 Properties |
| 2009 | £260,514 | 3% |
21 Properties |
| 2008 | £252,479 | 4% |
12 Properties |
| 2007 | £243,336 | -8% |
30 Properties |
| 2006 | £263,094 | 7% |
26 Properties |
| 2005 | £244,956 | 3% |
23 Properties |
| 2004 | £237,705 | 8% |
29 Properties |
| 2003 | £219,427 | 30% |
22 Properties |
| 2002 | £152,767 | 2% |
32 Properties |
| 2001 | £149,717 | 12% |
33 Properties |
| 2000 | £131,008 | 18% |
22 Properties |
| 1999 | £107,937 | 11% |
37 Properties |
| 1998 | £96,541 | 2% |
31 Properties |
| 1997 | £94,859 | 5% |
26 Properties |
| 1996 | £90,284 | -25% |
26 Properties |
| 1995 | £112,467 | - |
17 Properties |
Property Price per Property Type in Keyworth North
Here you can find historic sold price data in order to help with your property search.
The average Property Paid Price for specific property types in the last three years are:
| Property Type | Average Sold Price | Sold Properties |
|---|---|---|
| Detached House | £420,916.00 | 63 Detached Houses |
| Terraced House | £129,750.00 | 5 Terraced Houses |
| Semi Detached House | £275,687.00 | 8 Semi Detached Houses |
| Flat | £265,000.00 | 2 Flats |

