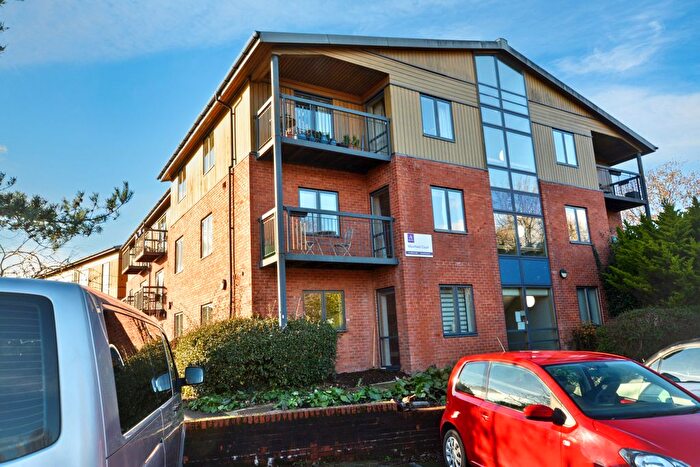
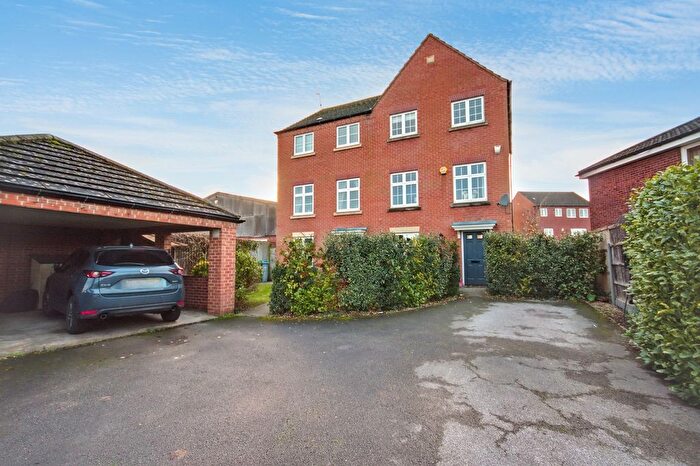
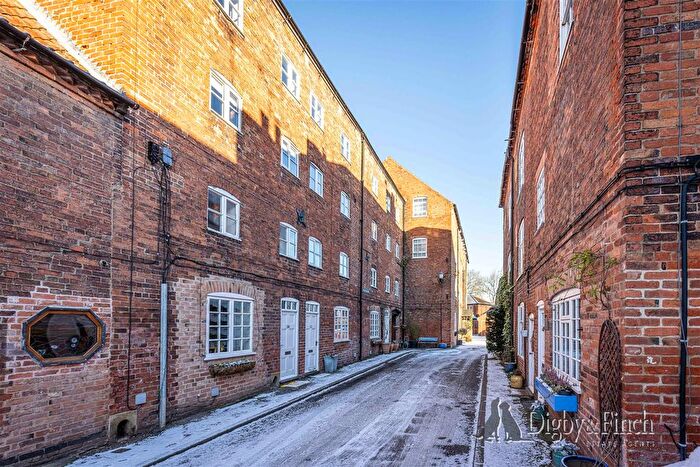
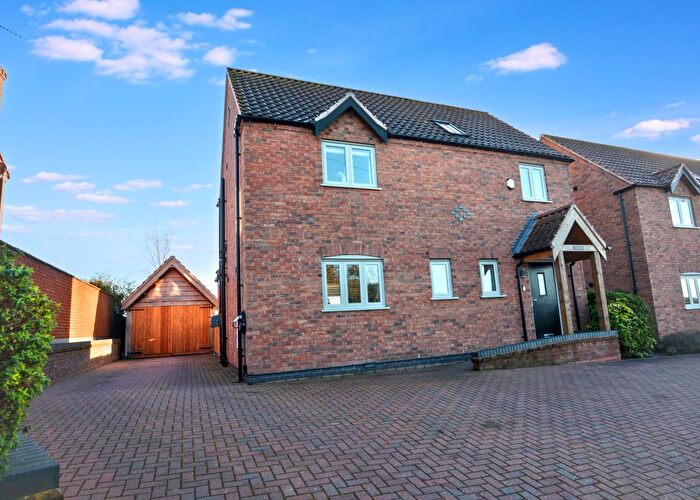
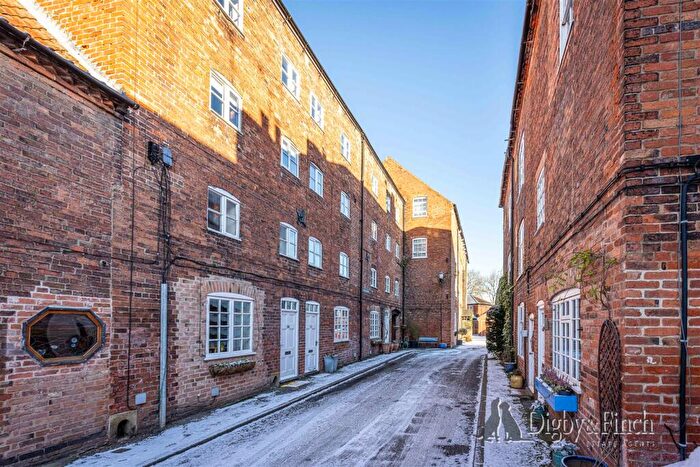
Houses for sale & to rent in Southwell East, Southwell
House Prices in Southwell East
Properties in Southwell East have an average house price of £405,828.00 and had 105 Property Transactions within the last 3 years¹.
Southwell East is an area in Southwell, Nottinghamshire with 790 households², where the most expensive property was sold for £2,000,000.00.
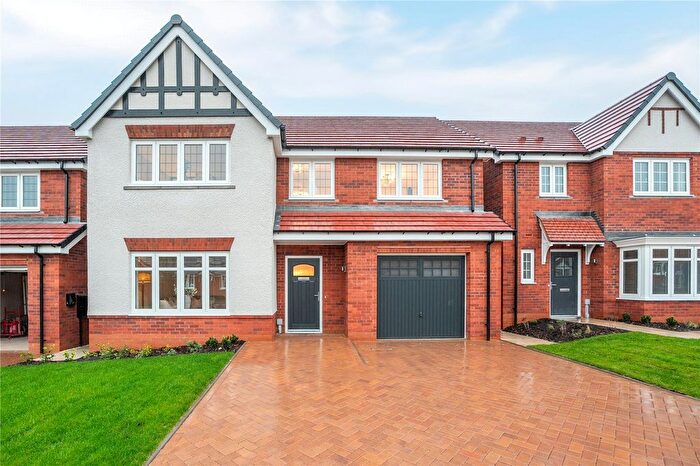
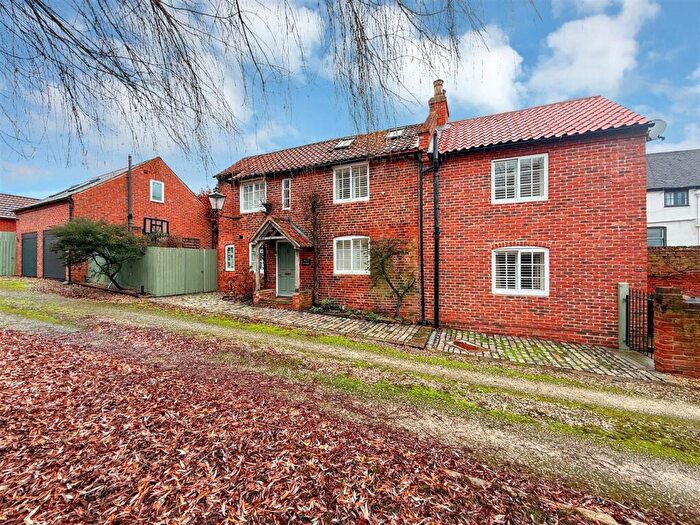
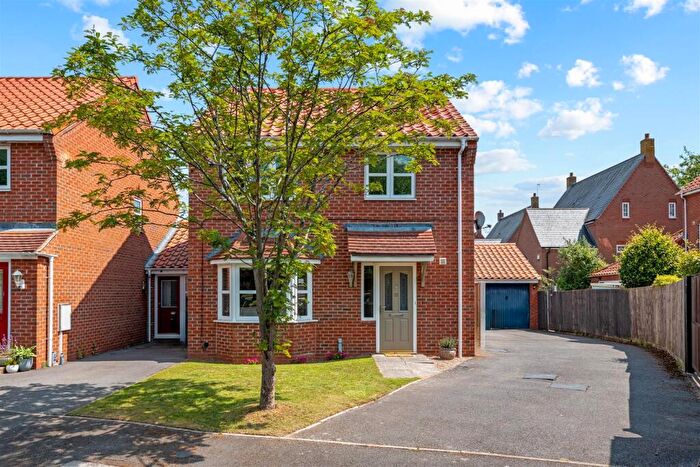
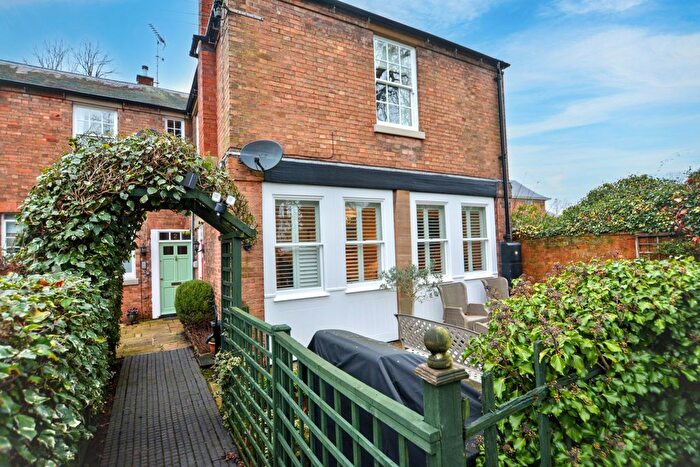
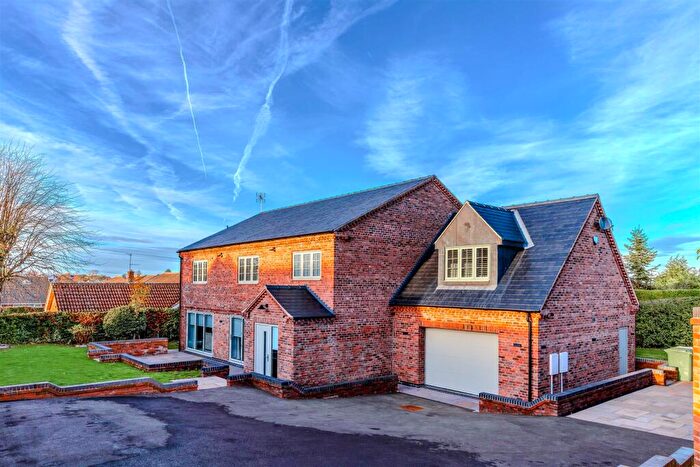
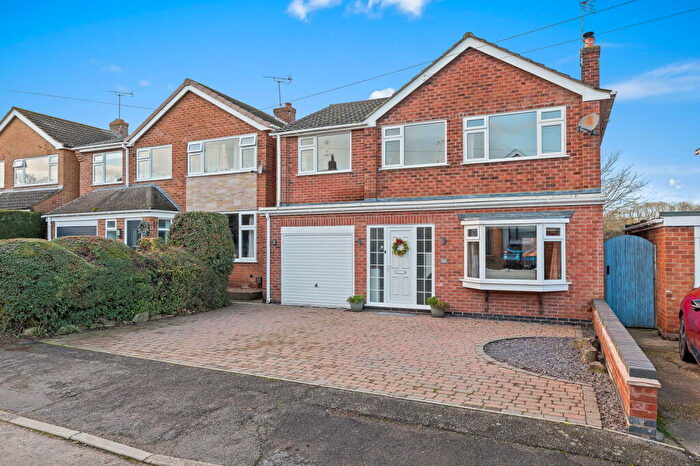
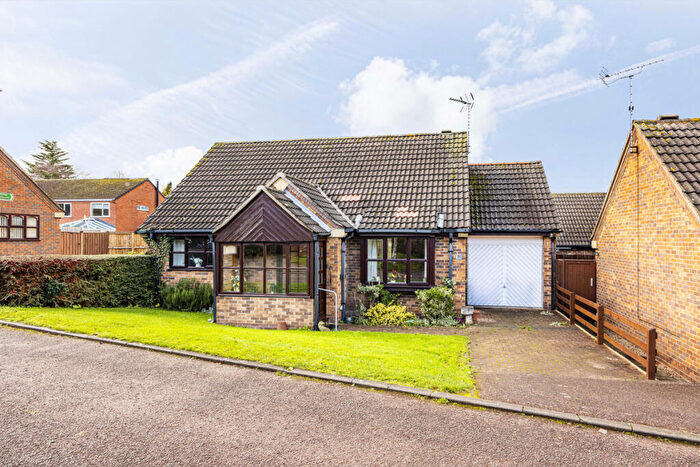
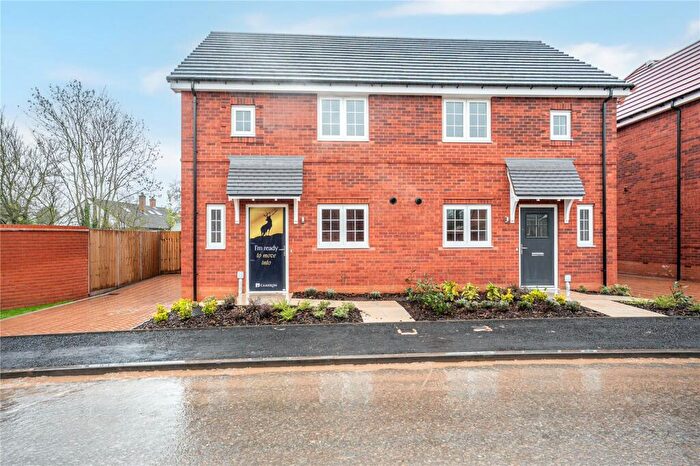
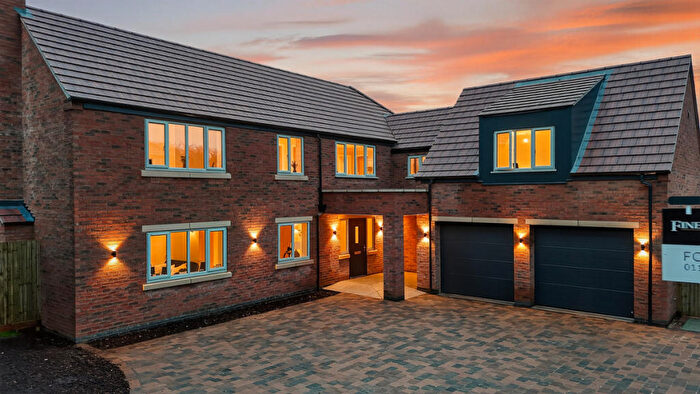
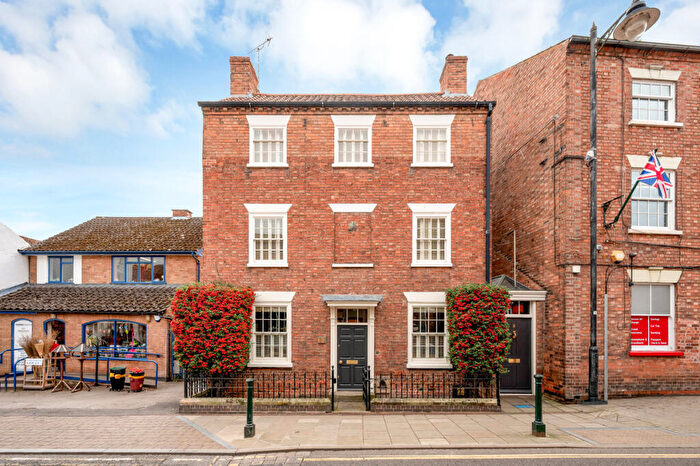
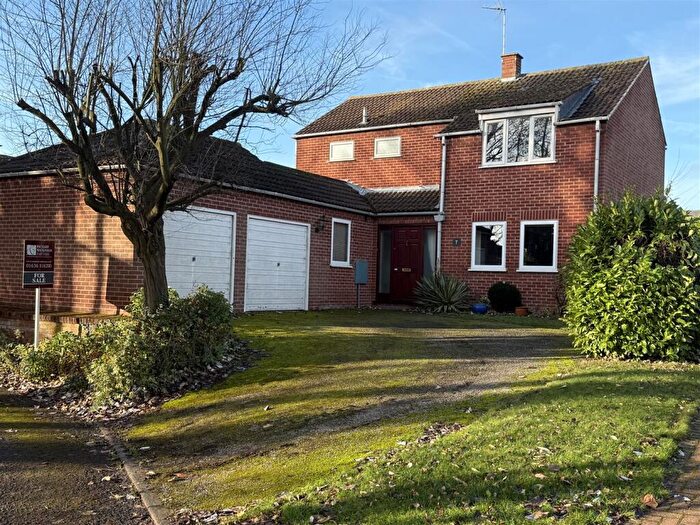
Properties for sale in Southwell East
Roads and Postcodes in Southwell East
Navigate through our locations to find the location of your next house in Southwell East, Southwell for sale or to rent.
| Streets | Postcodes |
|---|---|
| Archers Field | NG25 0RL |
| Bramley Close | NG25 0JB |
| Burgage Lane | NG25 0ER |
| Canons Close | NG25 0GA |
| Chatham Street | NG25 0EY |
| Chimes Meadow | NG25 0GB |
| Church Street | NG25 0HG NG25 0HQ |
| Corkhill Lane | NG25 0PR |
| Cottams Close | NG25 0TY |
| Crew Lane | NG25 0TX |
| Crew Lane Close | NG25 0JA |
| Dornoch Avenue | NG25 0EU |
| Dover Street | NG25 0EZ |
| Easthorpe | NG25 0HY NG25 0HZ |
| Farthingate | NG25 0HT |
| Farthingate Close | NG25 0HU |
| Fiskerton Road | NG25 0TH NG25 0TU |
| Galley Hill Road | NG25 0PX |
| Greet Park Close | NG25 0EE |
| Heywood Close | NG25 0EB |
| Hockerwood Lane | NG25 0PY |
| King Street | NG25 0EN |
| Lower Kirklington Road | NG25 0DN |
| Marrison Way | NG25 0ED |
| Meadow View | NG25 0EQ |
| Metcalfe Close | NG25 0JE |
| Newark Road | NG25 0ES |
| Palace View | NG25 0HR |
| Palmers Court | NG25 0JG |
| Pollards Lane | NG25 0TL NG25 0TN |
| Riverside | NG25 0HA |
| Station Road | NG25 0ET NG25 0GL |
| Templemans Way | NG25 0EF |
| Upton Road | NG25 0QA NG25 0QB NG25 0QX |
| Wakeling Close | NG25 0JF |
| NG25 0PS NG25 0TP |
Transport near Southwell East
- FAQ
- Price Paid By Year
- Property Type Price
Frequently asked questions about Southwell East
What is the average price for a property for sale in Southwell East?
The average price for a property for sale in Southwell East is £405,828. This amount is 4% lower than the average price in Southwell. There are 404 property listings for sale in Southwell East.
What streets have the most expensive properties for sale in Southwell East?
The streets with the most expensive properties for sale in Southwell East are Wakeling Close at an average of £627,500, Galley Hill Road at an average of £617,500 and Archers Field at an average of £528,928.
What streets have the most affordable properties for sale in Southwell East?
The streets with the most affordable properties for sale in Southwell East are Station Road at an average of £213,150, Chatham Street at an average of £249,700 and Dover Street at an average of £268,272.
Which train stations are available in or near Southwell East?
Some of the train stations available in or near Southwell East are Fiskerton, Rolleston and Bleasby.
Property Price Paid in Southwell East by Year
The average sold property price by year was:
| Year | Average Sold Price | Price Change |
Sold Properties
|
|---|---|---|---|
| 2025 | £436,666 | 21% |
21 Properties |
| 2024 | £345,000 | -19% |
31 Properties |
| 2023 | £409,571 | -8% |
21 Properties |
| 2022 | £442,060 | 17% |
32 Properties |
| 2021 | £368,122 | -4% |
59 Properties |
| 2020 | £383,170 | 21% |
41 Properties |
| 2019 | £301,031 | -15% |
24 Properties |
| 2018 | £347,295 | 9% |
44 Properties |
| 2017 | £314,828 | 0,2% |
35 Properties |
| 2016 | £314,154 | 6% |
40 Properties |
| 2015 | £294,018 | 8% |
27 Properties |
| 2014 | £270,522 | -2% |
34 Properties |
| 2013 | £275,810 | 11% |
32 Properties |
| 2012 | £245,620 | 4% |
32 Properties |
| 2011 | £234,693 | -12% |
22 Properties |
| 2010 | £262,238 | 5% |
23 Properties |
| 2009 | £249,915 | 9% |
28 Properties |
| 2008 | £226,398 | -8% |
30 Properties |
| 2007 | £244,830 | -30% |
39 Properties |
| 2006 | £317,408 | 38% |
52 Properties |
| 2005 | £197,590 | -20% |
43 Properties |
| 2004 | £237,343 | 22% |
46 Properties |
| 2003 | £184,336 | -3% |
58 Properties |
| 2002 | £189,133 | 20% |
52 Properties |
| 2001 | £151,512 | 1% |
54 Properties |
| 2000 | £149,809 | 26% |
50 Properties |
| 1999 | £111,150 | -12% |
41 Properties |
| 1998 | £124,015 | 25% |
41 Properties |
| 1997 | £92,781 | -31% |
44 Properties |
| 1996 | £121,238 | 40% |
41 Properties |
| 1995 | £73,166 | - |
36 Properties |
Property Price per Property Type in Southwell East
Here you can find historic sold price data in order to help with your property search.
The average Property Paid Price for specific property types in the last three years are:
| Property Type | Average Sold Price | Sold Properties |
|---|---|---|
| Semi Detached House | £331,565.00 | 22 Semi Detached Houses |
| Detached House | £568,795.00 | 44 Detached Houses |
| Terraced House | £288,739.00 | 23 Terraced Houses |
| Flat | £228,093.00 | 16 Flats |

