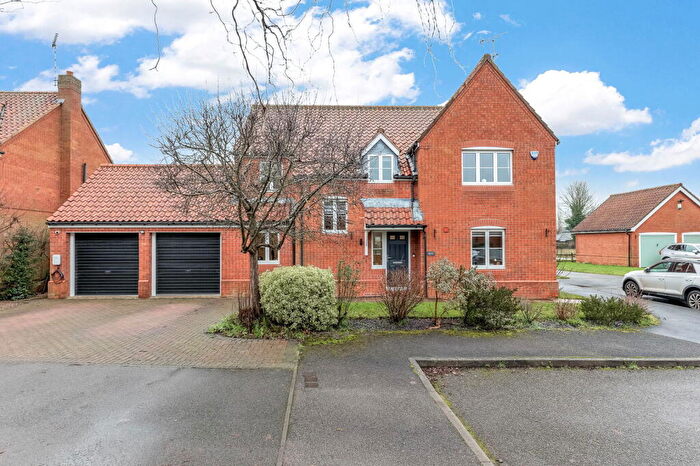
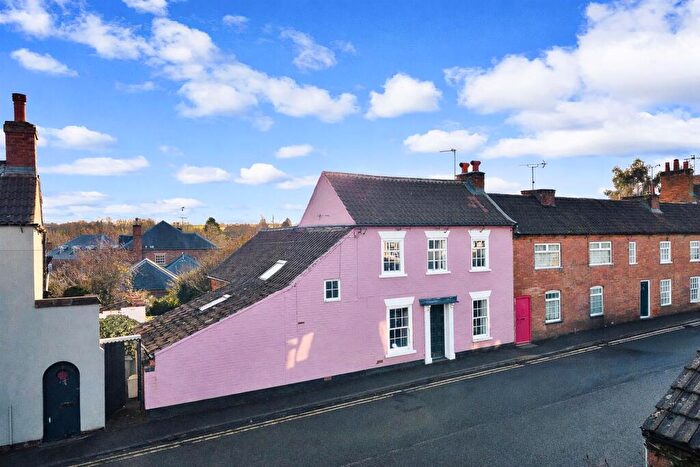
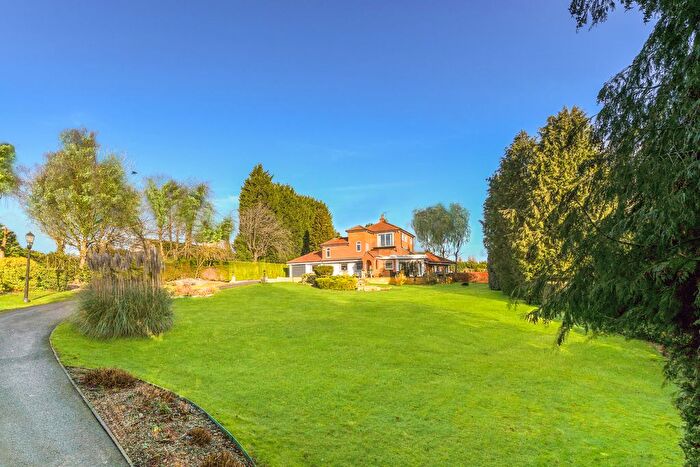
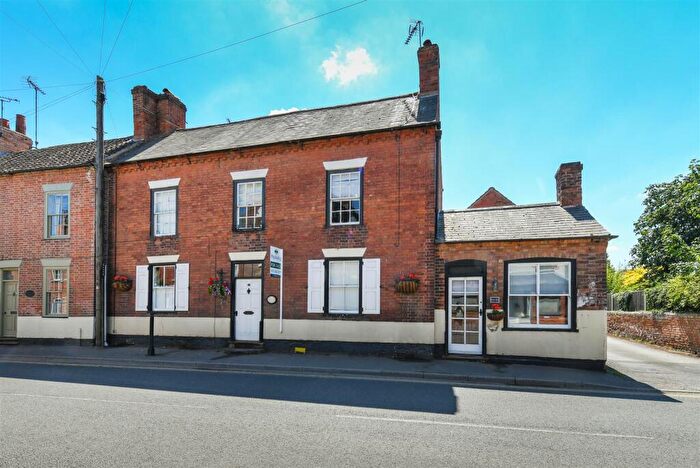
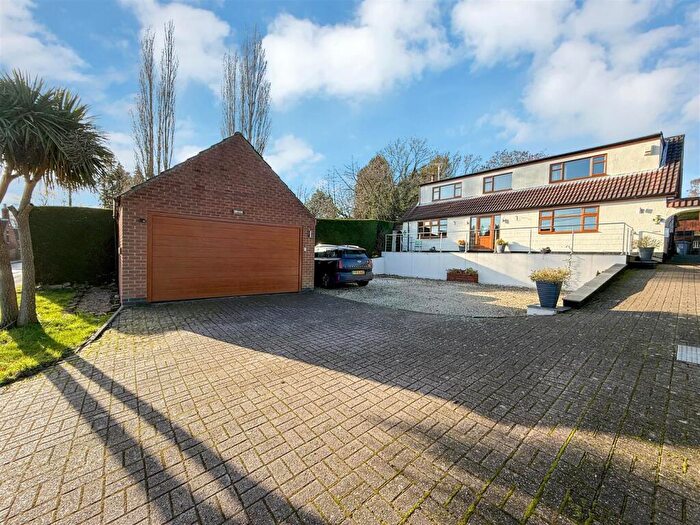
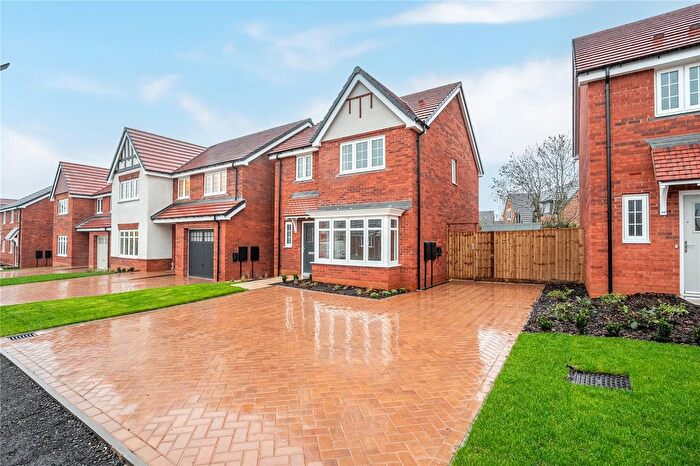
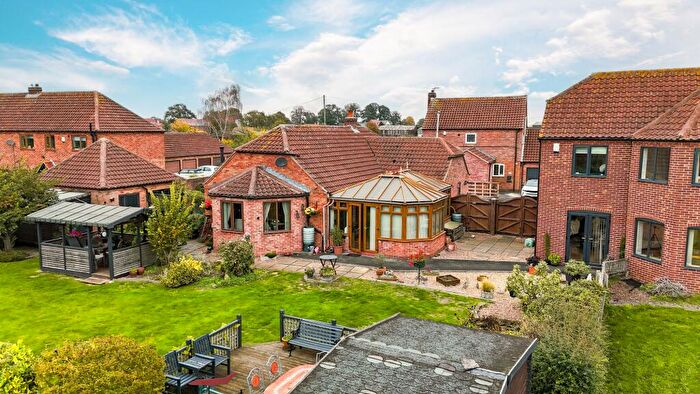
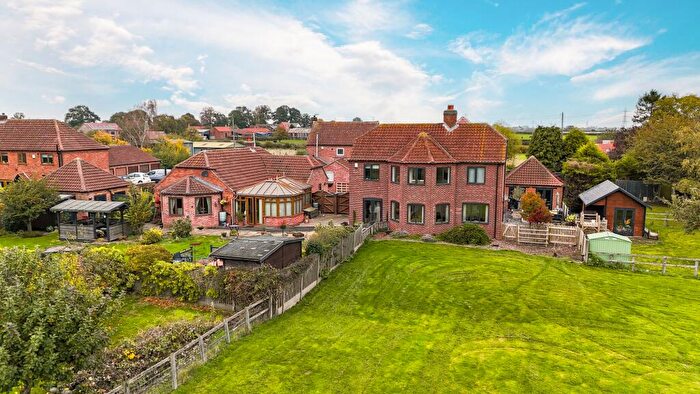
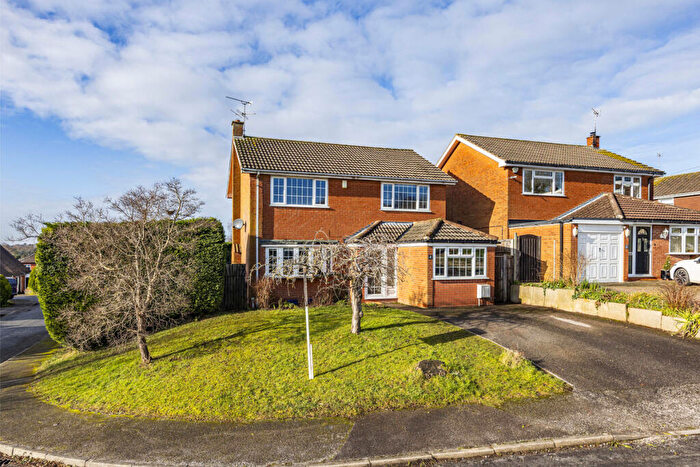
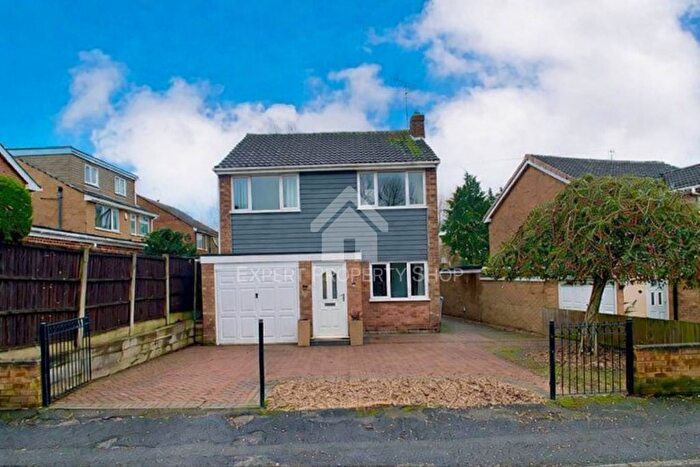
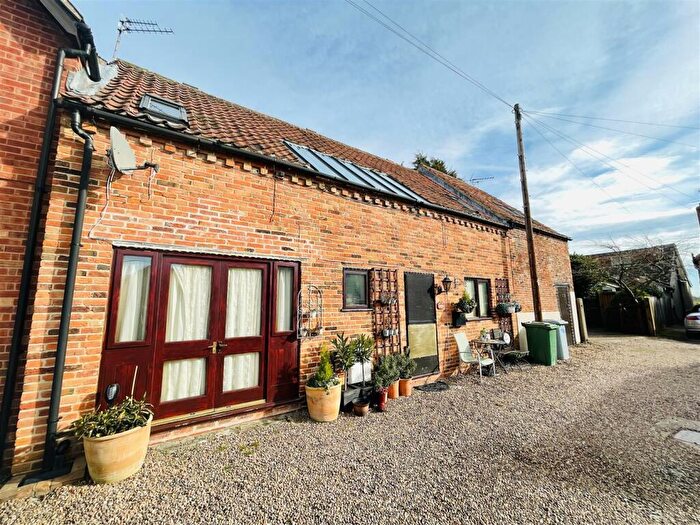
Houses for sale & to rent in Trent, Southwell
House Prices in Trent
Properties in Trent have an average house price of £623,500.00 and had 23 Property Transactions within the last 3 years¹.
Trent is an area in Southwell, Nottinghamshire with 354 households², where the most expensive property was sold for £2,400,000.00.
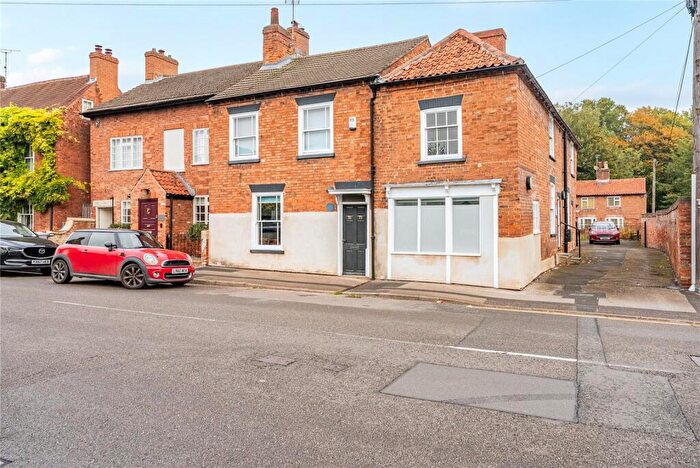
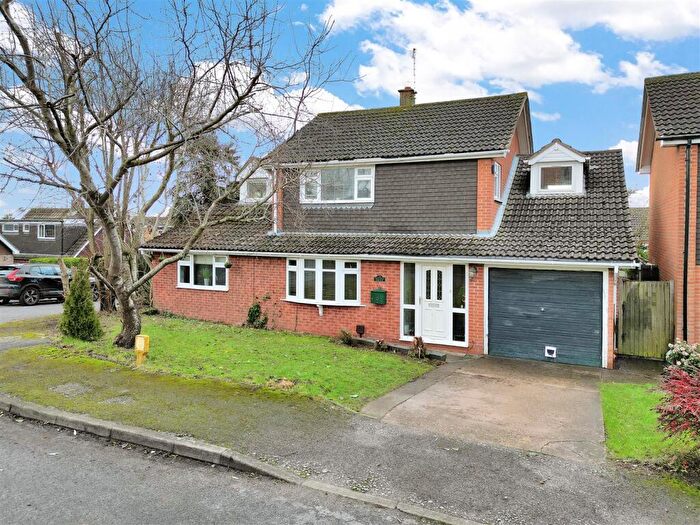
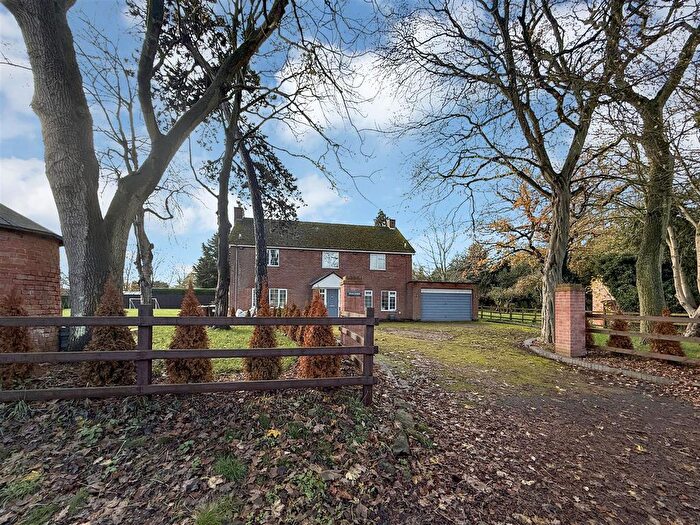
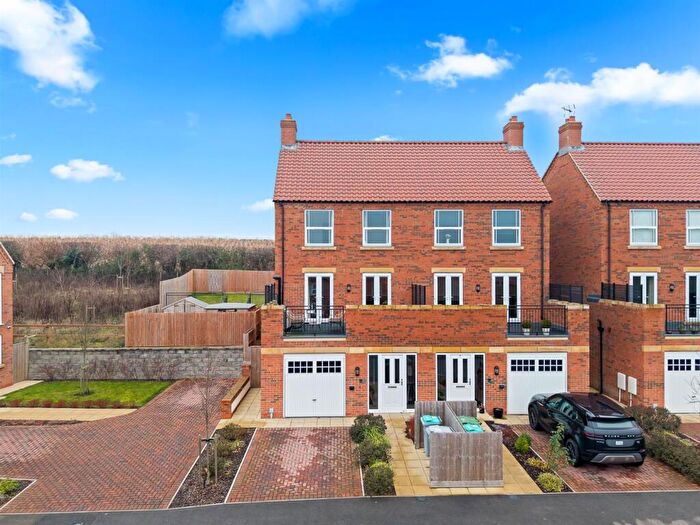
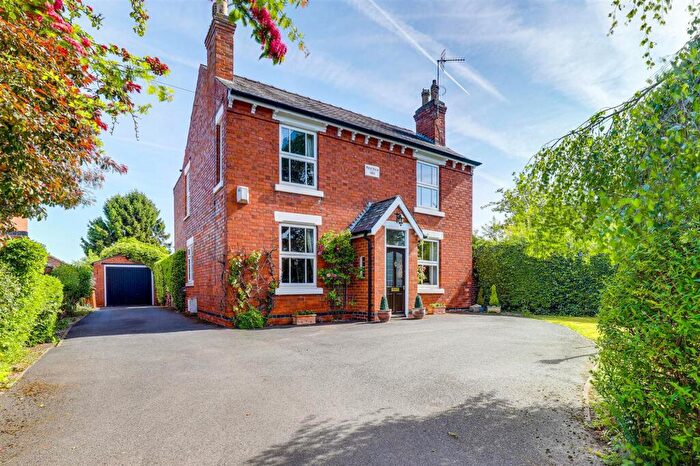
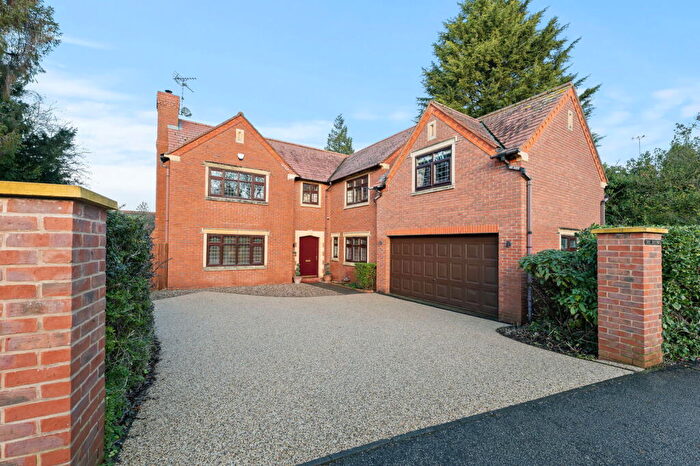
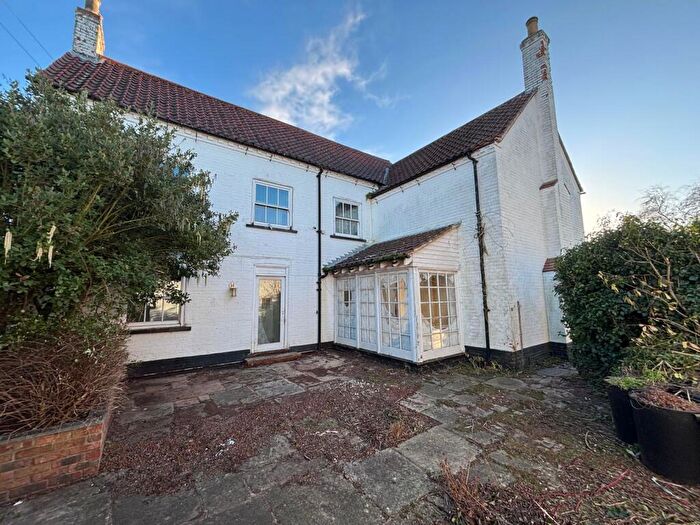
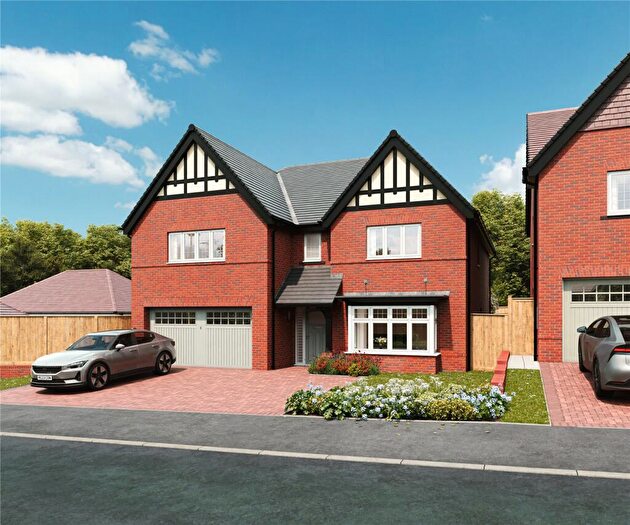
Properties for sale in Trent
Roads and Postcodes in Trent
Navigate through our locations to find the location of your next house in Trent, Southwell for sale or to rent.
| Streets | Postcodes |
|---|---|
| Back Lane | NG25 0UU |
| Bleasby Road | NG25 0XL NG25 0XJ |
| Church Lane | NG25 0UR |
| Claypit Lane | NG25 0UQ |
| Cooks Lane | NG25 0XQ |
| Daybell Close | NG25 0US |
| Gorsy Lane | NG25 0XH |
| Gravelly Lane | NG25 0UW |
| Green Drive | NG25 0UA |
| Gypsy Lane | NG25 0XN |
| Longmead Drive | NG25 0UP |
| Main Street | NG25 0UL NG25 0UN NG25 0UT NG25 0XG |
| Manor Drive | NG25 0UZ |
| Marlock Close | NG25 0UB |
| Middle Lane | NG25 0UY |
| Middlefield Road | NG25 0XB |
| Moor Lane | NG25 0UX |
| Normanton Road | NG25 0PU |
| Occupation Lane | NG25 0TR |
| Oxton Road | NG25 0RP NG25 0RW |
| Rolleston Road | NG25 0UH NG25 0UJ |
| Station Lane | NG25 0UE |
| Station Road | NG25 0UD NG25 0UG |
| Upton Road | NG25 0PT |
| Wilsons Lane | NG25 0UF |
| NG25 0XA NG25 0TS NG25 0TT |
Transport near Trent
- FAQ
- Price Paid By Year
- Property Type Price
Frequently asked questions about Trent
What is the average price for a property for sale in Trent?
The average price for a property for sale in Trent is £623,500. This amount is 46% higher than the average price in Southwell. There are 674 property listings for sale in Trent.
What streets have the most expensive properties for sale in Trent?
The streets with the most expensive properties for sale in Trent are Rolleston Road at an average of £2,400,000, Oxton Road at an average of £1,250,000 and Main Street at an average of £516,857.
What streets have the most affordable properties for sale in Trent?
The streets with the most affordable properties for sale in Trent are Gravelly Lane at an average of £404,500, Longmead Drive at an average of £449,375 and Station Road at an average of £454,000.
Which train stations are available in or near Trent?
Some of the train stations available in or near Trent are Fiskerton, Rolleston and Bleasby.
Property Price Paid in Trent by Year
The average sold property price by year was:
| Year | Average Sold Price | Price Change |
Sold Properties
|
|---|---|---|---|
| 2025 | £459,666 | -101% |
9 Properties |
| 2024 | £922,916 | 37% |
6 Properties |
| 2023 | £583,250 | 10% |
8 Properties |
| 2022 | £524,068 | -3% |
12 Properties |
| 2021 | £542,014 | 5% |
25 Properties |
| 2020 | £516,663 | 26% |
18 Properties |
| 2019 | £379,938 | -27% |
9 Properties |
| 2018 | £483,571 | 18% |
7 Properties |
| 2017 | £394,658 | -9% |
6 Properties |
| 2016 | £430,893 | -9% |
14 Properties |
| 2015 | £471,551 | 24% |
12 Properties |
| 2014 | £358,366 | 5% |
15 Properties |
| 2013 | £341,723 | 5% |
15 Properties |
| 2012 | £323,500 | -3% |
5 Properties |
| 2011 | £332,000 | -25% |
13 Properties |
| 2010 | £415,507 | 17% |
6 Properties |
| 2009 | £345,785 | -34% |
14 Properties |
| 2008 | £465,000 | 5% |
5 Properties |
| 2007 | £443,445 | 25% |
11 Properties |
| 2006 | £333,482 | 3% |
25 Properties |
| 2005 | £324,168 | 4% |
20 Properties |
| 2004 | £311,916 | 17% |
21 Properties |
| 2003 | £258,376 | 18% |
13 Properties |
| 2002 | £211,416 | 17% |
12 Properties |
| 2001 | £174,451 | 19% |
16 Properties |
| 2000 | £141,850 | -11% |
19 Properties |
| 1999 | £157,298 | 25% |
18 Properties |
| 1998 | £118,596 | 10% |
15 Properties |
| 1997 | £106,950 | -17% |
10 Properties |
| 1996 | £125,540 | -18% |
11 Properties |
| 1995 | £148,350 | - |
10 Properties |
Property Price per Property Type in Trent
Here you can find historic sold price data in order to help with your property search.
The average Property Paid Price for specific property types in the last three years are:
| Property Type | Average Sold Price | Sold Properties |
|---|---|---|
| Semi Detached House | £366,500.00 | 2 Semi Detached Houses |
| Terraced House | £322,500.00 | 2 Terraced Houses |
| Detached House | £682,236.00 | 19 Detached Houses |

