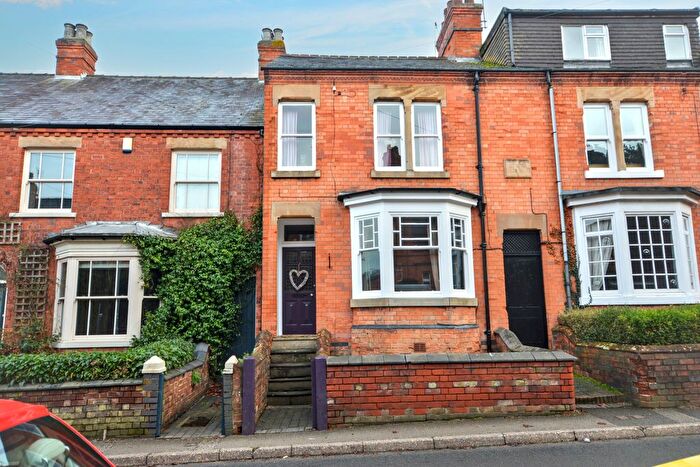
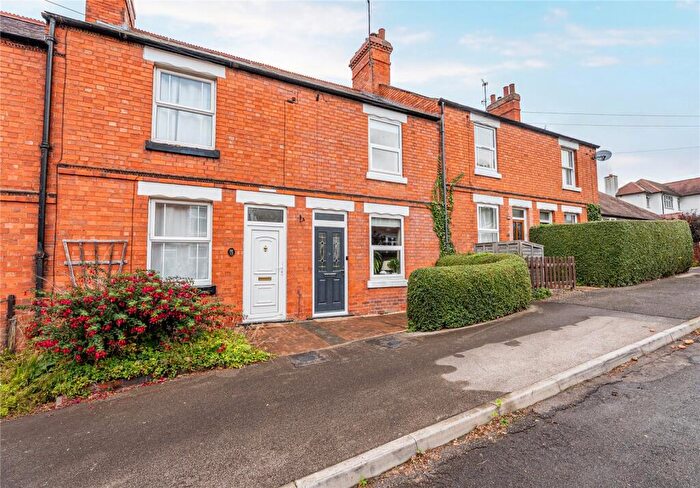
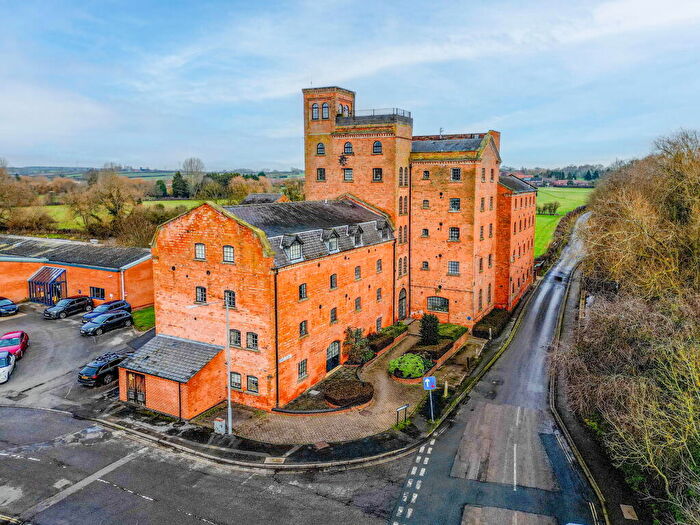
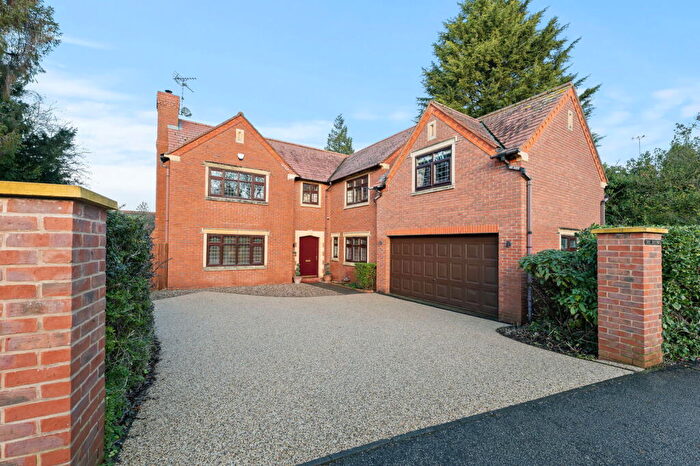
Houses for sale & to rent in Southwell North, Southwell
House Prices in Southwell North
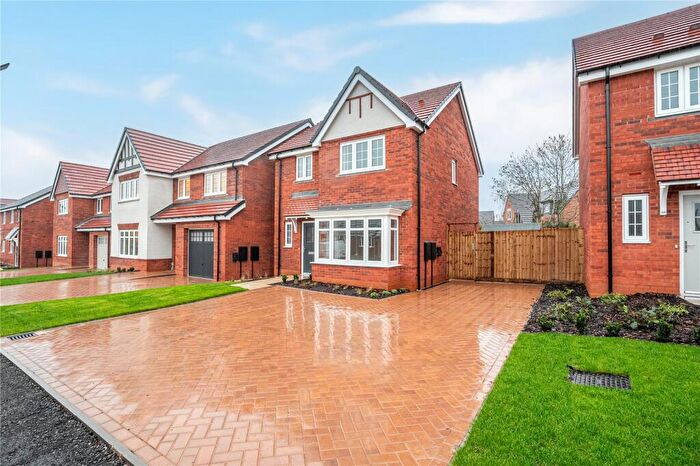
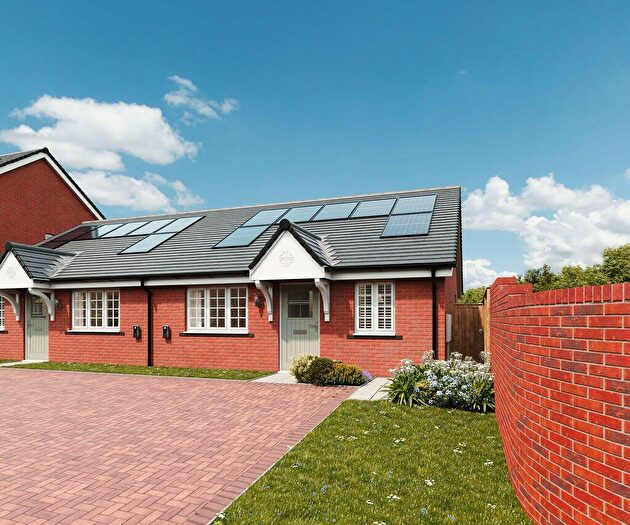
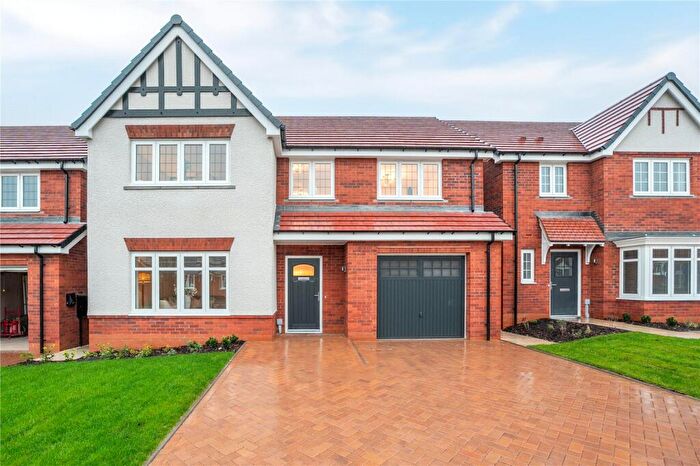
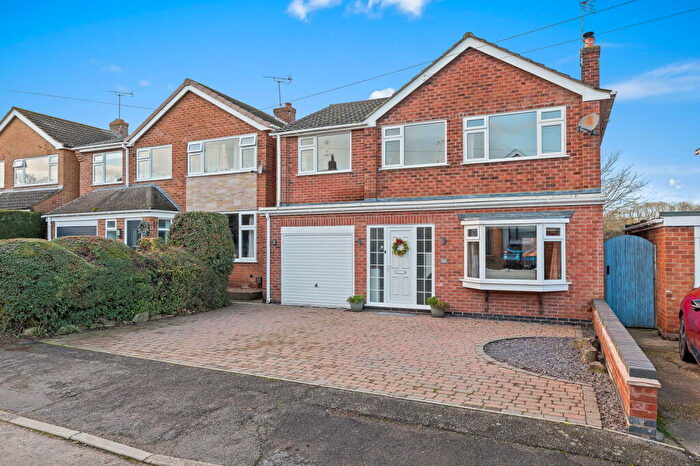
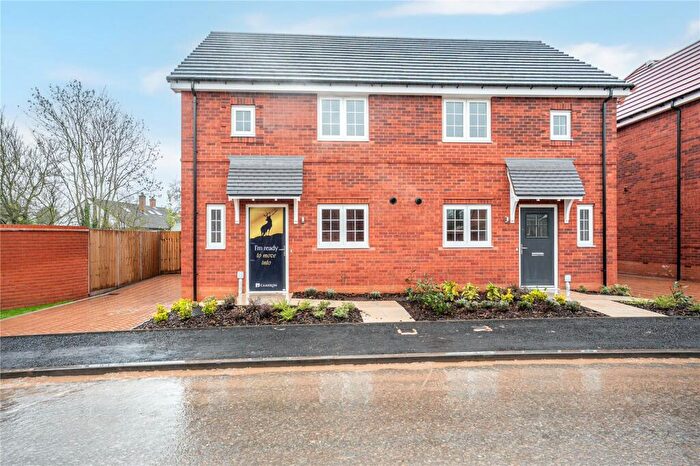
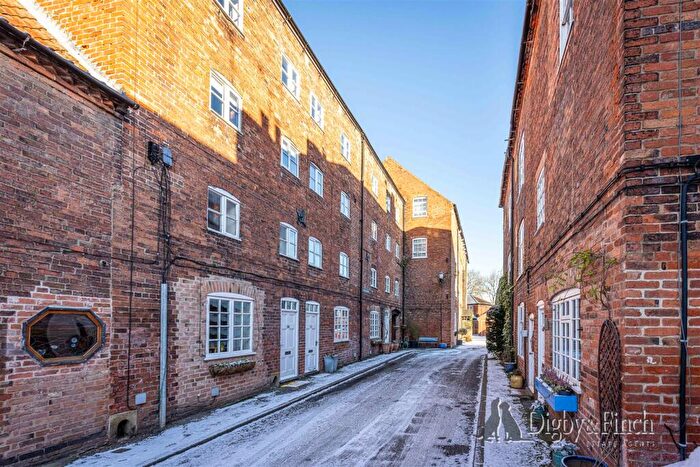
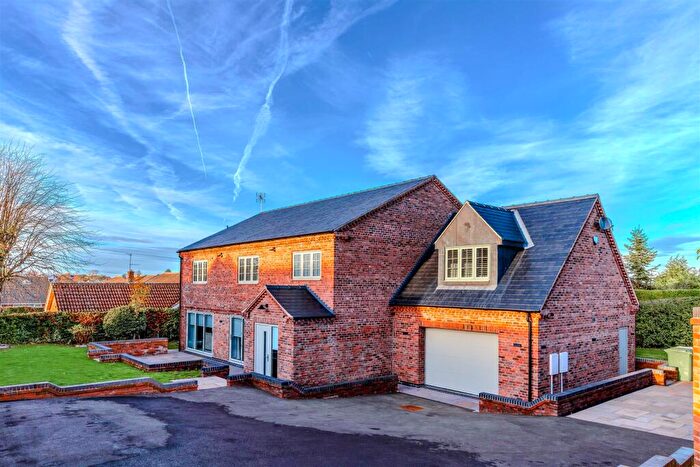
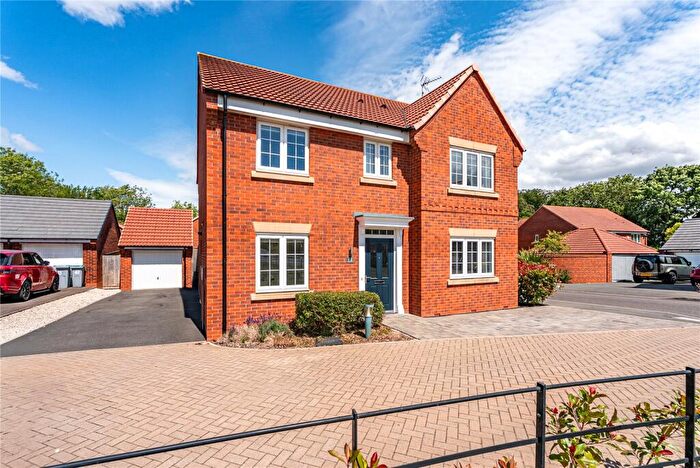
Properties in Southwell North have an average house price of £368,032.00 and had 108 Property Transactions within the last 3 years¹.
Southwell North is an area in Southwell, Nottinghamshire with 1,057 households², where the most expensive property was sold for £1,097,384.00.
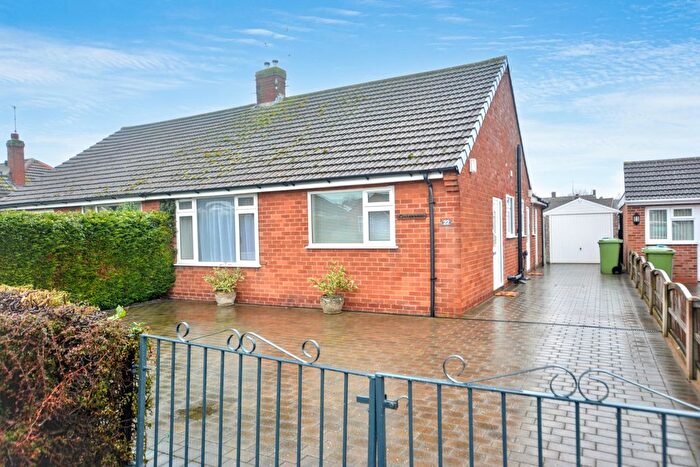
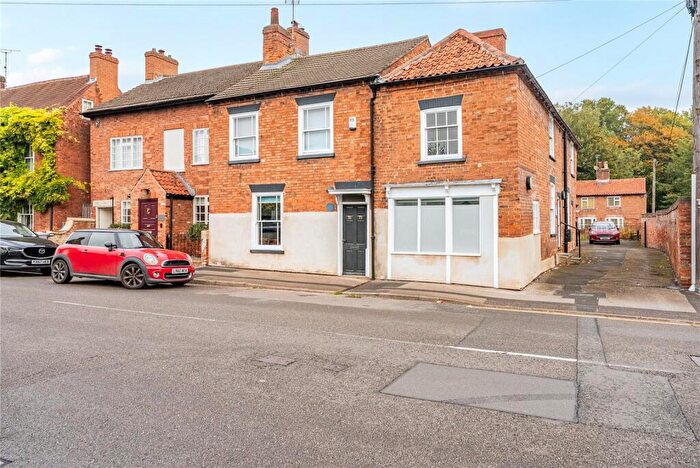
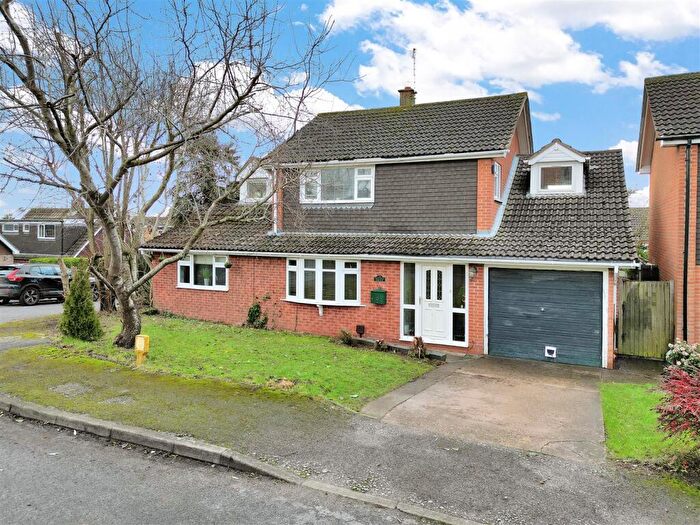
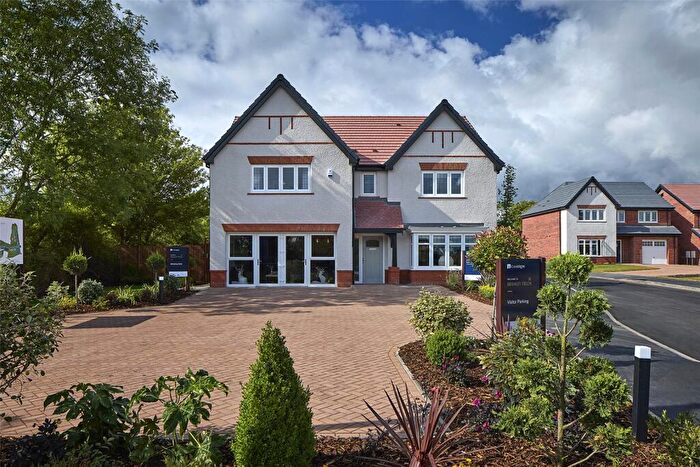
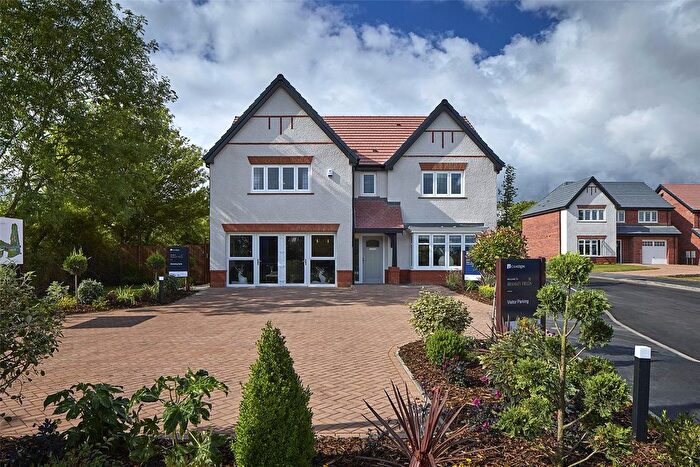
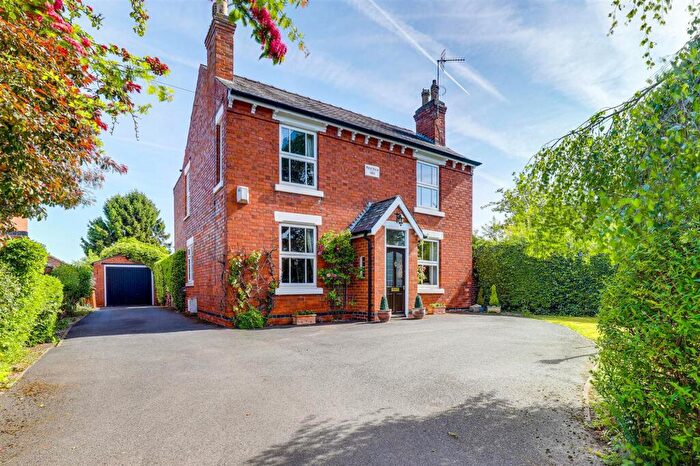
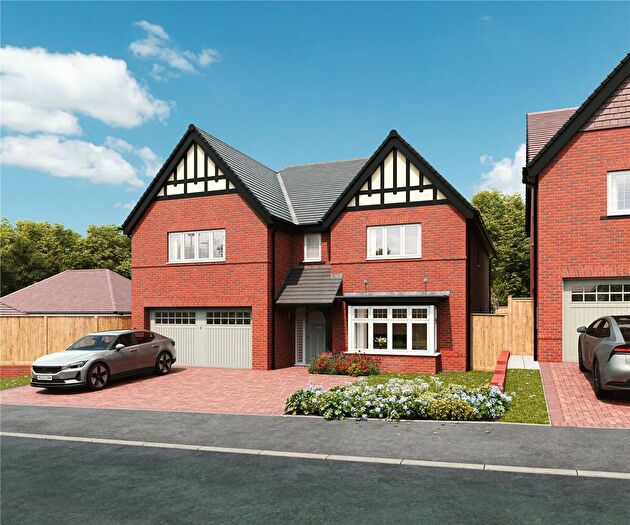
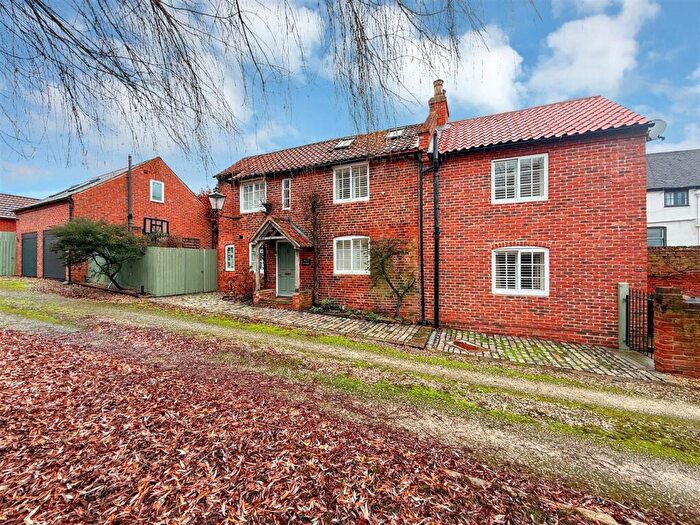
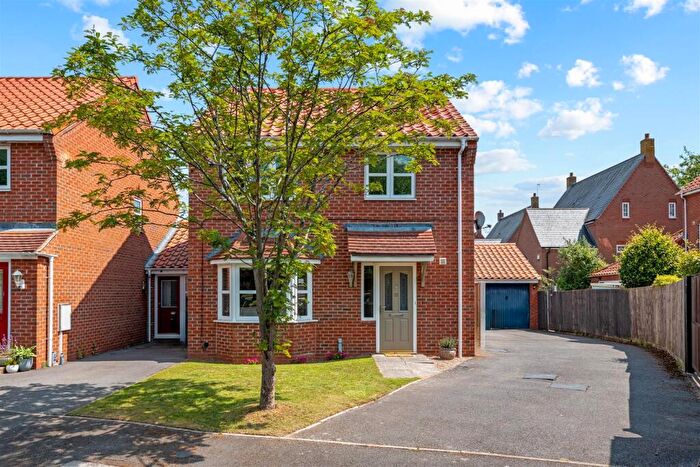
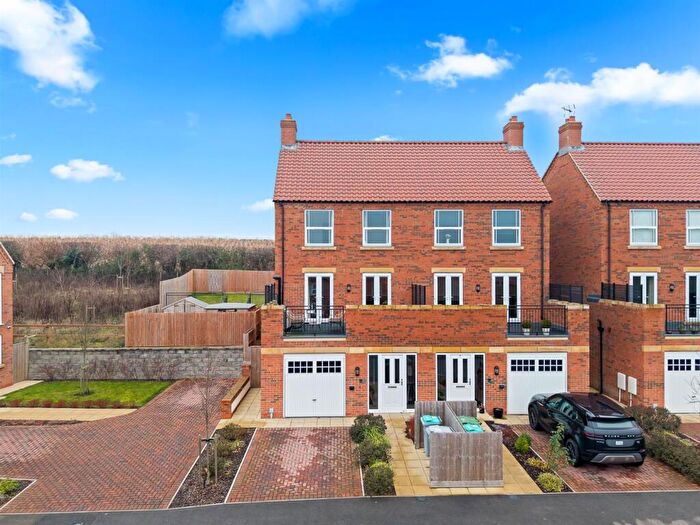
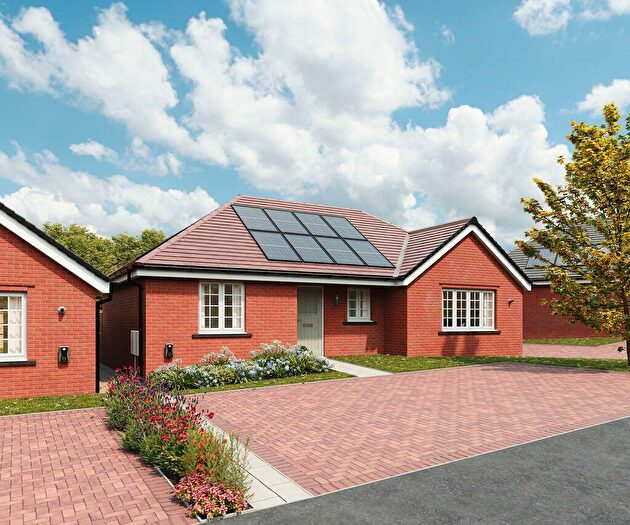
Properties for sale in Southwell North
Roads and Postcodes in Southwell North
Navigate through our locations to find the location of your next house in Southwell North, Southwell for sale or to rent.
| Streets | Postcodes |
|---|---|
| Abbey Mews | NG25 0EX |
| Apple Tree Close | NG25 0AN |
| Arnold Avenue | NG25 0BP |
| Birchwood Close | NG25 0DE |
| Burgage | NG25 0EP |
| Byron Gardens | NG25 0DW |
| Caudwell Close | NG25 0DF |
| Crafts Way | NG25 0BL |
| Fern Close | NG25 0DB |
| Hop Yard | NG25 0RT |
| King Street | NG25 0EH |
| Kings Court | NG25 0EL |
| Kirkby Close | NG25 0DG |
| Kirklington Close | NG25 0FA |
| Kirklington Road | NG25 0AX NG25 0AY NG25 0RU |
| Leeks Close | NG25 0BA |
| Leeway Road | NG25 0BW NG25 0BX NG25 0BZ |
| Lower Kirklington Road | NG25 0BH NG25 0DP NG25 0DR NG25 0DX |
| Manor Close | NG25 0AP |
| Merryweather Close | NG25 0BN |
| Monckton Drive | NG25 0AW |
| Norwood Gardens | NG25 0DS NG25 0DT |
| Nursery End | NG25 0BY |
| Orchard Close | NG25 0DY |
| Pinewood Close | NG25 0DD |
| Private Road | NG25 0EJ |
| Raysmith Close | NG25 0BG |
| Ridgeway | NG25 0DU |
| Sheppards Row | NG25 0AB |
| Silvey Avenue | NG25 0BU |
| Springfield Road | NG25 0BS NG25 0BT |
| Stenton Close | NG25 0BJ |
| Teresa Court | NG25 0EA |
| The Combes | NG25 0DQ |
| The Cottages | NG25 0RS |
| The Ropewalk | NG25 0AJ NG25 0AL |
| Woodland Drive | NG25 0DA |
Transport near Southwell North
- FAQ
- Price Paid By Year
- Property Type Price
Frequently asked questions about Southwell North
What is the average price for a property for sale in Southwell North?
The average price for a property for sale in Southwell North is £368,032. This amount is 13% lower than the average price in Southwell. There are 351 property listings for sale in Southwell North.
What streets have the most expensive properties for sale in Southwell North?
The streets with the most expensive properties for sale in Southwell North are Burgage at an average of £658,333, The Ropewalk at an average of £568,000 and Kirkby Close at an average of £523,333.
What streets have the most affordable properties for sale in Southwell North?
The streets with the most affordable properties for sale in Southwell North are King Street at an average of £152,500, Abbey Mews at an average of £204,000 and The Cottages at an average of £204,987.
Which train stations are available in or near Southwell North?
Some of the train stations available in or near Southwell North are Fiskerton, Rolleston and Bleasby.
Property Price Paid in Southwell North by Year
The average sold property price by year was:
| Year | Average Sold Price | Price Change |
Sold Properties
|
|---|---|---|---|
| 2025 | £365,212 | 8% |
24 Properties |
| 2024 | £334,205 | -19% |
39 Properties |
| 2023 | £398,852 | 16% |
45 Properties |
| 2022 | £334,194 | 6% |
38 Properties |
| 2021 | £314,604 | 14% |
64 Properties |
| 2020 | £270,655 | -2% |
47 Properties |
| 2019 | £277,293 | -8% |
38 Properties |
| 2018 | £298,777 | 13% |
44 Properties |
| 2017 | £259,308 | 10% |
43 Properties |
| 2016 | £233,456 | -0,4% |
51 Properties |
| 2015 | £234,450 | 2% |
41 Properties |
| 2014 | £229,427 | 6% |
37 Properties |
| 2013 | £216,347 | -4% |
47 Properties |
| 2012 | £225,911 | -1% |
40 Properties |
| 2011 | £227,202 | 2% |
34 Properties |
| 2010 | £222,185 | 14% |
40 Properties |
| 2009 | £190,517 | -2% |
42 Properties |
| 2008 | £193,662 | -15% |
24 Properties |
| 2007 | £222,986 | 5% |
44 Properties |
| 2006 | £211,016 | 0,3% |
76 Properties |
| 2005 | £210,338 | 13% |
47 Properties |
| 2004 | £182,125 | 11% |
43 Properties |
| 2003 | £162,540 | 6% |
42 Properties |
| 2002 | £152,471 | 26% |
40 Properties |
| 2001 | £112,372 | 16% |
54 Properties |
| 2000 | £94,415 | 8% |
47 Properties |
| 1999 | £87,258 | -7% |
40 Properties |
| 1998 | £93,054 | 20% |
50 Properties |
| 1997 | £74,635 | 3% |
47 Properties |
| 1996 | £72,714 | 1% |
42 Properties |
| 1995 | £72,117 | - |
37 Properties |
Property Price per Property Type in Southwell North
Here you can find historic sold price data in order to help with your property search.
The average Property Paid Price for specific property types in the last three years are:
| Property Type | Average Sold Price | Sold Properties |
|---|---|---|
| Semi Detached House | £284,132.00 | 31 Semi Detached Houses |
| Detached House | £438,190.00 | 65 Detached Houses |
| Terraced House | £208,500.00 | 6 Terraced Houses |
| Flat | £201,000.00 | 6 Flats |

