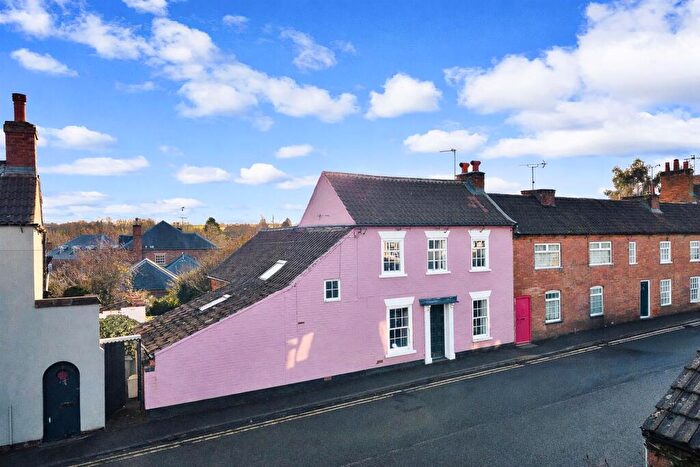
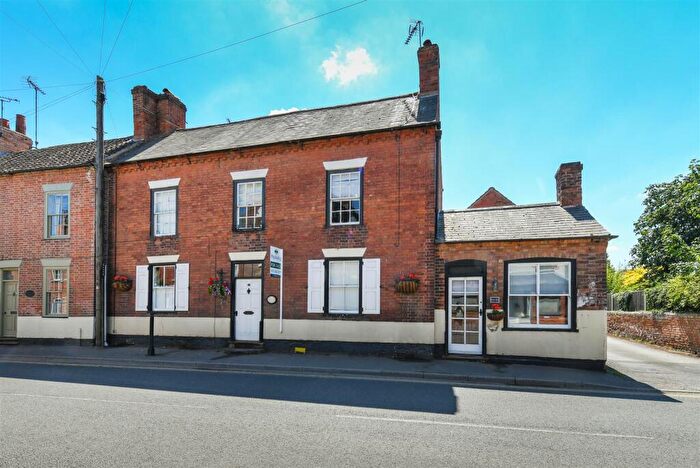
Houses for sale & to rent in Southwell West, Southwell
House Prices in Southwell West
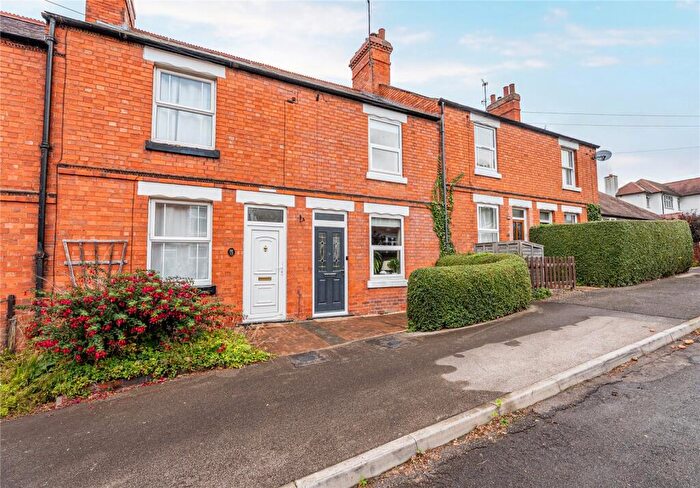
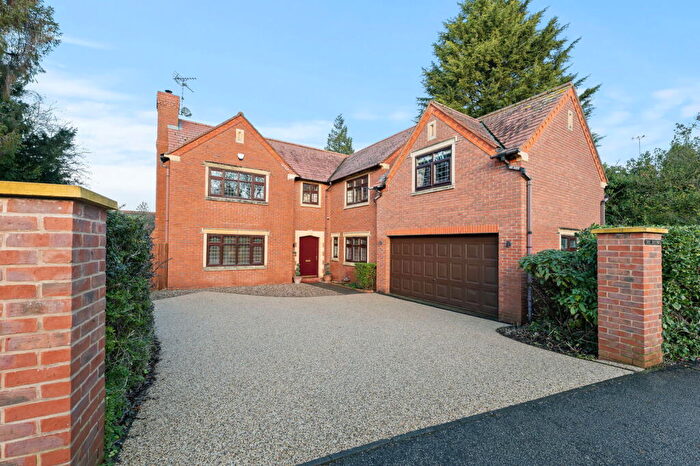
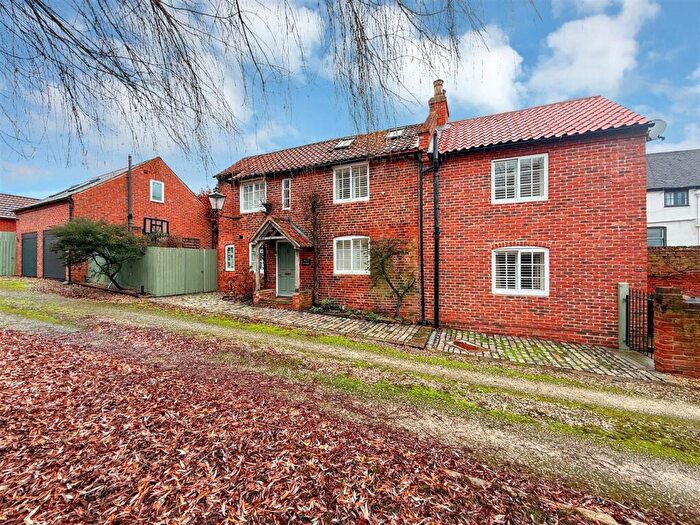
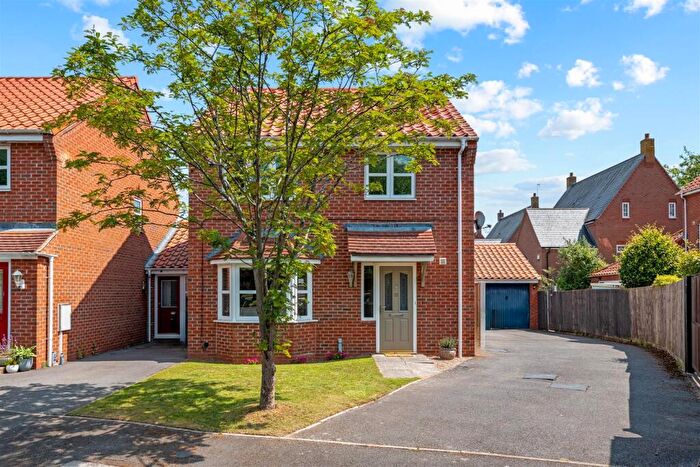
Properties in Southwell West have an average house price of £456,873.00 and had 101 Property Transactions within the last 3 years¹.
Southwell West is an area in Southwell, Nottinghamshire with 1,109 households², where the most expensive property was sold for £2,175,000.00.
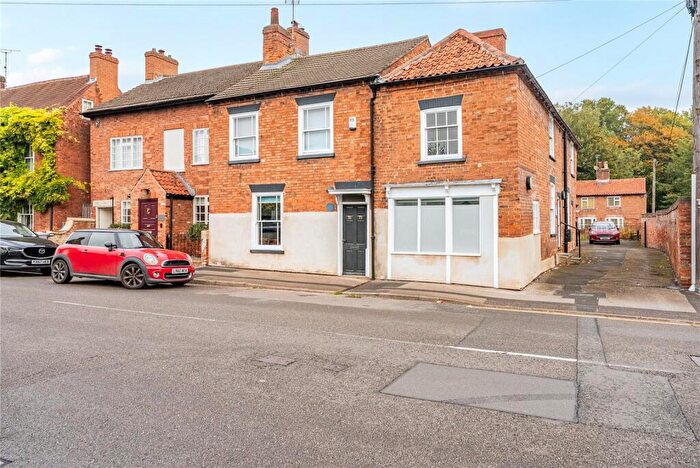
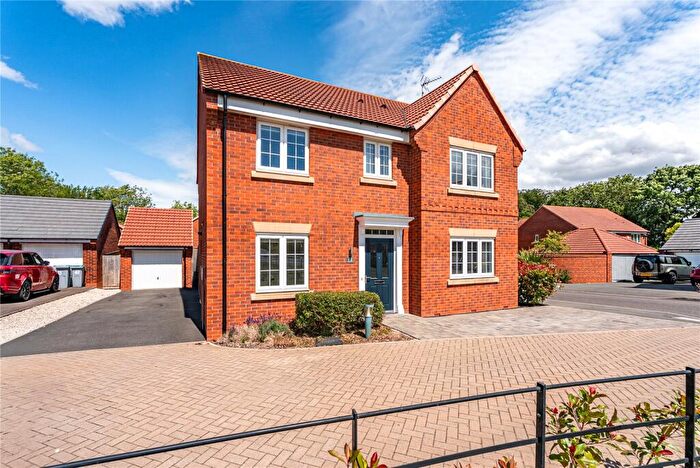
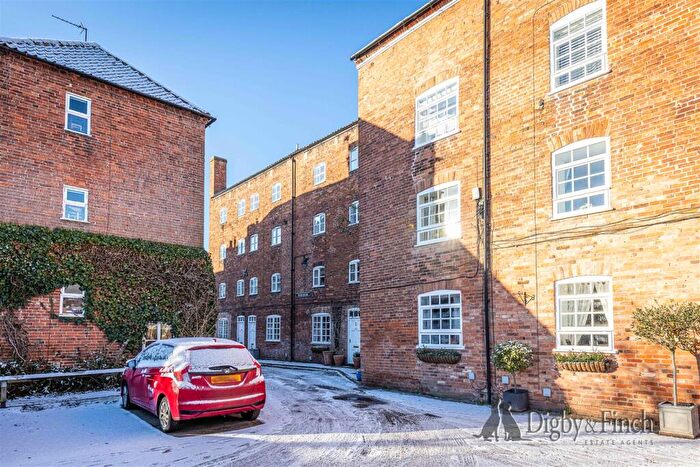
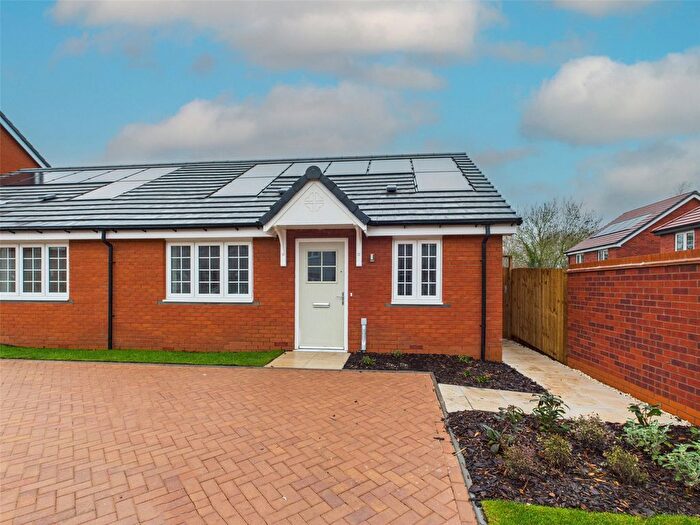
Properties for sale in Southwell West
Roads and Postcodes in Southwell West
Navigate through our locations to find the location of your next house in Southwell West, Southwell for sale or to rent.
| Streets | Postcodes |
|---|---|
| Adams Row | NG25 0FF |
| Allenby Road | NG25 0NL |
| Ash Tree Close | NG25 0LA |
| Beaumont Avenue | NG25 0BB |
| Bishops Drive | NG25 0JP |
| Brook Walk | NG25 0FN |
| Cedar Green | NG25 0FJ |
| Chatsworth Avenue | NG25 0AE |
| Coghill Court | NG25 0LH |
| Cooks Lane | NG25 0PD |
| Dudley Doy Road | NG25 0NJ |
| Dunham Close | NG25 0JU |
| Eastfield Court | NG25 0NU |
| Glenfields | NG25 0AS |
| Halam Road | NG25 0AD NG25 0AH NG25 0PA NG25 0PQ |
| Halloughton Road | NG25 0LP NG25 0LR |
| Handford Court | NG25 0HH |
| Hillcrest | NG25 0AQ |
| Hillside Drive | NG25 0JZ |
| Honing Drive | NG25 0LB |
| Hopkiln Lane | NG25 0AU |
| Howard Terrace | NG25 0LN |
| Humberstone Road | NG25 0FE |
| Kirklington Road | NG25 0AR NG25 0AT |
| Landseer Road | NG25 0LX NG25 0LZ |
| Lowes Wong | NG25 0JS |
| Mayhill | NG25 0BE |
| Micklebarrow Close | NG25 0LU |
| Moorfield Court | NG25 0LW |
| Nottingham Road | NG25 0LF NG25 0LG NG25 0QW |
| Oxton Road | NG25 0NH NG25 0QY NG25 0QZ NG25 0RA |
| Park Lane | NG25 0QN |
| Park Terrace | NG25 0LQ |
| Queen Street | NG25 0AA |
| Saversick Lane | NG25 0PG |
| Tathams Orchard | NG25 0FL |
| The Holme | NG25 0NF |
| The Jubilee | NG25 0FP |
| The Paddocks | NG25 0NR |
| The Riddings | NG25 0BD |
| The West Lawns | NG25 0JW |
| Trinity Place | NG25 0LE |
| Trinity Road | NG25 0NP NG25 0NW |
| Vicarage Road | NG25 0NN |
| Wands Close | NG25 0JT |
| Warrands Close | NG25 0NT |
| Westgate | NG25 0JH NG25 0JN NG25 0JX NG25 0LD NG25 0LS NG25 0LT |
| Westgate Mews | NG25 0LL |
| Westhorpe | NG25 0NB NG25 0ND NG25 0NE NG25 0NG |
| Wolsey Close | NG25 0AZ |
| Woodland View | NG25 0AG |
| NG25 0QP |
Transport near Southwell West
- FAQ
- Price Paid By Year
- Property Type Price
Frequently asked questions about Southwell West
What is the average price for a property for sale in Southwell West?
The average price for a property for sale in Southwell West is £456,873. This amount is 7% higher than the average price in Southwell. There are 387 property listings for sale in Southwell West.
What streets have the most expensive properties for sale in Southwell West?
The streets with the most expensive properties for sale in Southwell West are Park Lane at an average of £925,000, Tathams Orchard at an average of £680,000 and The Holme at an average of £662,500.
What streets have the most affordable properties for sale in Southwell West?
The streets with the most affordable properties for sale in Southwell West are Moorfield Court at an average of £153,333, Howard Terrace at an average of £184,000 and Wolsey Close at an average of £218,577.
Which train stations are available in or near Southwell West?
Some of the train stations available in or near Southwell West are Fiskerton, Bleasby and Rolleston.
Property Price Paid in Southwell West by Year
The average sold property price by year was:
| Year | Average Sold Price | Price Change |
Sold Properties
|
|---|---|---|---|
| 2025 | £399,668 | -24% |
27 Properties |
| 2024 | £494,414 | 9% |
45 Properties |
| 2023 | £451,879 | 10% |
29 Properties |
| 2022 | £406,824 | -13% |
40 Properties |
| 2021 | £458,192 | 10% |
44 Properties |
| 2020 | £412,609 | 19% |
36 Properties |
| 2019 | £333,587 | -5% |
31 Properties |
| 2018 | £350,710 | 12% |
33 Properties |
| 2017 | £307,945 | -2% |
43 Properties |
| 2016 | £313,537 | 2% |
41 Properties |
| 2015 | £306,975 | 0,4% |
29 Properties |
| 2014 | £305,745 | -4% |
33 Properties |
| 2013 | £319,089 | 13% |
44 Properties |
| 2012 | £278,689 | -1% |
34 Properties |
| 2011 | £280,803 | -4% |
26 Properties |
| 2010 | £292,522 | 3% |
42 Properties |
| 2009 | £284,332 | 2% |
47 Properties |
| 2008 | £277,239 | -23% |
43 Properties |
| 2007 | £341,506 | 12% |
72 Properties |
| 2006 | £301,571 | 3% |
62 Properties |
| 2005 | £291,875 | 11% |
48 Properties |
| 2004 | £259,106 | 15% |
53 Properties |
| 2003 | £219,721 | 23% |
59 Properties |
| 2002 | £168,131 | 14% |
51 Properties |
| 2001 | £144,562 | 17% |
52 Properties |
| 2000 | £119,754 | -17% |
54 Properties |
| 1999 | £139,618 | 15% |
64 Properties |
| 1998 | £118,579 | 22% |
70 Properties |
| 1997 | £92,681 | -3% |
33 Properties |
| 1996 | £95,715 | 4% |
44 Properties |
| 1995 | £92,192 | - |
19 Properties |
Property Price per Property Type in Southwell West
Here you can find historic sold price data in order to help with your property search.
The average Property Paid Price for specific property types in the last three years are:
| Property Type | Average Sold Price | Sold Properties |
|---|---|---|
| Semi Detached House | £398,676.00 | 17 Semi Detached Houses |
| Detached House | £550,548.00 | 62 Detached Houses |
| Terraced House | £271,180.00 | 15 Terraced Houses |
| Flat | £166,428.00 | 7 Flats |

