
Houses for sale & to rent in OL2 6BJ, Edge Hill Avenue, Royton South, Oldham
House Prices in OL2 6BJ, Edge Hill Avenue, Royton South
Properties in OL2 6BJ have no sales history available within the last 3 years. OL2 6BJ is a postcode in Edge Hill Avenue located in Royton South, an area in Oldham, Oldham, with 6 households².
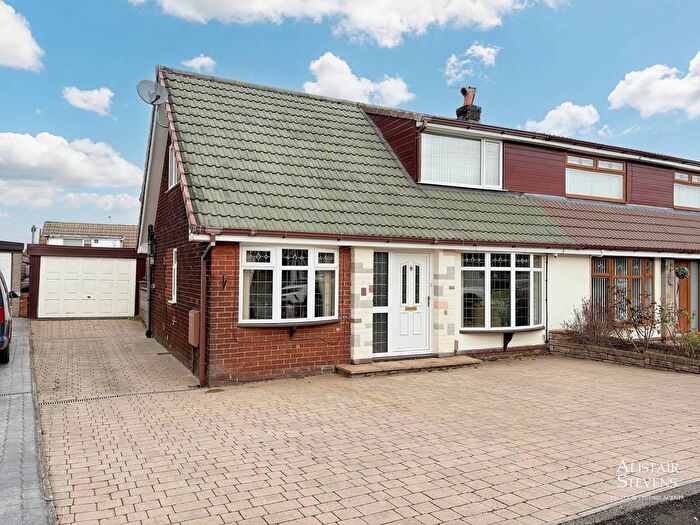
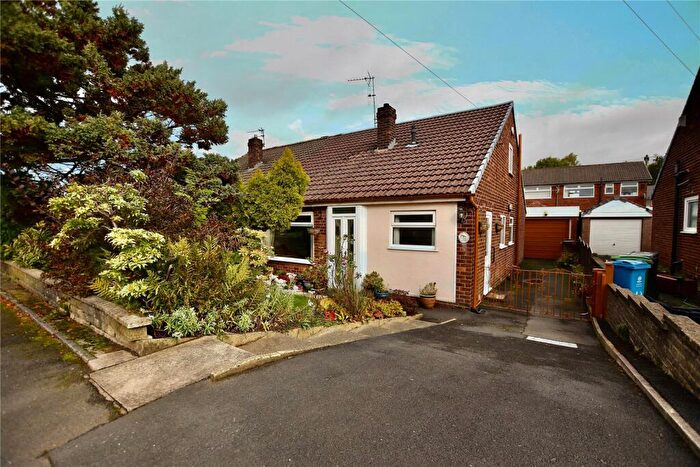
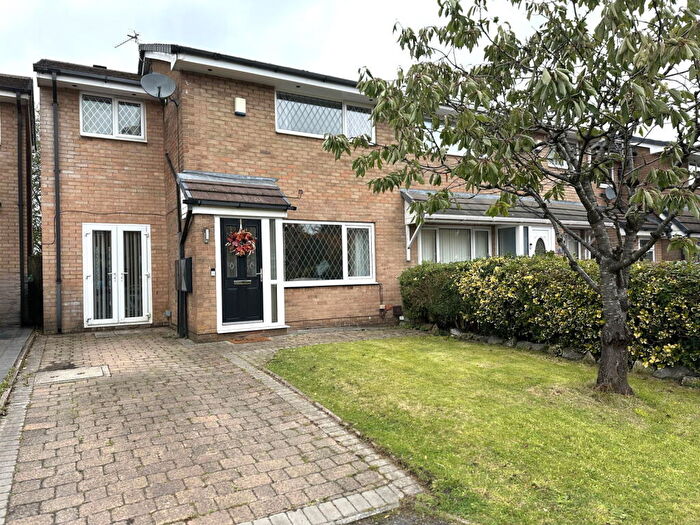
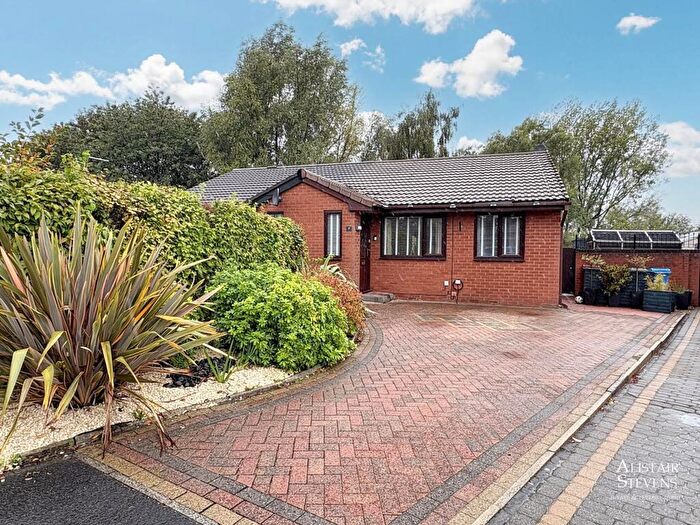
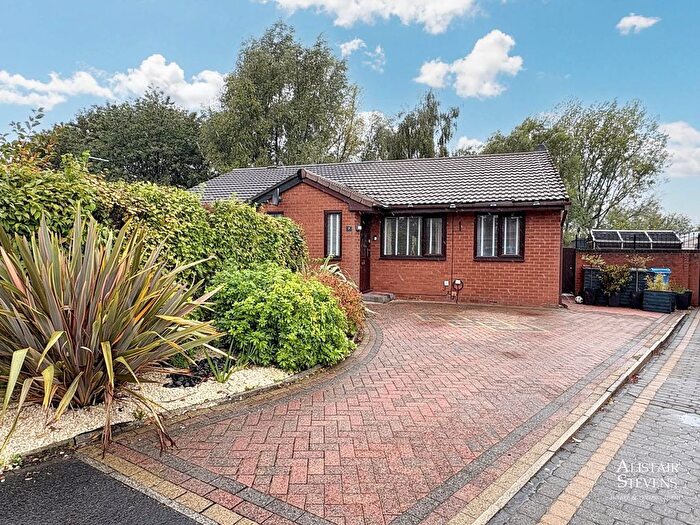
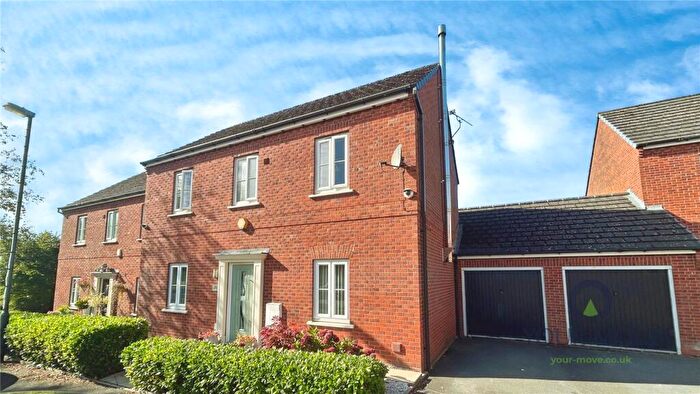
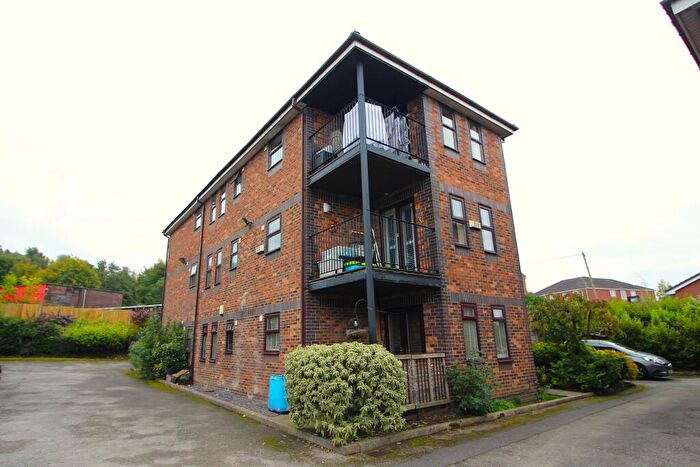
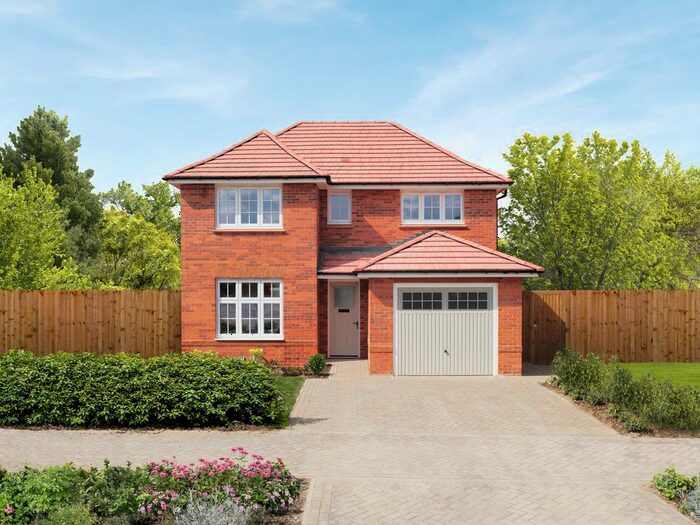
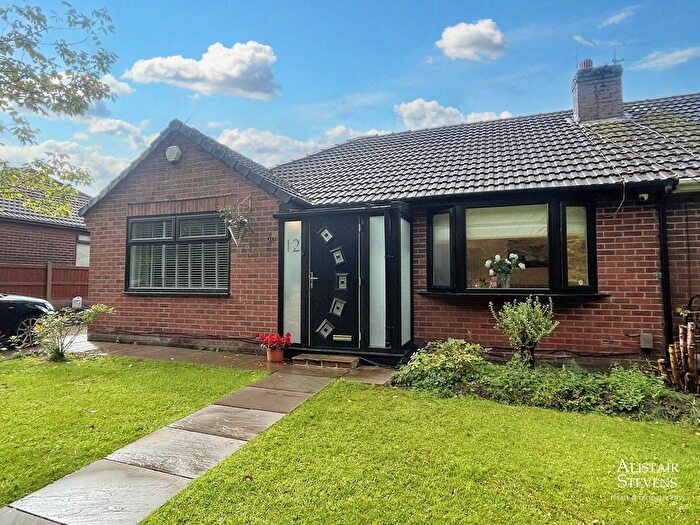
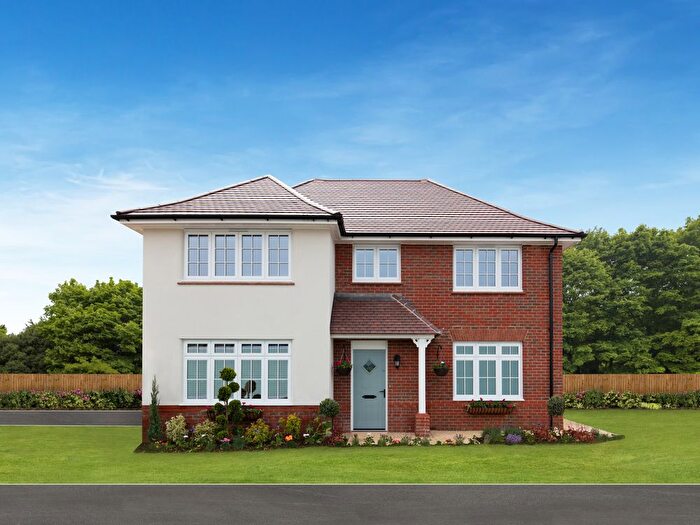
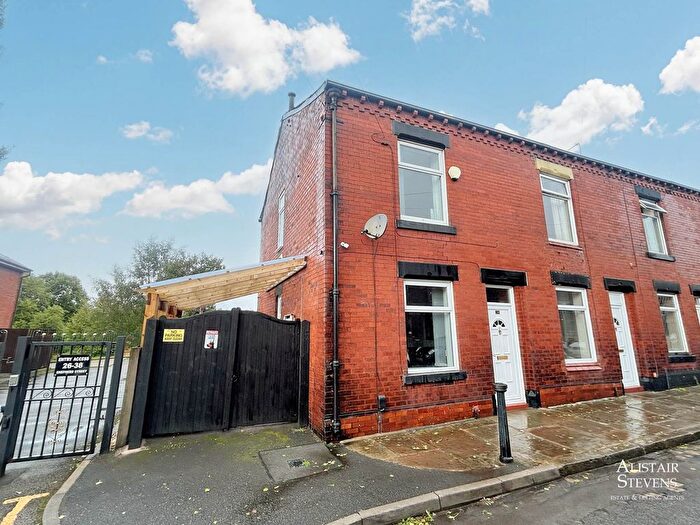
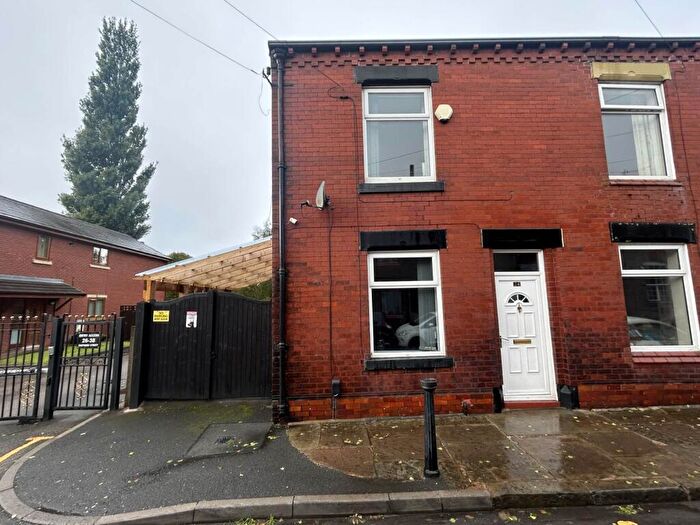
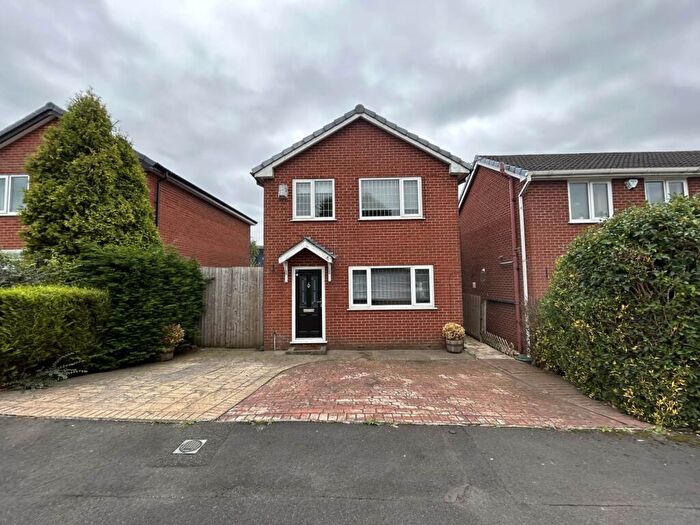
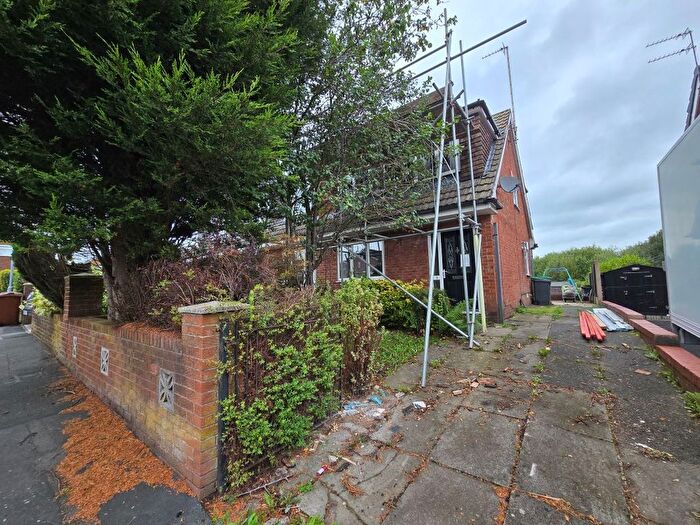
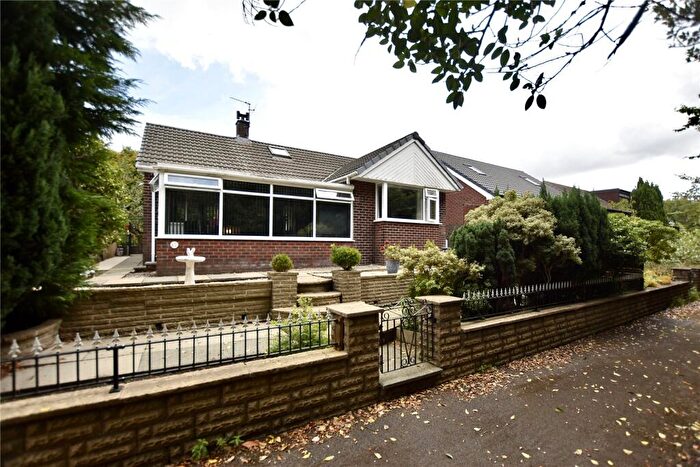
Properties for sale near OL2 6BJ, Edge Hill Avenue

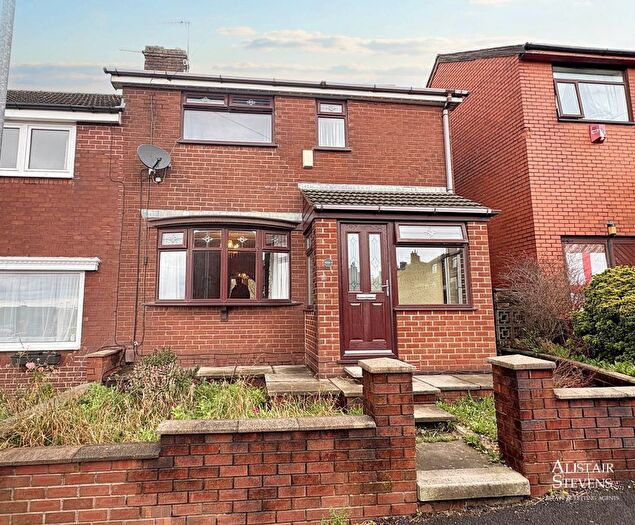

![]()
If you are looking to sell your house, let it out, or receive a property valuation, an expert can help you.
Click the button below to get started.


Price Paid in Edge Hill Avenue, OL2 6BJ, Royton South
6 Edge Hill Avenue, OL2 6BJ, Royton South Oldham
Property 6 has been sold 5 times. The last time it was sold was in 29/01/2021 and the sold price was £274,950.00.
This semi detached house, sold as a leasehold on 29/01/2021, is a 115 sqm semi-detached house with an EPC rating of D.
| Date | Price | Property Type | Tenure | Classification |
|---|---|---|---|---|
| 29/01/2021 | £274,950.00 | Semi Detached House | leasehold | Established Building |
| 26/11/2010 | £202,000.00 | Semi Detached House | leasehold | Established Building |
| 16/02/2007 | £145,000.00 | Semi Detached House | leasehold | Established Building |
| 06/12/2002 | £98,000.00 | Semi Detached House | leasehold | Established Building |
| 29/04/1997 | £53,500.00 | Semi Detached House | leasehold | Established Building |
1 Edge Hill Avenue, OL2 6BJ, Royton South Oldham
Property 1 has been sold 1 time. The last time it was sold was in 24/05/2018 and the sold price was £154,000.00.
This detached house, sold as a leasehold on 24/05/2018, is a 68 sqm detached bungalow with an EPC rating of D.
| Date | Price | Property Type | Tenure | Classification |
|---|---|---|---|---|
| 24/05/2018 | £154,000.00 | Detached House | leasehold | Established Building |
Transport near OL2 6BJ, Edge Hill Avenue
-
 Mills Hill Station
 -
Moston Station
-
Castleton Station
-
Rochdale Station
-
Mossley (Greater Manchester) Station
-
Greenfield Station
-
Ashton-Under-Lyne Station
House price paid reports for OL2 6BJ, Edge Hill Avenue
Click on the buttons below to see price paid reports by year or property price:
- Price Paid By Year
Property Price Paid in OL2 6BJ, Edge Hill Avenue by Year
The average sold property price by year was:
| Year | Average Sold Price | Price Change |
Sold Properties
|
|---|---|---|---|
| 2021 | £274,950 | 44% |
1 Property |
| 2018 | £154,000 | -31% |
1 Property |
| 2010 | £202,000 | 28% |
1 Property |
| 2007 | £145,000 | 32% |
1 Property |
| 2002 | £98,000 | 45% |
1 Property |
| 1997 | £53,500 | - |
1 Property |