
Houses for sale in Harwell, Didcot
House Prices in Harwell
Properties in Harwell have an average house price of £506k and had 181 Property Transactions within the last 3 years¹.
Harwell is an area in Didcot, Oxfordshire with 1,493 households², where the most expensive property was sold for £2.6M.
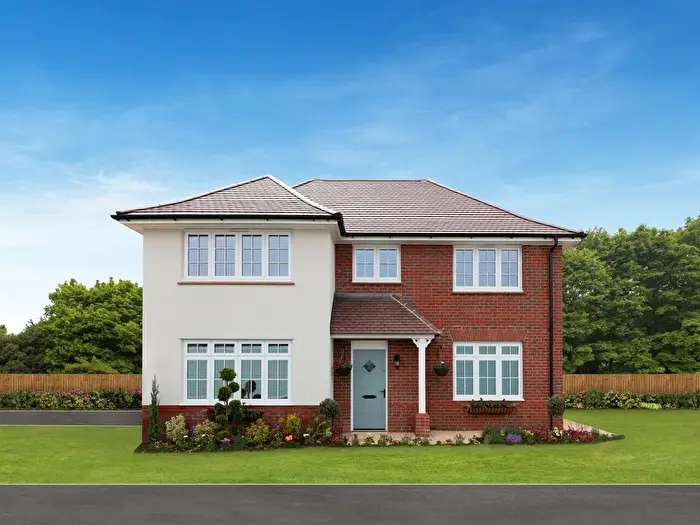
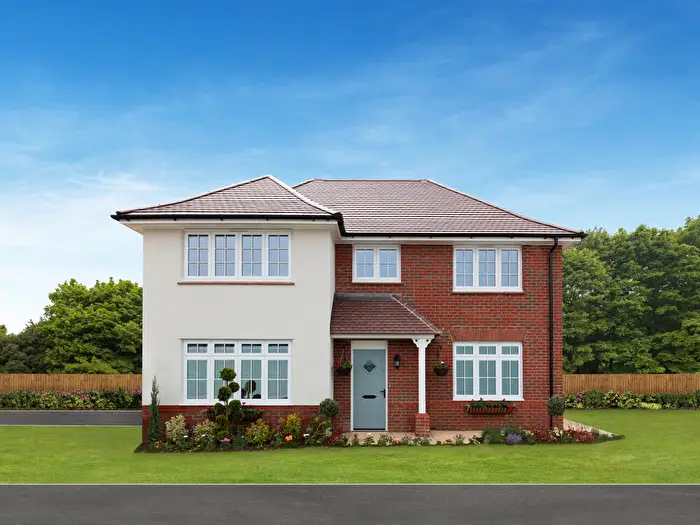
Properties for sale in Harwell



 2 Bedrooms
 1 Bathroom



If you are looking to sell your house, let it out, or receive a property valuation, an expert can help you.
Click the button below to get started.






Roads and Postcodes in Harwell
Navigate through our locations to find the location of your next house in Harwell, Didcot for sale or to rent.
| Streets | Postcodes |
|---|---|
| Abingdon Road | OX11 0JW |
| Barrow Lane | OX11 0EA |
| Barrow Road | OX11 0EB |
| Baths Road | OX11 0UD |
| Blenheim Hill | OX11 0DS |
| Broadway | OX11 0HF OX11 0LA |
| Broadway Close | OX11 0LB |
| Brookside | OX11 0HG |
| Burr Street | OX11 0DT OX11 0DU |
| Chilbrook | OX11 0HE |
| Chilton Field Way | OX11 0SQ OX11 0SZ |
| Church Hill | OX11 0SH |
| Church Lane | OX11 0EZ |
| Crafts End | OX11 0SA OX11 0SB |
| Dene Hollow | OX11 0SN |
| Diamond Way | OX11 0TT |
| Didcot Road | OX11 0DP OX11 6DL |
| Downs Close | OX11 0LP |
| Drewitts Corner | OX11 0EH |
| Droveway | OX11 0UB |
| Elderfield Crescent | OX11 0RY |
| Fieldside | OX11 0RU |
| Gaveston Road | OX11 0HP |
| Grove Road | OX11 0EE OX11 0PA OX11 0EF OX11 0EG |
| Hengest Gate | OX11 0HH |
| High Street | OX11 0EQ OX11 0ER OX11 0ET OX11 0EU OX11 0EX OX11 0EY |
| Hill Piece | OX11 0SX |
| Hollyhocks | OX11 0LX |
| Horsa Lane | OX11 0UE |
| Isis Close | OX11 0TS |
| Jennings Lane | OX11 0EP |
| Kiln Crescent | OX11 0TY |
| Kings Lane | OX11 0EJ |
| Latton Close | OX11 0SU |
| Lawson Lane | OX11 0RX |
| Limetrees | OX11 0HW OX11 0HY |
| Loder Road | OX11 0HR |
| Lower Road | OX11 0RR |
| Main Street | OX11 0RZ |
| Manor Close | OX11 0SS |
| Manor Green | OX11 0DQ |
| Newbury Road | OX11 0PB |
| North Drive | OX11 0PD OX11 0PE |
| Orchard Way | OX11 0LH OX11 0LQ |
| Pathfinder View | OX11 0UA |
| Potteries Lane | OX11 0TZ |
| Reading Road | OX11 0JJ OX11 0JL OX11 0JN OX11 0LN OX11 0LR OX11 0LU OX11 0LW |
| Roman Fields | OX11 0UF |
| School Lane | OX11 0ES |
| Severn Road | OX11 0PW |
| South Row | OX11 0RT |
| Spa Street | OX11 0TX |
| The Barrow | OX11 0HQ |
| The Cleave | OX11 0EL OX11 0EN OX11 0EW |
| The Croft | OX11 0ED |
| The Gallops | OX11 0PF |
| The Green | OX11 0SD |
| The Holloway | OX11 0LS |
| The Lane | OX11 0SE |
| The Orchids | OX11 0QP |
| The Paddock | OX11 0QU |
| The Park | OX11 0HB |
| The Styles | OX11 0HX |
| The Winnaway | OX11 0JG |
| Thorningdown | OX11 0RS |
| Townsend | OX11 0DX |
| Tyrrells Close | OX11 0LF |
| Villa Road | OX11 0TU |
| Wantage Road | OX11 0LE OX11 0LJ OX11 0LL |
| Wellshead Lane | OX11 0HD |
| Westfield | OX11 0HS OX11 0HT OX11 0LG |
Property price trends in Harwell
According to the latest Land Registry data, the average home in Harwell sold for £618,844 in 2026. That figure comes from 1,942 sales logged over the past 31 years.
Prices have continued to climb over the last three years. Compared with 2023, when the typical sale came in around £456,872, that's a rise of roughly 35.5%.
Looking back five years, average prices are up about 27.1% since 2021, a gain of around £132,000 in cash terms.
Zoom out to the past decade for the fuller picture. Back in 2016, homes here averaged £409,305, so the typical sold price has climbed about 51.2% since then, roughly 4.2% a year. Stretch the view to fifteen years and that annual pace edges up closer to 4.5%.
Frequently asked questions about Harwell
What is the average price for a property for sale in Harwell?
The average price for a property for sale in Harwell is £505,788. This amount is 31% higher than the average price in Didcot. There are 816 property listings for sale in Harwell.
What streets have the most expensive properties for sale in Harwell?
The streets with the most expensive properties for sale in Harwell are Wellshead Lane at an average of £2,600,000, Burr Street at an average of £1,040,000 and The Paddock at an average of £985,000.
What streets have the most affordable properties for sale in Harwell?
The streets with the most affordable properties for sale in Harwell are Gaveston Road at an average of £242,500, Roman Fields at an average of £294,669 and North Drive at an average of £295,863.
Which train stations are available in or near Harwell?
Some of the train stations available in or near Harwell are Didcot Parkway, Appleford and Culham.
Property Price Paid in Harwell by Year
The average sold property price by year was:
| Year | Average Sold Price | Price Change |
Sold Properties

|
|---|---|---|---|
| 2026 | £618,844 | 
21% |
29 Properties |
| 2025 | £488,685 | 
-2% |
54 Properties |
| 2024 | £498,206 |
8% |
59 Properties |
| 2023 | £456,872 |
-10% |
39 Properties |
| 2022 | £501,618 |
3% |
60 Properties |
| 2021 | £486,844 |
8% |
98 Properties |
| 2020 | £449,220 |
6% |
68 Properties |
| 2019 | £421,699 |
-15% |
61 Properties |
| 2018 | £486,321 |
6% |
65 Properties |
| 2017 | £459,157 |
11% |
53 Properties |
Property Price per Property Type in Harwell
Here you can find historic sold price data in order to help with your property search.
The average Property Paid Price for specific property types in the last three years are:
| Property Type | Average Sold Price | Sold Properties |
|---|---|---|
| Detached House | £643,016.00 | 91 Detached Houses |
| Flat | £303,500.00 | 2 Flats |
| Semi Detached House | £389,616.00 | 53 Semi Detached Houses |
| Terraced House | £336,472.00 | 35 Terraced Houses |
