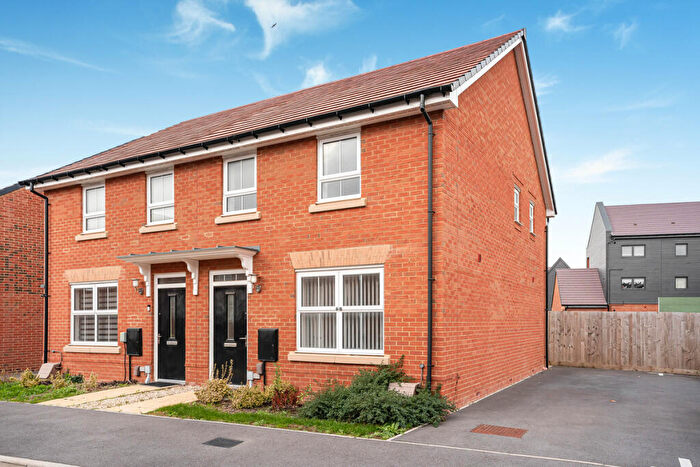
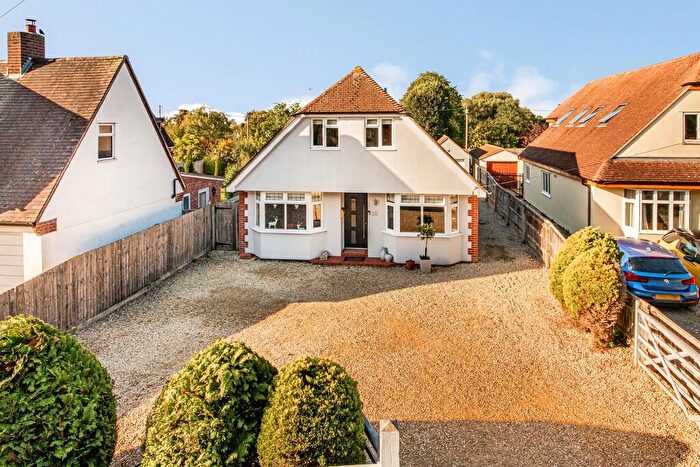
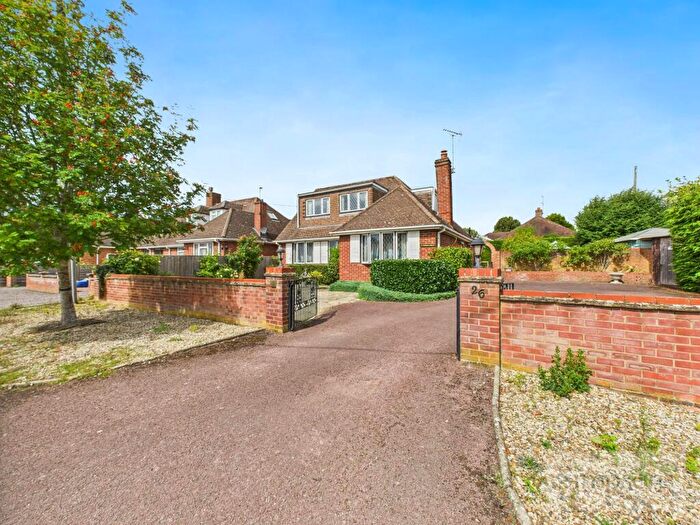
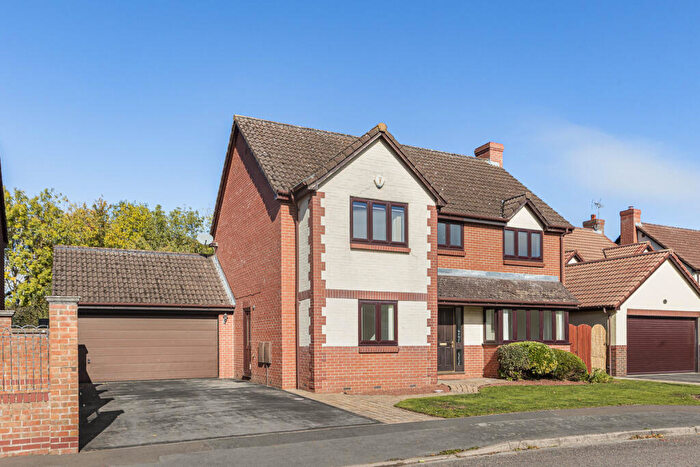
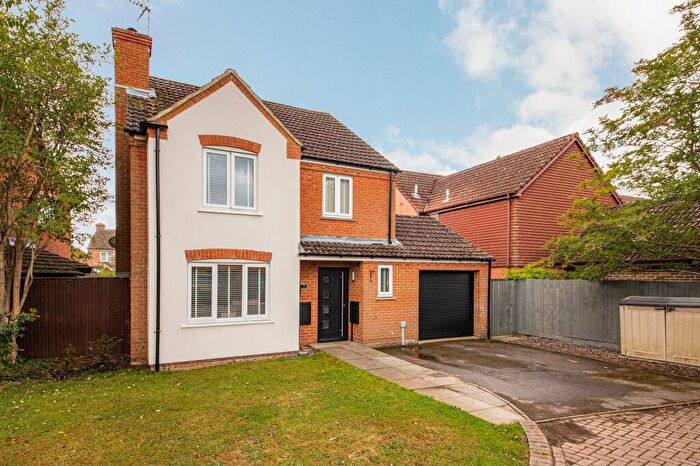
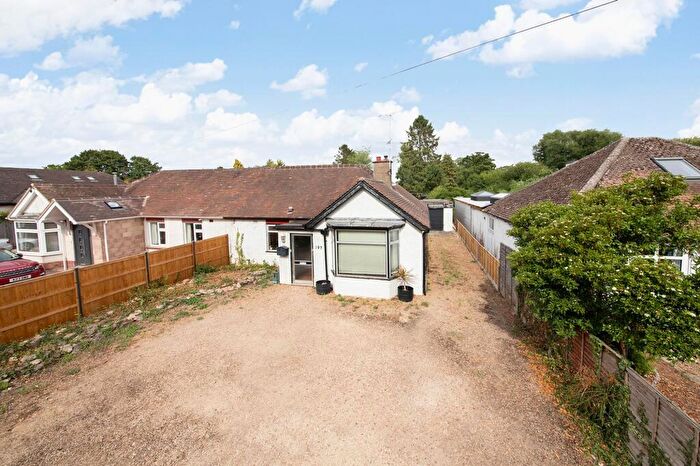
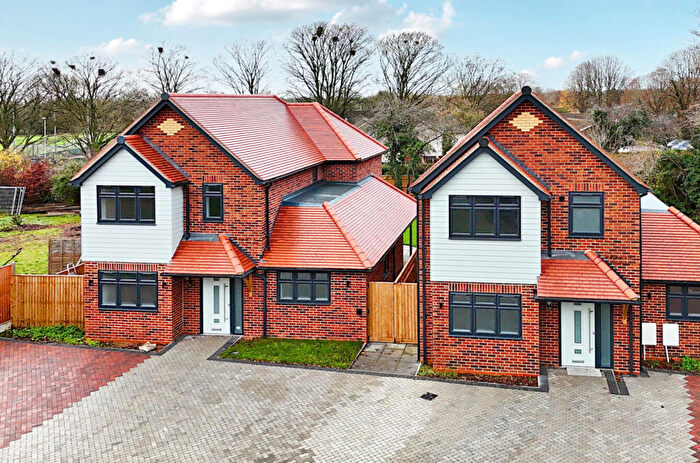
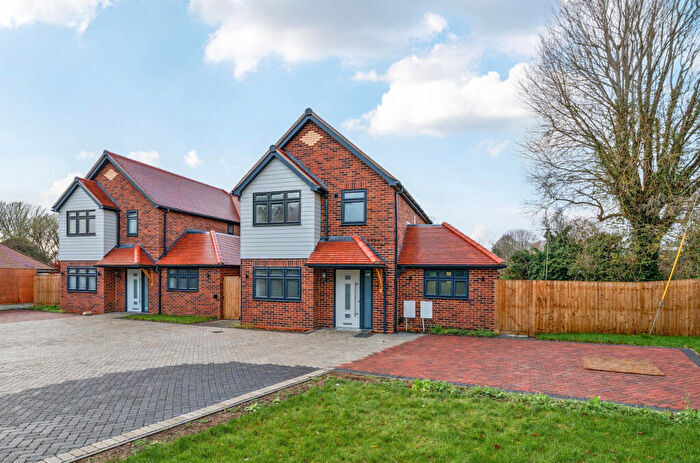
Houses for sale & to rent in Sunningwell And Wootton, Oxford
House Prices in Sunningwell And Wootton
Properties in Sunningwell And Wootton have an average house price of £816,699.00 and had 60 Property Transactions within the last 3 years¹.
Sunningwell And Wootton is an area in Oxford, Oxfordshire with 576 households², where the most expensive property was sold for £2,800,000.00.
Properties for sale in Sunningwell And Wootton
Roads and Postcodes in Sunningwell And Wootton
Navigate through our locations to find the location of your next house in Sunningwell And Wootton, Oxford for sale or to rent.
| Streets | Postcodes |
|---|---|
| Bayworth Lane | OX1 5DF |
| Bedwells Heath | OX1 5JE |
| Chilswell Lane | OX1 5BN |
| Cumnor Road | OX1 5JP OX1 5JR OX1 5JS |
| Fox Lane | OX1 5DN OX1 5DP OX1 5DR OX1 5DS OX1 5DT |
| Foxcombe Lane | OX1 5DH |
| Foxcombe Road | OX1 5DD OX1 5DG OX1 5DL OX1 5DQ |
| Hamels Lane | OX1 5DJ |
| Hill View Lane | OX1 5JT |
| Jarnway | OX1 5JF OX1 5JG |
| Lincombe Lane | OX1 5DU OX1 5DX OX1 5DY OX1 5DZ |
| Old Boars Hill | OX1 5JJ OX1 5JQ |
| Orchard Lane | OX1 5JH |
| Red Copse Lane | OX1 5ER |
| Robinson Road | OX1 5LE |
| Sandy Lane | OX1 5HL |
| The Ridgeway | OX1 5EX OX1 5EY OX1 5EZ |
| The Willows | OX1 5LD |
| Werrell Drive | OX1 5LF |
| White Barn | OX1 5HJ |
| Woodland Walk | OX1 5DE |
| Wootton Village | OX1 5HP OX1 5HW OX1 5JL |
Transport near Sunningwell And Wootton
- FAQ
- Price Paid By Year
- Property Type Price
Frequently asked questions about Sunningwell And Wootton
What is the average price for a property for sale in Sunningwell And Wootton?
The average price for a property for sale in Sunningwell And Wootton is £816,699. This amount is 43% higher than the average price in Oxford. There are 539 property listings for sale in Sunningwell And Wootton.
What streets have the most expensive properties for sale in Sunningwell And Wootton?
The streets with the most expensive properties for sale in Sunningwell And Wootton are Lincombe Lane at an average of £1,995,000, The Ridgeway at an average of £1,426,250 and Foxcombe Road at an average of £841,250.
What streets have the most affordable properties for sale in Sunningwell And Wootton?
The streets with the most affordable properties for sale in Sunningwell And Wootton are Bayworth Lane at an average of £159,816, Robinson Road at an average of £369,000 and Hill View Lane at an average of £496,666.
Which train stations are available in or near Sunningwell And Wootton?
Some of the train stations available in or near Sunningwell And Wootton are Oxford, Radley and Culham.
Property Price Paid in Sunningwell And Wootton by Year
The average sold property price by year was:
| Year | Average Sold Price | Price Change |
Sold Properties
|
|---|---|---|---|
| 2025 | £617,428 | -7% |
7 Properties |
| 2024 | £658,411 | -17% |
17 Properties |
| 2023 | £772,886 | -41% |
18 Properties |
| 2022 | £1,087,500 | 7% |
18 Properties |
| 2021 | £1,013,958 | -6% |
24 Properties |
| 2020 | £1,079,250 | 30% |
10 Properties |
| 2019 | £753,600 | -22% |
15 Properties |
| 2018 | £920,336 | -13% |
23 Properties |
| 2017 | £1,043,850 | 28% |
10 Properties |
| 2016 | £750,530 | -28% |
30 Properties |
| 2015 | £962,108 | 30% |
22 Properties |
| 2014 | £672,218 | 30% |
32 Properties |
| 2013 | £470,835 | -130% |
14 Properties |
| 2012 | £1,083,557 | 48% |
23 Properties |
| 2011 | £560,703 | -39% |
16 Properties |
| 2010 | £778,177 | 2% |
20 Properties |
| 2009 | £765,044 | -21% |
17 Properties |
| 2008 | £923,352 | 35% |
17 Properties |
| 2007 | £604,018 | 33% |
27 Properties |
| 2006 | £402,941 | 10% |
76 Properties |
| 2005 | £363,568 | -32% |
28 Properties |
| 2004 | £478,955 | 10% |
30 Properties |
| 2003 | £429,434 | -5% |
19 Properties |
| 2002 | £449,630 | -8% |
21 Properties |
| 2001 | £483,906 | 27% |
16 Properties |
| 2000 | £355,266 | 12% |
15 Properties |
| 1999 | £312,693 | 6% |
16 Properties |
| 1998 | £292,838 | 6% |
18 Properties |
| 1997 | £274,745 | 27% |
12 Properties |
| 1996 | £199,374 | -10% |
14 Properties |
| 1995 | £219,142 | - |
21 Properties |
Property Price per Property Type in Sunningwell And Wootton
Here you can find historic sold price data in order to help with your property search.
The average Property Paid Price for specific property types in the last three years are:
| Property Type | Average Sold Price | Sold Properties |
|---|---|---|
| Detached House | £994,523.00 | 42 Detached Houses |
| Terraced House | £502,142.00 | 7 Terraced Houses |
| Semi Detached House | £520,000.00 | 2 Semi Detached Houses |
| Flat | £297,438.00 | 9 Flats |

