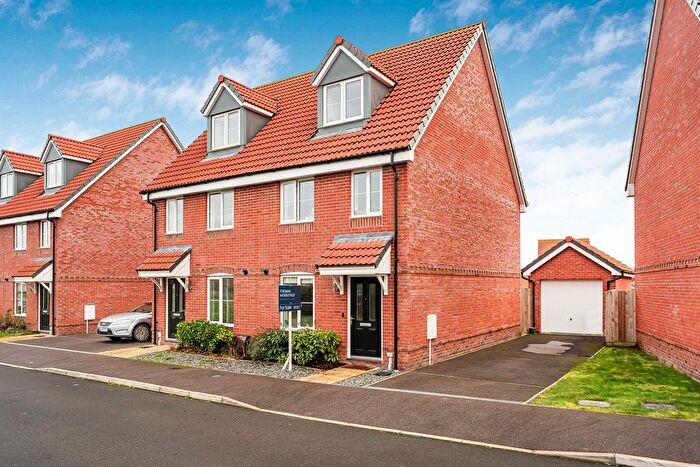
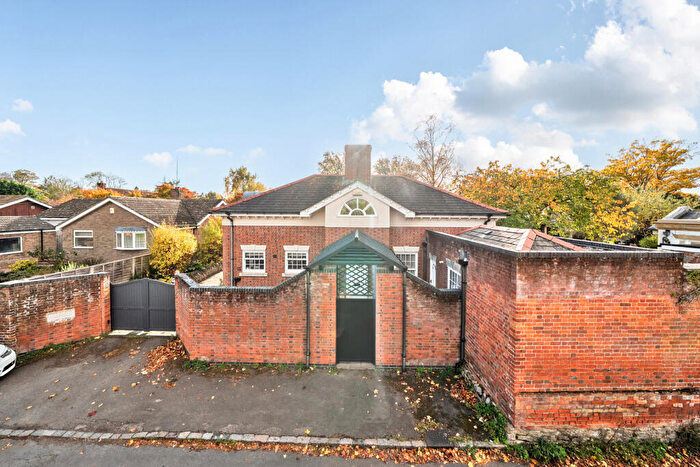
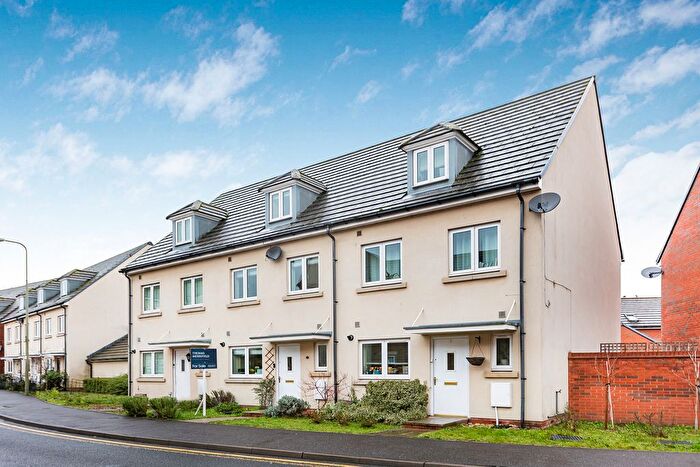
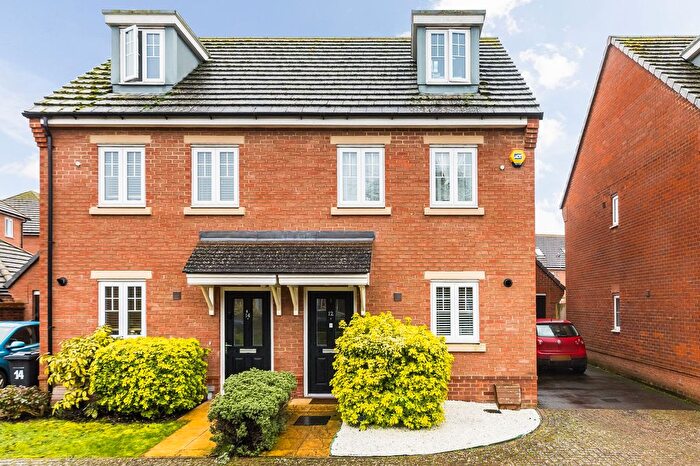
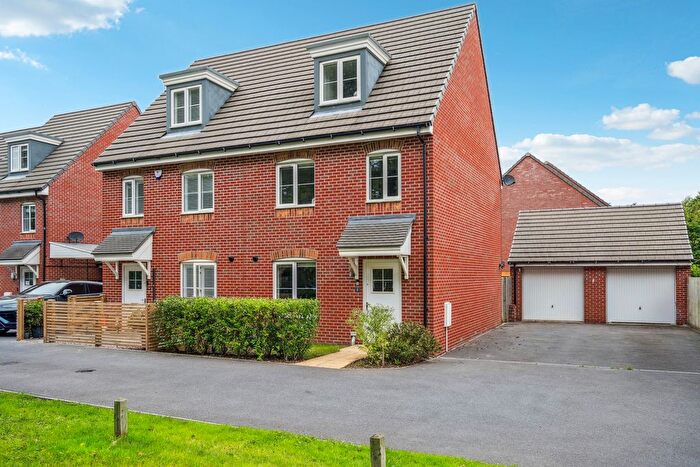
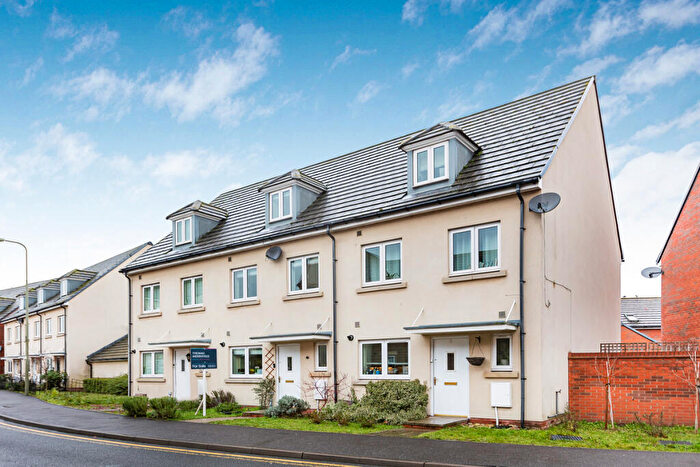
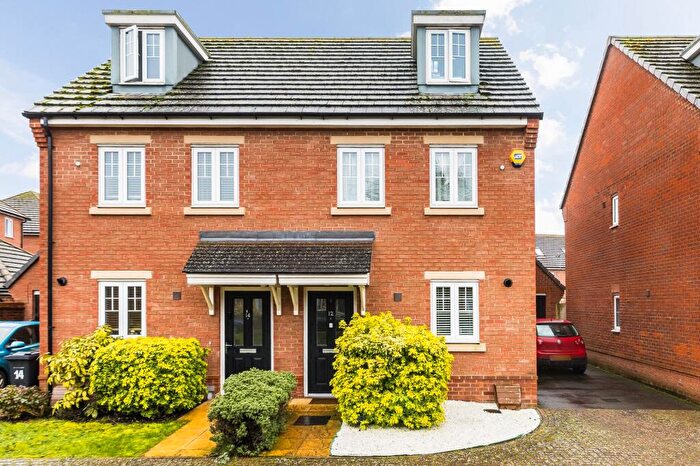
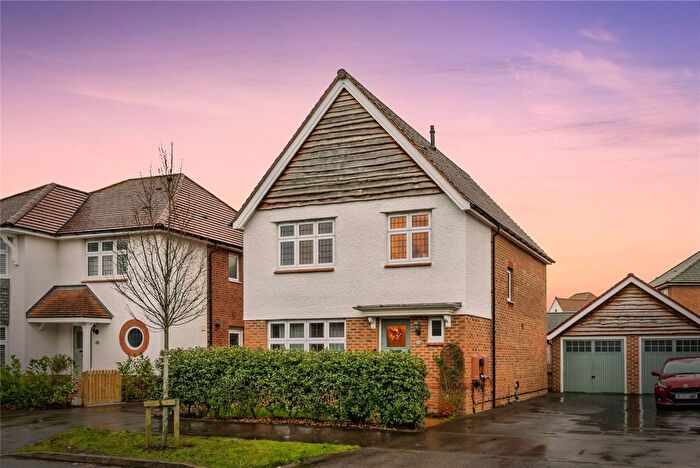
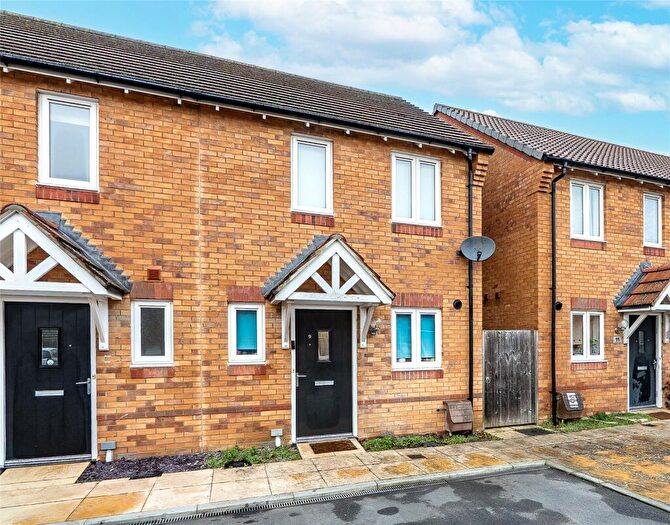
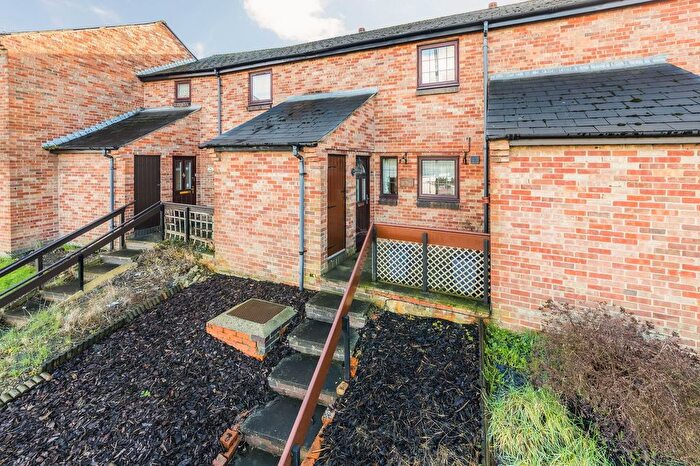
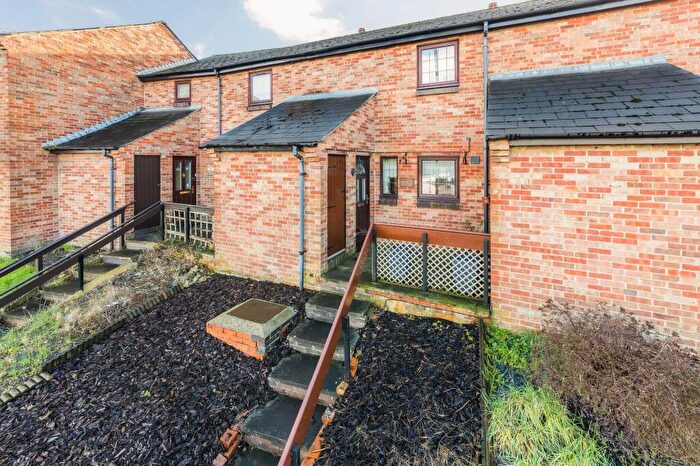
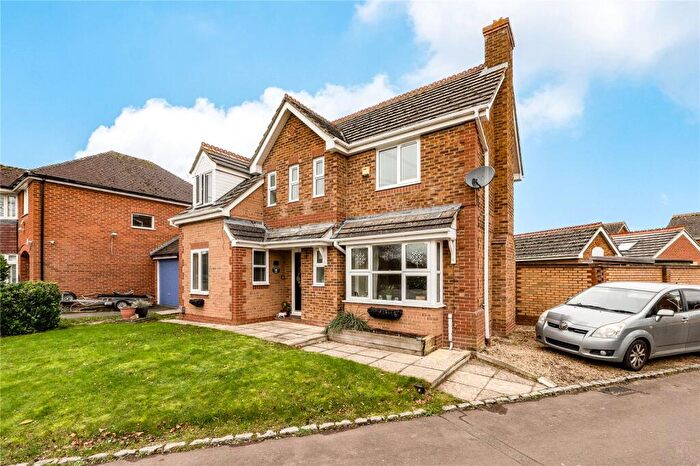
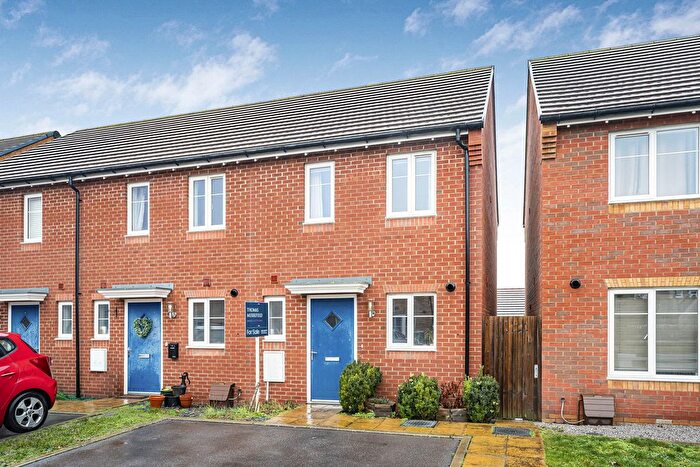
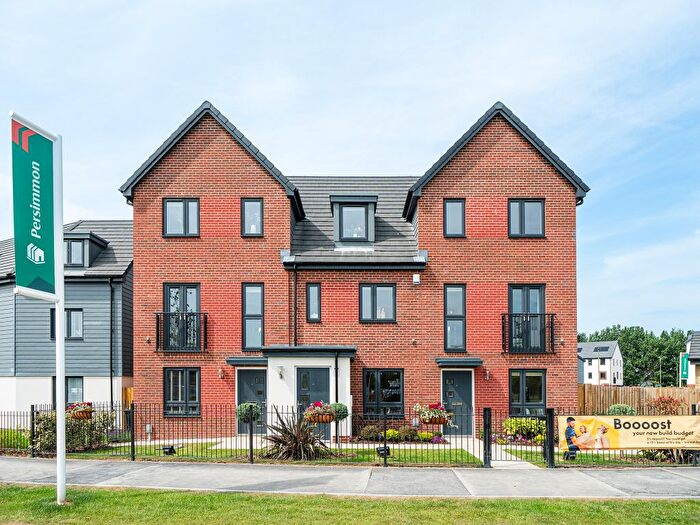
Houses for sale & to rent in Blewbury & Harwell, Didcot
House Prices in Blewbury & Harwell
Properties in Blewbury & Harwell have an average house price of £364,962.00 and had 158 Property Transactions within the last 3 years¹.
Blewbury & Harwell is an area in Didcot, Oxfordshire with 227 households², where the most expensive property was sold for £1,037,500.00.
Properties for sale in Blewbury & Harwell
Roads and Postcodes in Blewbury & Harwell
Navigate through our locations to find the location of your next house in Blewbury & Harwell, Didcot for sale or to rent.
| Streets | Postcodes |
|---|---|
| Aldens Lane | OX11 9HS |
| Applethorpe | OX11 9FF |
| Applewood Close | OX11 0GE |
| Armstrong Close | OX11 0GJ |
| Ash Crescent | OX11 0FJ |
| Barberry Drive | OX11 6JY |
| Barrow Lane | OX11 0DY |
| Barrow Road | OX11 0DZ |
| Bessels Way | OX11 9NL |
| Blewbury Road | OX11 9EB |
| Blisset Close | OX11 6FE |
| Bohams Road | OX11 9HF |
| Boot Lane | OX11 0FS |
| Bramble Lane | OX11 6ET |
| Calamint Court | OX11 6GZ |
| Candytuft Way | OX11 6FF OX11 6FJ OX11 6FX |
| Chailey Gardens | OX11 9FL |
| Chapel Furlong | OX11 9JN |
| Chequers End | OX11 0FZ |
| Cherry Tree Road | OX11 6DG |
| Chestnut Drive | OX11 6DP |
| Chilton Road | OX11 0NT |
| Church End | OX11 9QQ |
| Church Lane | OX11 0HA OX11 0HL |
| Churn Estate | OX11 9HA OX11 9HD OX11 9HE OX11 9HG |
| Cossicle Mead | OX11 9FA |
| Cottongrass Road | OX11 6GF |
| Crispin Place | OX11 0FX |
| Crown Fields | OX11 0FQ |
| Dene Hollow | OX11 0SL OX11 0SW |
| Didcot Road | OX11 6DH OX11 6DN OX11 6DW |
| Downside | OX11 0PQ |
| Fen Violet Drive | OX11 6FZ |
| Fermi Avenue | OX11 0FD |
| Fidlers Orchard | OX11 0FR |
| Foxglove Way | OX11 6DQ OX11 6EQ |
| Gentian Mews | OX11 6GR |
| Green Road | OX11 0DR |
| Greenwood Way | OX11 6BZ OX11 6EY OX11 6GD OX11 6GY OX11 6JX |
| Ham Corner | OX11 0FT |
| Harebell Road | OX11 6EW |
| Hawthorn Gardens | OX11 0FL |
| Heather Way | OX11 6JZ |
| Hill Mead | OX11 0FP |
| Holly Lane | OX11 6DA |
| Hoopswell | OX11 0FU |
| Hopkins Way | OX11 6FD |
| Hornsby Fields | OX11 6GJ |
| Ivy Close | OX11 6DD |
| Keats Drive | OX11 6FA |
| Ladycroft Park | OX11 9QN OX11 9QW |
| London Road | OX11 9HB OX11 9PE OX11 9PN |
| Marigold Crescent | OX11 6GB |
| Mezereon Spur | OX11 6GE |
| Miles East | OX11 6EE |
| Mistletoe Mews | OX11 6DB |
| Moreland Road | OX11 6EZ |
| Newbury Road | OX11 0PG OX11 0QN OX11 0RP OX11 0RW OX11 0GH |
| Orchard Close | OX11 9JQ |
| Orchid Mews | OX11 6EX |
| Palmer Close | OX11 6GL |
| Pegasus Close | OX11 0SY |
| Pennyroyal Place | OX11 6FY |
| Queen Gardens | OX11 0GA |
| Reading Road | OX11 0LT OX11 0LZ OX11 9JJ |
| Robinson Close | OX11 9NA |
| Rowland Close | OX11 9JF |
| Second Street | OX11 0GL |
| Sir Chetwode Close | OX11 6FB |
| Speedwell Arch | OX11 6GA |
| Streamway Close | OX11 0FY |
| Talbot Close | OX11 0FB |
| Teasel Bank | OX11 0FH |
| The Green | OX11 0SF |
| The Rookery | OX11 0TW |
| Thyme Gardens | OX11 6HA |
| Townsend | OX11 0SJ |
| Walnut Place | OX11 0FG |
| Wantage Road | OX11 0LD |
| Westfield | OX11 0HU |
| White Hart Way | OX11 0FW |
| Winnaway Road | OX11 0JQ |
| Woodway Road | OX11 9EX OX11 9EY OX11 9HW |
| Wynton Close | OX11 6FG |
| OX11 0DE OX11 0FA OX11 0GB OX11 0PH OX11 0QX OX11 0RN OX11 0SP OX11 0SR OX11 0ST OX11 0TD OX11 9EU OX11 9EZ OX11 9HU |
Transport near Blewbury & Harwell
- FAQ
- Price Paid By Year
- Property Type Price
Frequently asked questions about Blewbury & Harwell
What is the average price for a property for sale in Blewbury & Harwell?
The average price for a property for sale in Blewbury & Harwell is £364,962. This amount is 6% lower than the average price in Didcot. There are 5,524 property listings for sale in Blewbury & Harwell.
What streets have the most expensive properties for sale in Blewbury & Harwell?
The streets with the most expensive properties for sale in Blewbury & Harwell are Didcot Road at an average of £790,000, Fidlers Orchard at an average of £606,985 and Talbot Close at an average of £549,000.
What streets have the most affordable properties for sale in Blewbury & Harwell?
The streets with the most affordable properties for sale in Blewbury & Harwell are Blisset Close at an average of £142,000, The Rookery at an average of £180,000 and Calamint Court at an average of £191,000.
Which train stations are available in or near Blewbury & Harwell?
Some of the train stations available in or near Blewbury & Harwell are Didcot Parkway, Appleford and Culham.
Property Price Paid in Blewbury & Harwell by Year
The average sold property price by year was:
| Year | Average Sold Price | Price Change |
Sold Properties
|
|---|---|---|---|
| 2025 | £373,003 | 3% |
50 Properties |
| 2024 | £362,496 | 1% |
51 Properties |
| 2023 | £360,114 | 0,4% |
57 Properties |
| 2022 | £358,567 | 4% |
89 Properties |
| 2021 | £344,815 | -3% |
90 Properties |
| 2020 | £353,660 | -1% |
91 Properties |
| 2019 | £356,904 | 11% |
163 Properties |
| 2018 | £316,732 | -10% |
253 Properties |
| 2017 | £348,758 | 3% |
272 Properties |
| 2016 | £338,206 | 8% |
152 Properties |
| 2015 | £311,999 | -15% |
129 Properties |
| 2014 | £357,979 | -82% |
24 Properties |
| 2012 | £650,000 | 68% |
1 Property |
| 1996 | £210,000 | - |
1 Property |
Property Price per Property Type in Blewbury & Harwell
Here you can find historic sold price data in order to help with your property search.
The average Property Paid Price for specific property types in the last three years are:
| Property Type | Average Sold Price | Sold Properties |
|---|---|---|
| Semi Detached House | £365,247.00 | 54 Semi Detached Houses |
| Detached House | £520,781.00 | 46 Detached Houses |
| Terraced House | £300,588.00 | 24 Terraced Houses |
| Flat | £199,135.00 | 34 Flats |

