
Houses for sale & to rent in Hagbourne, Didcot
House Prices in Hagbourne
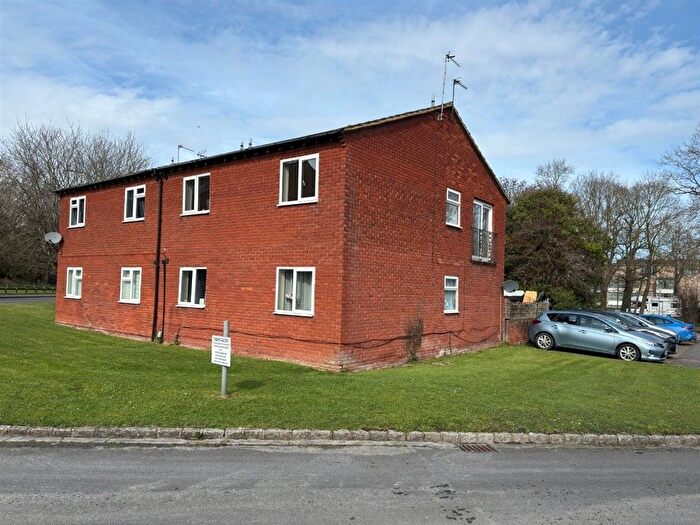
Properties in Hagbourne have an average house price of £787k and had 76 Property Transactions within the last 3 years¹.
Hagbourne is an area in Didcot, Oxfordshire with 1,017 households², where the most expensive property was sold for £2.83M.
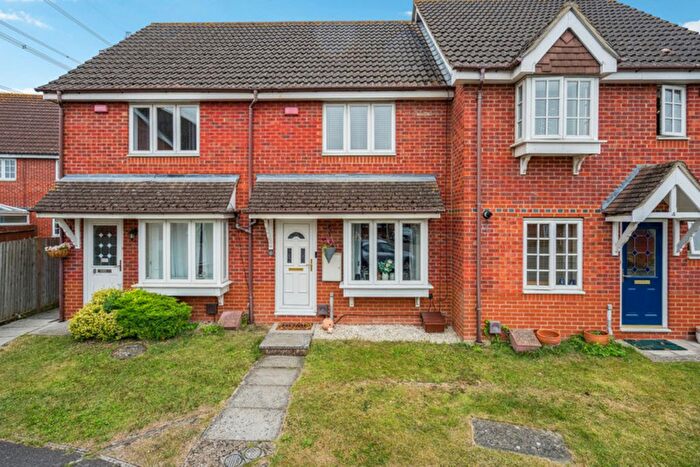
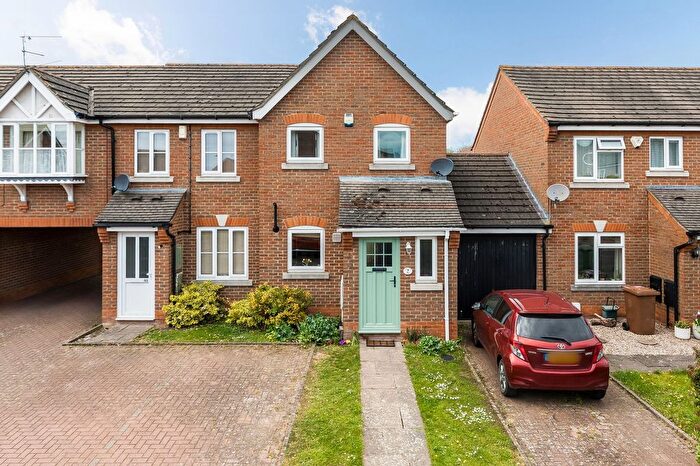
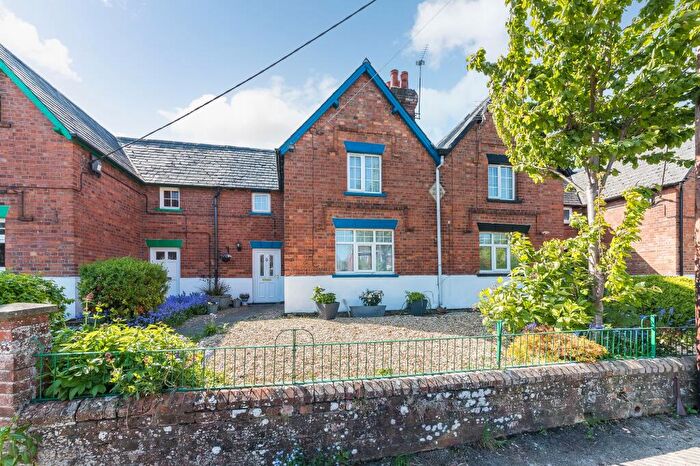
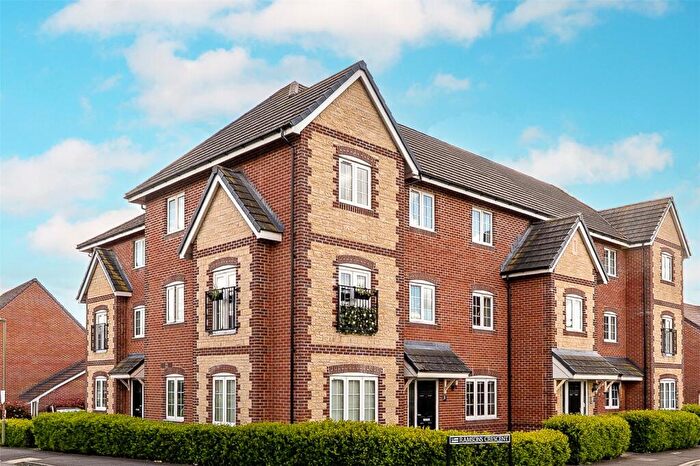
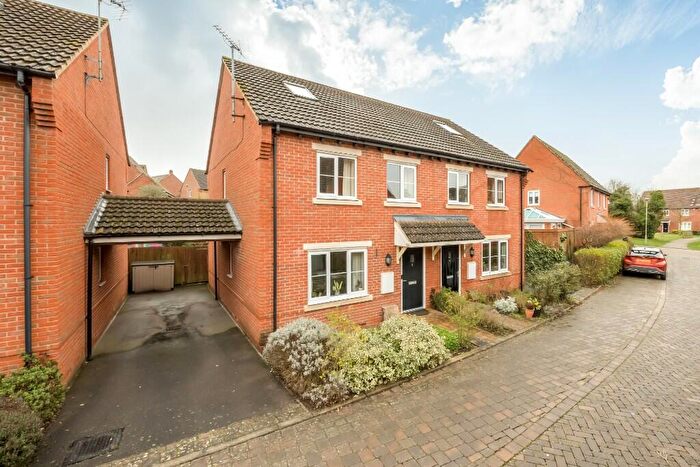
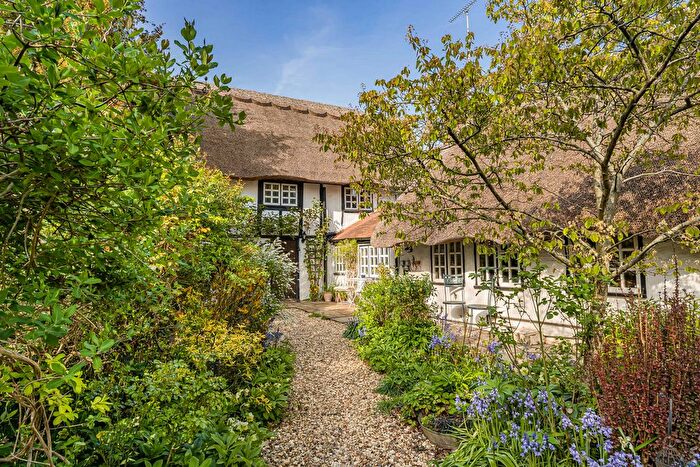
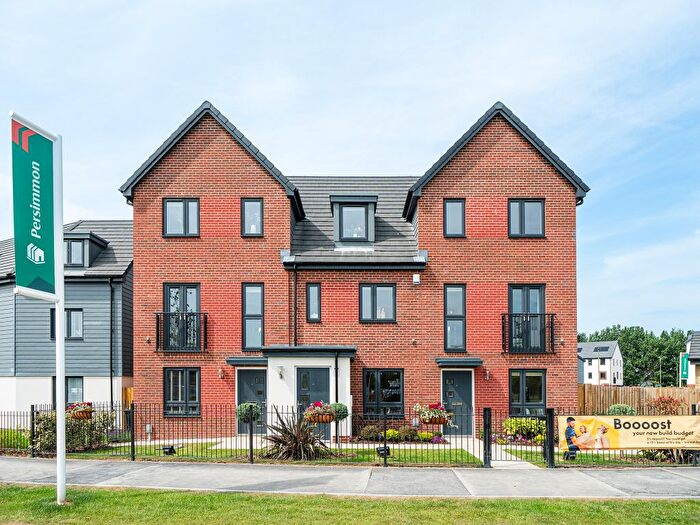
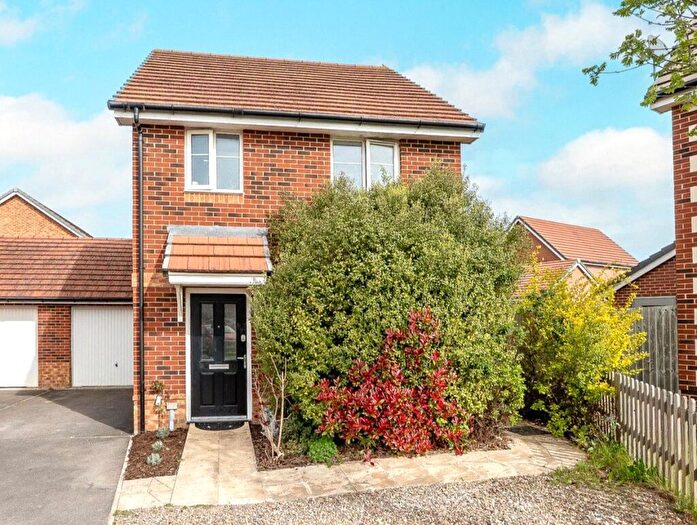
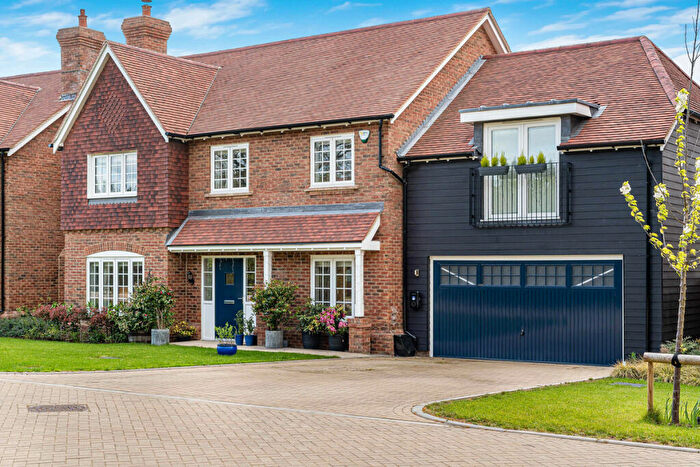
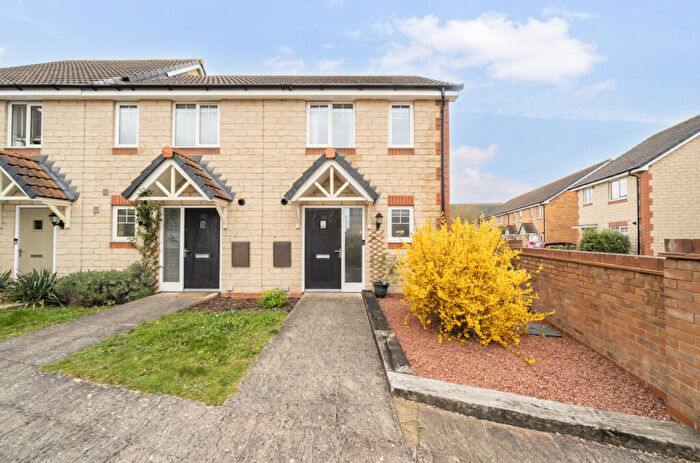
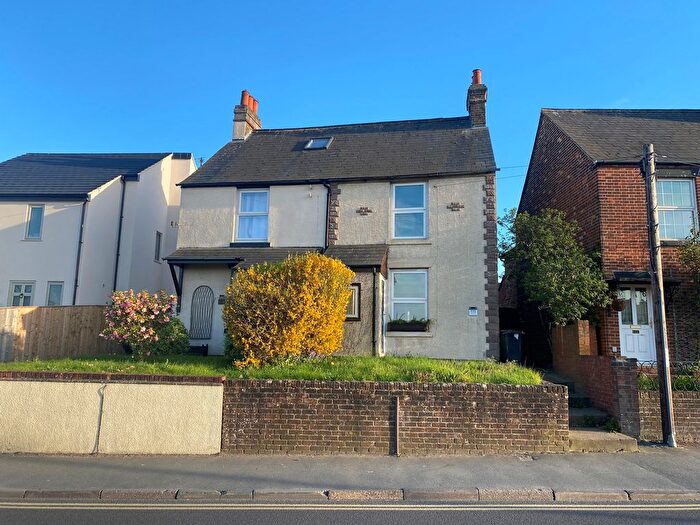
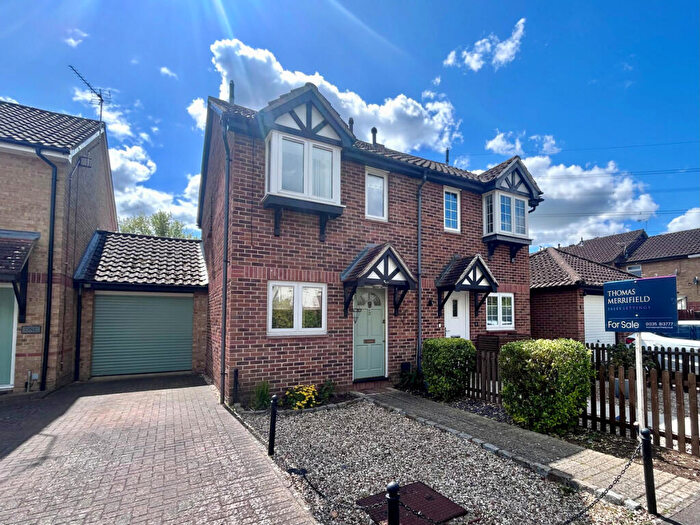
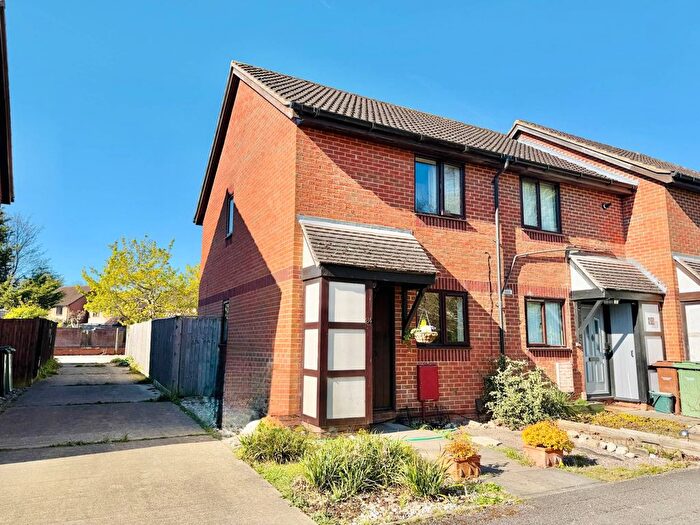
Properties for sale in Hagbourne

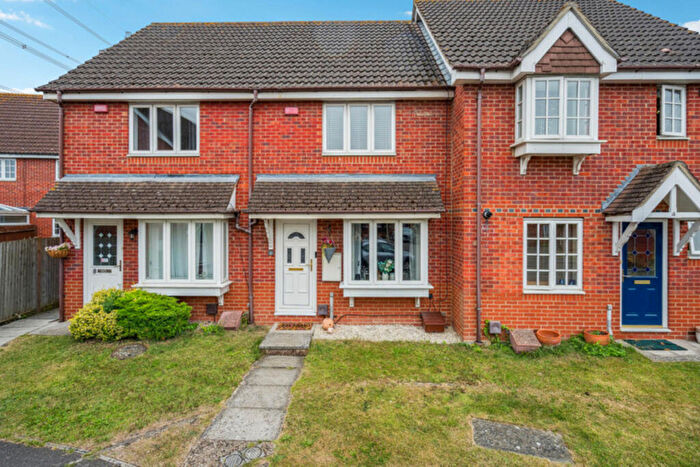
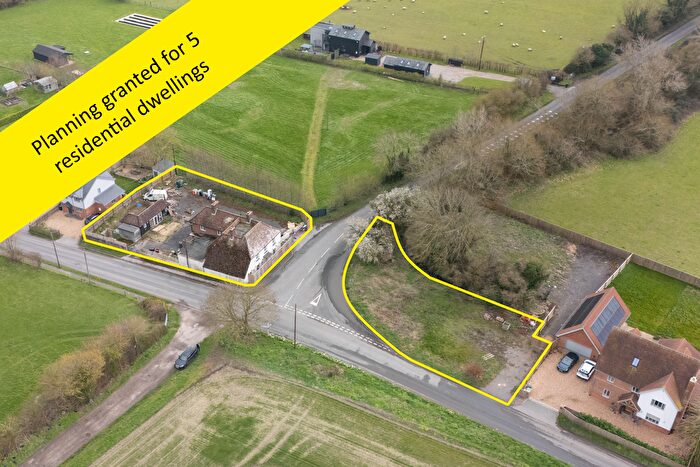
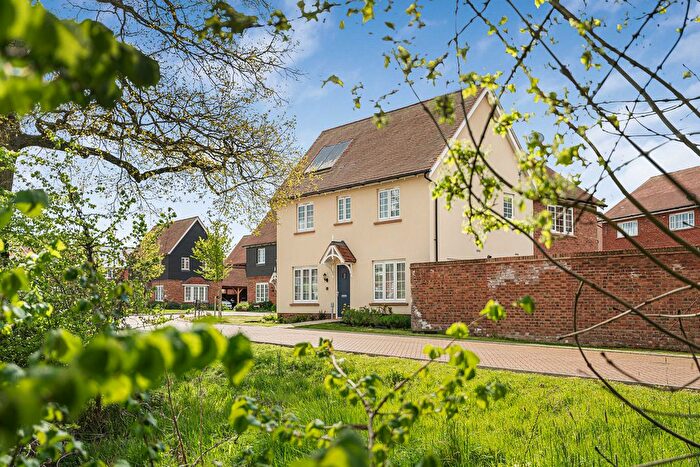
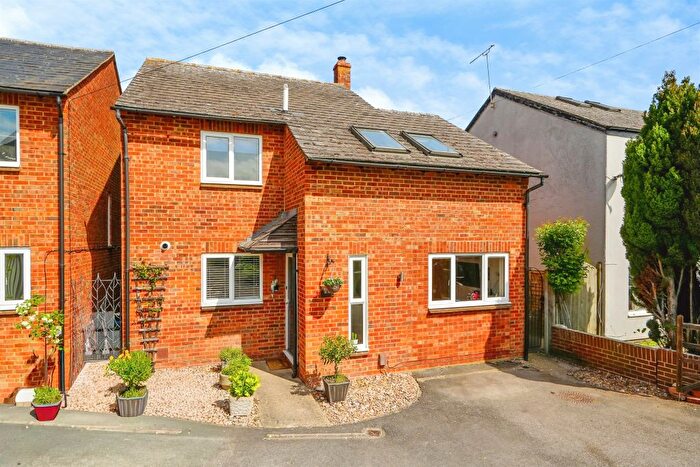
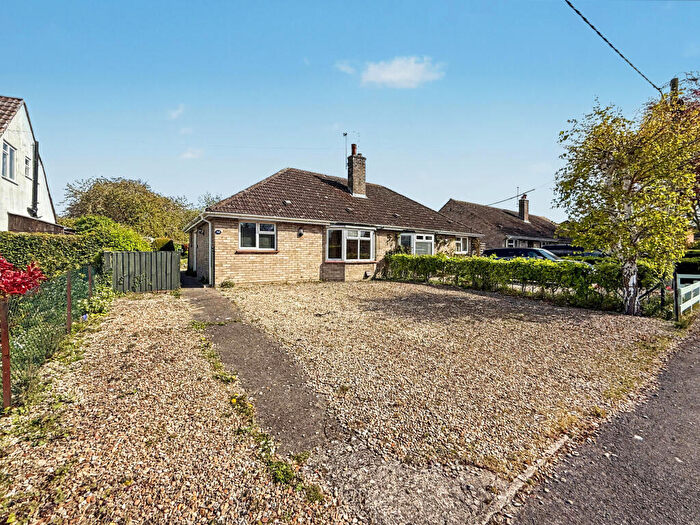
![]()
If you are looking to sell your house, let it out, or receive a property valuation, an expert can help you.
Click the button below to get started.


Roads and Postcodes in Hagbourne
Navigate through our locations to find the location of your next house in Hagbourne, Didcot for sale or to rent.
| Streets | Postcodes |
|---|---|
| Anchor Lane | OX11 9AN |
| Aston Street | OX11 9DJ OX11 9DQ |
| Baker Street | OX11 9DD |
| Bakers Lane | OX11 9LH |
| Bear Lane | OX11 9AS |
| Bishops Orchard | OX11 9JS |
| Blewbury Road | OX11 9EA OX11 9LE OX11 9LF OX11 9LG |
| Chalk Hill | OX11 9DN |
| Church Close | OX11 9LP |
| Church Lane | OX11 9AF |
| Clements Green | OX11 9AE |
| Crown Lane | OX11 9AQ |
| Downs View | OX11 9DE |
| Dunsomer Hill | OX11 9AP OX11 9AR |
| Elm Road | OX11 9BB |
| Fieldside | OX11 9LQ |
| Fox Glove Lane | OX11 0NW |
| Fullers Road | OX11 9EL OX11 9EN |
| Great Mead | OX11 9BN |
| Grove Terrace | OX11 0NL |
| Hadden Hill | OX11 9BJ |
| Hagbourne Road | OX11 9EE |
| Harwood Road | OX11 9LX |
| Higgs Close | OX11 9NB |
| High Street | OX11 9AD OX11 9AG OX11 9AT |
| Hithercroft | OX11 9AL |
| Kingsholme Close | OX11 9LL |
| Kirby Close | OX11 9DT |
| Lake Road | OX11 9LZ |
| Little Langlands | OX11 9TA |
| London Road | OX11 9DW |
| Long Wittenham Road | OX11 9AX OX11 9AZ OX11 9BH |
| Main Road | OX11 9LJ OX11 9LN OX11 9LR |
| Main Street | OX11 0NB OX11 0ND OX11 0NJ |
| Manor Close | OX11 0NQ |
| Moor Lane | OX11 0NE |
| Moreton Road | OX11 9EP OX11 9ER OX11 9EW |
| New Road | OX11 9JU OX11 9JX OX11 9JZ OX11 9LB OX11 9LD |
| North Croft | OX11 9LT |
| Paper Mill Lane | OX11 9AH |
| Queensway | OX11 9AY |
| Rectory Lane | OX11 9DH |
| Rymans Crescent | OX11 9LA |
| Sands Road | OX11 9AB |
| Shoe Lane | OX11 9LW |
| Spring Lane | OX11 9EH OX11 9EJ |
| The Crescent | OX11 9JY |
| The Croft | OX11 9DL OX11 9LS |
| Thorpe Street | OX11 9EG OX11 9EQ |
| Upper Cross Lane | OX11 9NE |
| Wallingford Road | OX11 9BA |
| Wilcher Close | OX11 9LU |
| Windsor Crescent | OX11 9LY |
| York Road | OX11 0NG OX11 0NH |
| OX11 0NP OX11 9DS OX11 9EF OX11 9HQ |
Transport near Hagbourne

- FAQ
- Price Paid By Year
- Property Type Price
Frequently asked questions about Hagbourne
What is the average price for a property for sale in Hagbourne?
The average price for a property for sale in Hagbourne is £786,813. This amount is 104% higher than the average price in Didcot. There are 4,813 property listings for sale in Hagbourne.
What streets have the most expensive properties for sale in Hagbourne?
The streets with the most expensive properties for sale in Hagbourne are Rectory Lane at an average of £2,825,000, Spring Lane at an average of £1,962,500 and Great Mead at an average of £1,505,000.
What streets have the most affordable properties for sale in Hagbourne?
The streets with the most affordable properties for sale in Hagbourne are Lake Road at an average of £335,000, The Crescent at an average of £394,000 and Elm Road at an average of £405,000.
Which train stations are available in or near Hagbourne?
Some of the train stations available in or near Hagbourne are Didcot Parkway, Cholsey and Appleford.
Property Price Paid in Hagbourne by Year
The average sold property price by year was:
| Year | Average Sold Price | Price Change |
Sold Properties
|
|---|---|---|---|
| 2025 | £839,395 | -3% |
20 Properties |
| 2024 | £865,766 | 23% |
28 Properties |
| 2023 | £670,303 | -11% |
28 Properties |
| 2022 | £746,085 | 10% |
47 Properties |
| 2021 | £672,467 | 24% |
47 Properties |
| 2020 | £510,350 | -5% |
34 Properties |
| 2019 | £533,767 | -23% |
40 Properties |
| 2018 | £658,902 | 13% |
25 Properties |
| 2017 | £574,723 | 12% |
36 Properties |
| 2016 | £506,070 | -2% |
34 Properties |
| 2015 | £518,205 | 4% |
29 Properties |
| 2014 | £499,331 | -15% |
42 Properties |
| 2013 | £572,446 | -2% |
47 Properties |
| 2012 | £581,566 | 19% |
30 Properties |
| 2011 | £468,901 | -7% |
26 Properties |
| 2010 | £500,972 | 21% |
36 Properties |
| 2009 | £395,403 | -3% |
29 Properties |
| 2008 | £406,955 | -12% |
17 Properties |
| 2007 | £454,225 | 27% |
35 Properties |
| 2006 | £331,982 | -19% |
40 Properties |
| 2005 | £393,488 | 19% |
43 Properties |
| 2004 | £320,378 | -10% |
33 Properties |
| 2003 | £351,543 | 19% |
49 Properties |
| 2002 | £283,684 | 10% |
41 Properties |
| 2001 | £256,581 | 18% |
54 Properties |
| 2000 | £210,807 | -11% |
34 Properties |
| 1999 | £234,700 | 19% |
50 Properties |
| 1998 | £190,646 | 24% |
40 Properties |
| 1997 | £145,800 | 4% |
48 Properties |
| 1996 | £139,315 | 20% |
56 Properties |
| 1995 | £111,730 | - |
51 Properties |
Property Price per Property Type in Hagbourne
Here you can find historic sold price data in order to help with your property search.
The average Property Paid Price for specific property types in the last three years are:
| Property Type | Average Sold Price | Sold Properties |
|---|---|---|
| Semi Detached House | £497,947.00 | 20 Semi Detached Houses |
| Detached House | £924,719.00 | 52 Detached Houses |
| Terraced House | £531,166.00 | 3 Terraced Houses |
| Flat | £160,000.00 | 1 Flat |