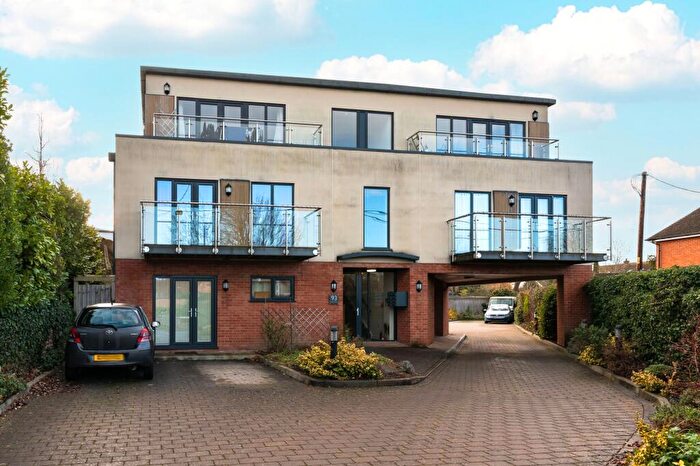
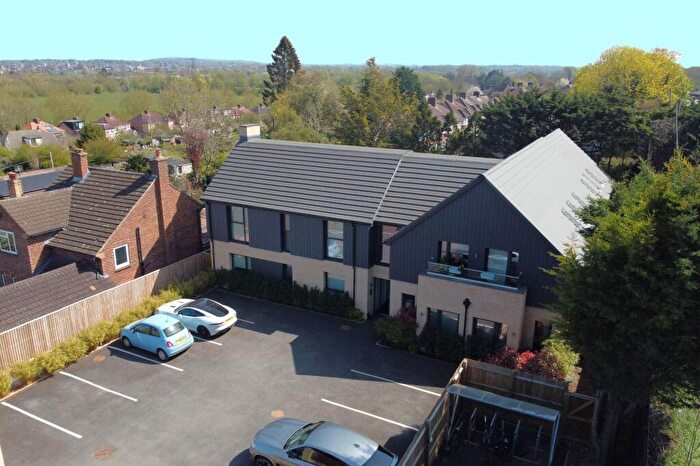
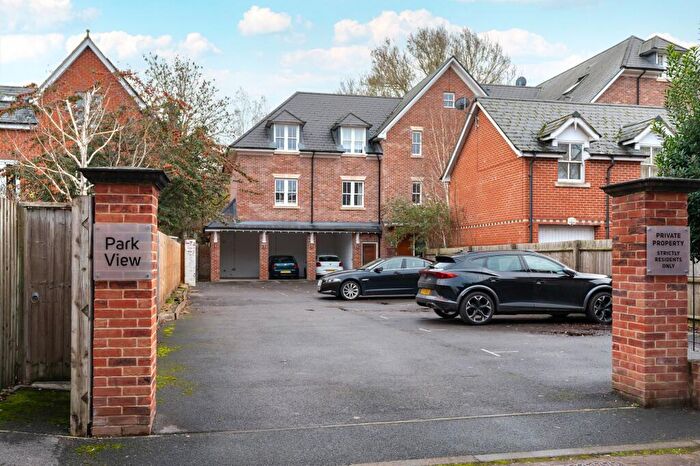
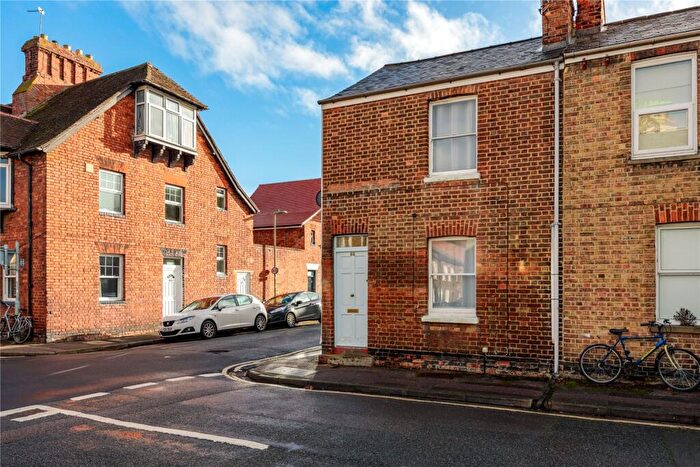
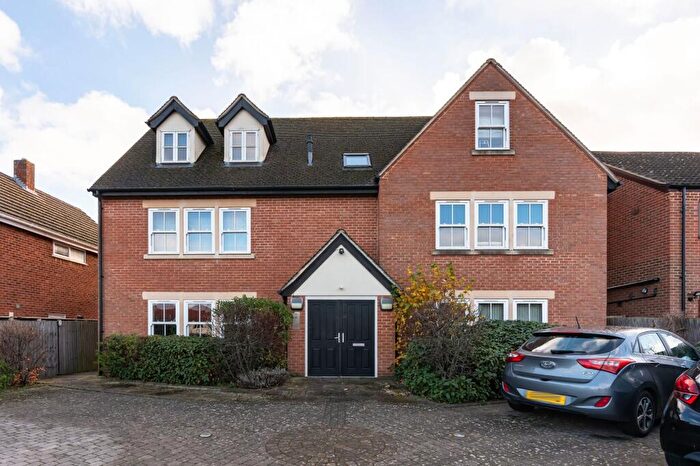
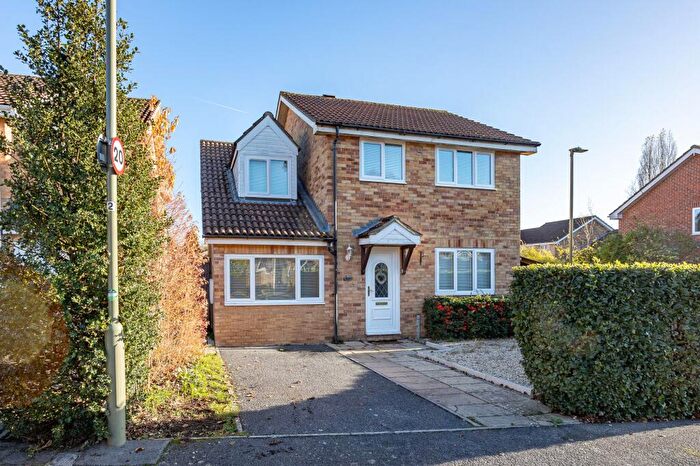
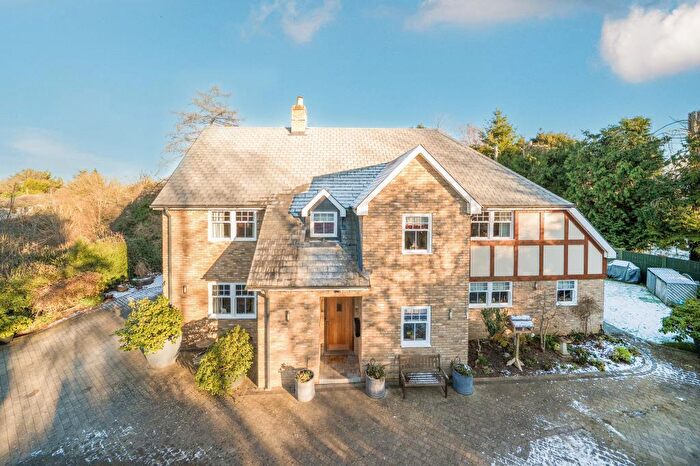
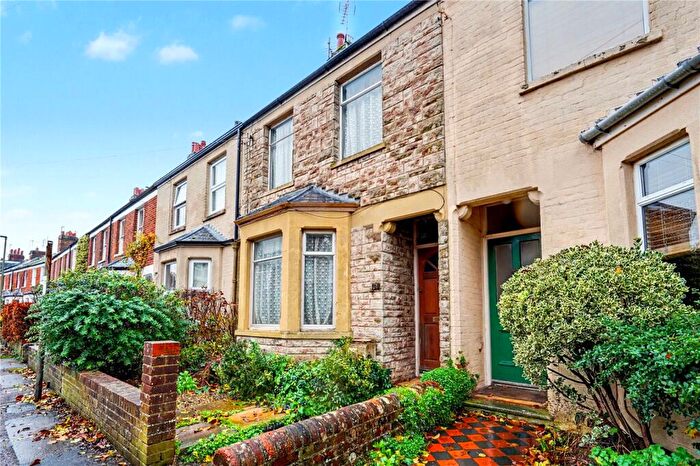
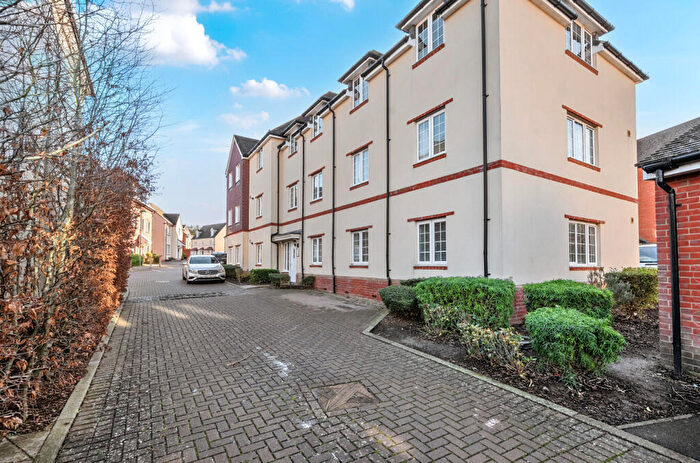
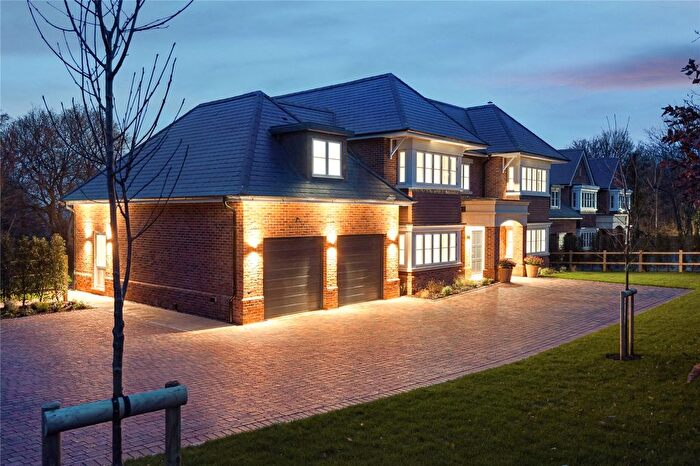
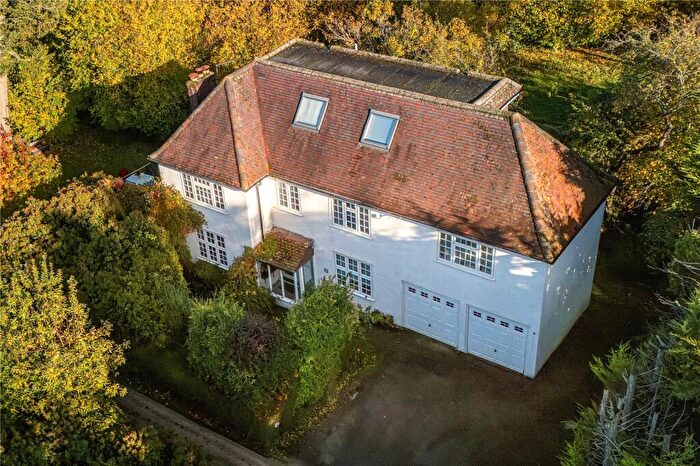
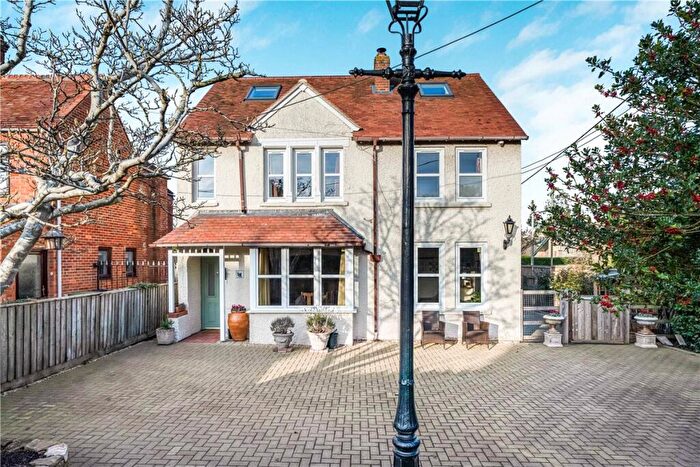
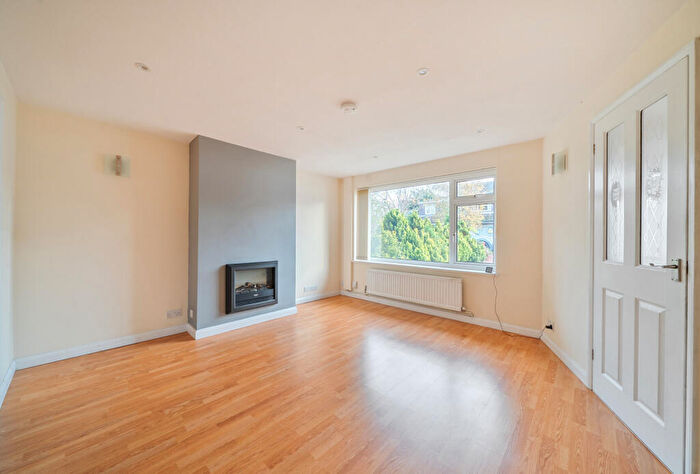
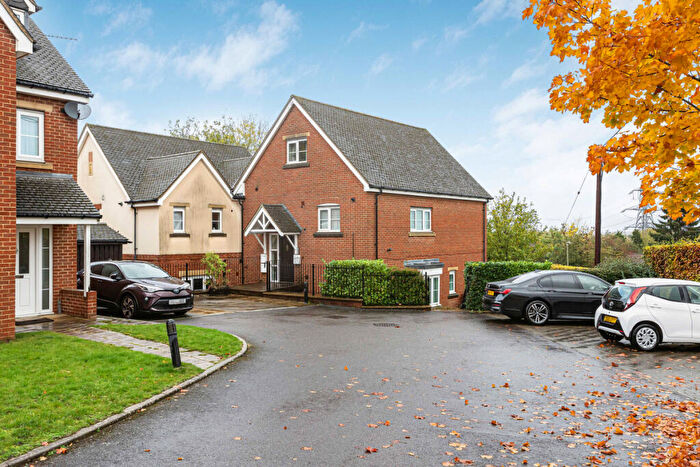
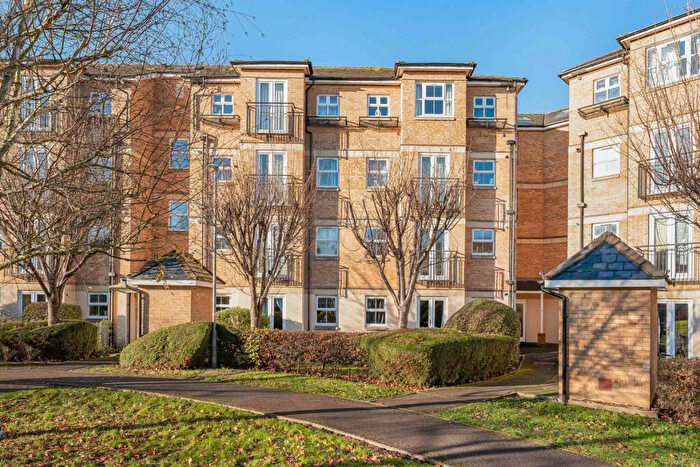
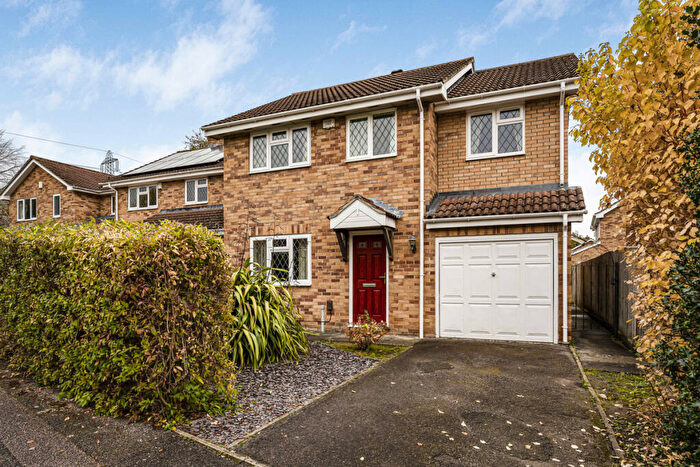
Houses for sale & to rent in North Hinksey And Wytham, Oxford
House Prices in North Hinksey And Wytham
Properties in North Hinksey And Wytham have an average house price of £506,832.00 and had 199 Property Transactions within the last 3 years¹.
North Hinksey And Wytham is an area in Oxford, Oxfordshire with 1,681 households², where the most expensive property was sold for £1,750,000.00.
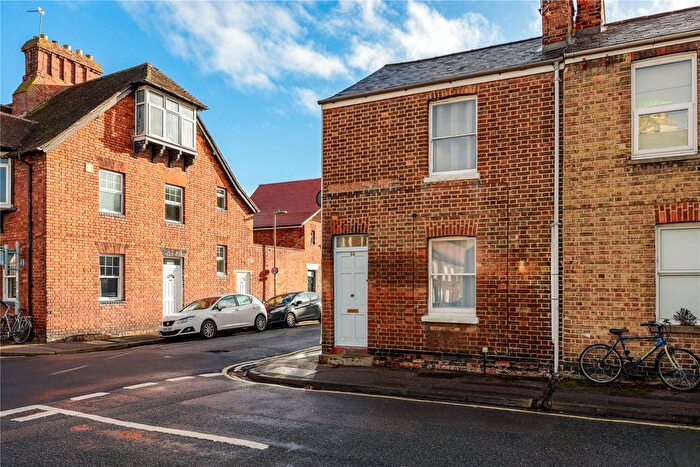
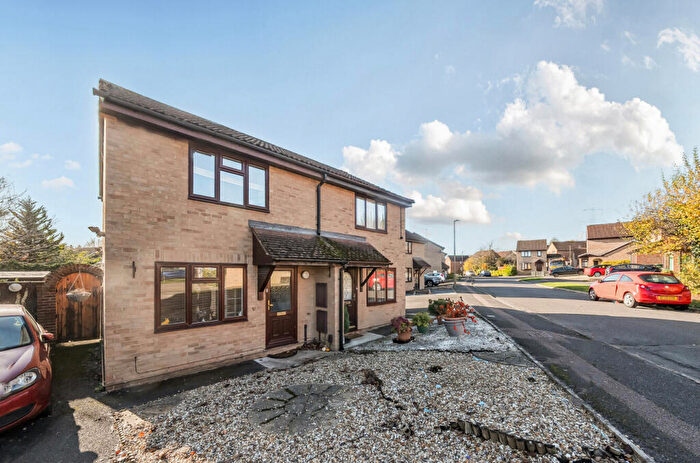
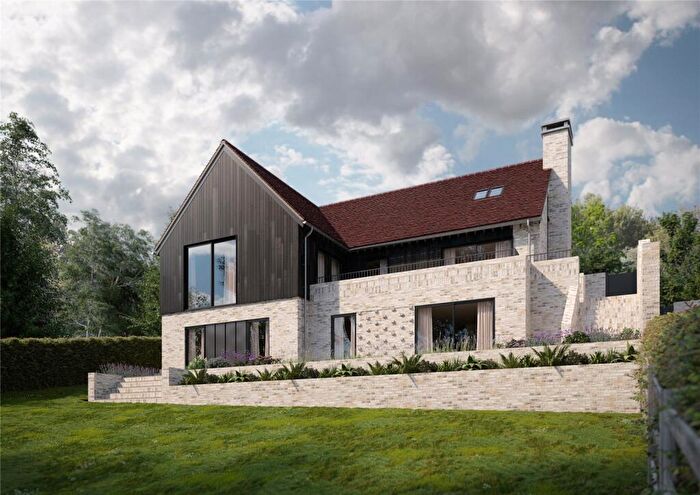
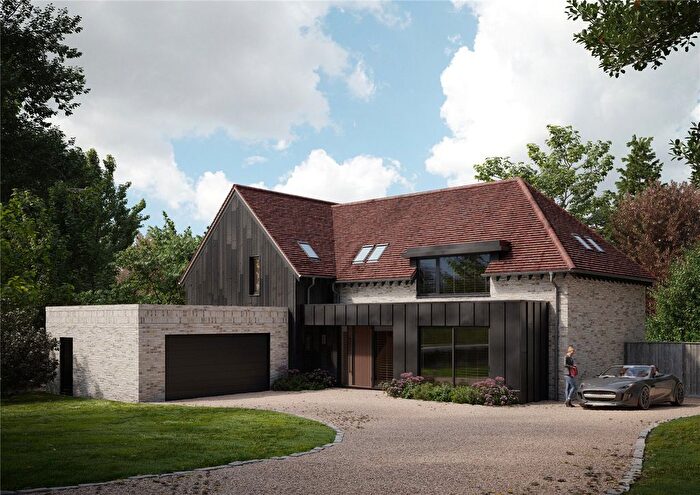
Properties for sale in North Hinksey And Wytham
Roads and Postcodes in North Hinksey And Wytham
Navigate through our locations to find the location of your next house in North Hinksey And Wytham, Oxford for sale or to rent.
| Streets | Postcodes |
|---|---|
| Arnolds Way | OX2 9JD |
| Arthray Road | OX2 9AA OX2 9AB OX2 9AD |
| Ash Close | OX2 9GS |
| Beech Road | OX2 9EE OX2 9EF |
| Brogden Close | OX2 9DS |
| Cedar Road | OX2 9EB OX2 9ED |
| Chestnut Road | OX2 9EA OX2 9EP |
| Conifer Close | OX2 9HP |
| Cope Close | OX2 9AJ |
| Crabtree Road | OX2 9DT OX2 9DU |
| Crozier Close | OX2 9AP |
| Cumnor Hill | OX2 9EU OX2 9FZ |
| Cumnor Rise Road | OX2 9HD |
| Delawarr Court | OX2 9AR |
| Elms Road | OX2 9JZ |
| Finmore Road | OX2 9AE |
| Grosvenor Road | OX2 9AX |
| Harcourt Hill | OX2 9AS |
| Hawthorn Close | OX2 9DY |
| Hazel Road | OX2 9LE OX2 9LF |
| Hurst Rise Road | OX2 9HE OX2 9HF OX2 9HQ |
| Hutchcomb Road | OX2 9HL OX2 9HN |
| Laburnum Road | OX2 9EL OX2 9EN |
| Larch Close | OX2 9EW |
| Lime Road | OX2 9EG OX2 9EQ |
| Maple Close | OX2 9DZ |
| Montagu Road | OX2 9AH OX2 9AQ |
| North Hinksey Lane | OX2 0JS OX2 0LT OX2 0LU OX2 0LX OX2 0LY OX2 0LZ |
| North Hinksey Village | OX2 0NA |
| Nursery Close | OX2 9GF |
| Old Botley | OX2 0JR |
| Poplar Road | OX2 9LA OX2 9LB |
| Raleigh Park Road | OX2 9AZ OX2 9GE |
| Seacourt Road | OX2 9LD |
| Southern By Pass | OX2 0LA OX2 0LJ OX2 0LN |
| Springfield Road | OX2 9HJ |
| St Pauls Crescent | OX2 9AF OX2 9AG |
| Stanley Close | OX2 0LB |
| Stanton Road | OX2 9AY |
| Sweetmans Road | OX2 9BA |
| Sycamore Road | OX2 9EJ |
| The Garth | OX2 9AL |
| Toynbee Close | OX2 9HW |
| Vernon Avenue | OX2 9AU |
| West Way | OX2 0JE OX2 9JT OX2 9JU OX2 9JY |
| Westminster Way | OX2 0LP OX2 0LR OX2 0LW |
| Yarnells Hill | OX2 9BD OX2 9BE OX2 9BG OX2 9FE |
| Yarnells Road | OX2 0JY |
| OX2 8QE |
Transport near North Hinksey And Wytham
- FAQ
- Price Paid By Year
- Property Type Price
Frequently asked questions about North Hinksey And Wytham
What is the average price for a property for sale in North Hinksey And Wytham?
The average price for a property for sale in North Hinksey And Wytham is £506,832. This amount is 11% lower than the average price in Oxford. There are 860 property listings for sale in North Hinksey And Wytham.
What streets have the most expensive properties for sale in North Hinksey And Wytham?
The streets with the most expensive properties for sale in North Hinksey And Wytham are Vernon Avenue at an average of £1,750,000, Grosvenor Road at an average of £1,600,000 and Cumnor Rise Road at an average of £1,164,983.
What streets have the most affordable properties for sale in North Hinksey And Wytham?
The streets with the most affordable properties for sale in North Hinksey And Wytham are Nursery Close at an average of £267,500, Cumnor Hill at an average of £318,750 and Sweetmans Road at an average of £345,625.
Which train stations are available in or near North Hinksey And Wytham?
Some of the train stations available in or near North Hinksey And Wytham are Oxford, Oxford Parkway and Radley.
Property Price Paid in North Hinksey And Wytham by Year
The average sold property price by year was:
| Year | Average Sold Price | Price Change |
Sold Properties
|
|---|---|---|---|
| 2025 | £526,108 | 3% |
45 Properties |
| 2024 | £509,228 | 3% |
56 Properties |
| 2023 | £491,513 | -2% |
45 Properties |
| 2022 | £500,940 | -12% |
53 Properties |
| 2021 | £558,938 | 13% |
82 Properties |
| 2020 | £487,462 | 18% |
55 Properties |
| 2019 | £397,585 | -16% |
64 Properties |
| 2018 | £460,500 | 1% |
65 Properties |
| 2017 | £455,068 | 3% |
82 Properties |
| 2016 | £443,345 | 5% |
74 Properties |
| 2015 | £419,108 | 16% |
62 Properties |
| 2014 | £353,617 | 6% |
87 Properties |
| 2013 | £332,763 | -1% |
72 Properties |
| 2012 | £336,988 | 8% |
64 Properties |
| 2011 | £308,782 | -0,4% |
57 Properties |
| 2010 | £309,996 | 23% |
61 Properties |
| 2009 | £237,943 | -31% |
83 Properties |
| 2008 | £312,808 | -12% |
46 Properties |
| 2007 | £348,929 | 21% |
89 Properties |
| 2006 | £275,432 | 7% |
114 Properties |
| 2005 | £256,735 | -4% |
72 Properties |
| 2004 | £266,100 | 15% |
68 Properties |
| 2003 | £225,109 | 12% |
71 Properties |
| 2002 | £197,564 | 14% |
81 Properties |
| 2001 | £170,319 | -13% |
79 Properties |
| 2000 | £192,841 | 26% |
64 Properties |
| 1999 | £143,489 | 15% |
91 Properties |
| 1998 | £121,941 | 10% |
78 Properties |
| 1997 | £109,703 | 16% |
67 Properties |
| 1996 | £92,260 | 1% |
81 Properties |
| 1995 | £91,331 | - |
60 Properties |
Property Price per Property Type in North Hinksey And Wytham
Here you can find historic sold price data in order to help with your property search.
The average Property Paid Price for specific property types in the last three years are:
| Property Type | Average Sold Price | Sold Properties |
|---|---|---|
| Semi Detached House | £472,477.00 | 113 Semi Detached Houses |
| Detached House | £855,137.00 | 37 Detached Houses |
| Terraced House | £437,181.00 | 9 Terraced Houses |
| Flat | £297,374.00 | 40 Flats |

