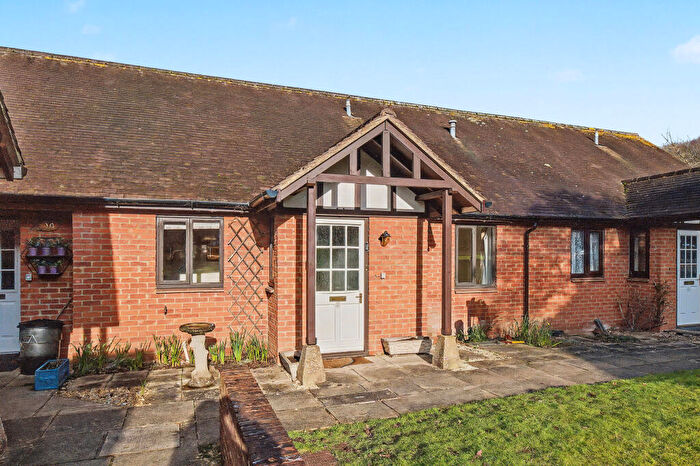
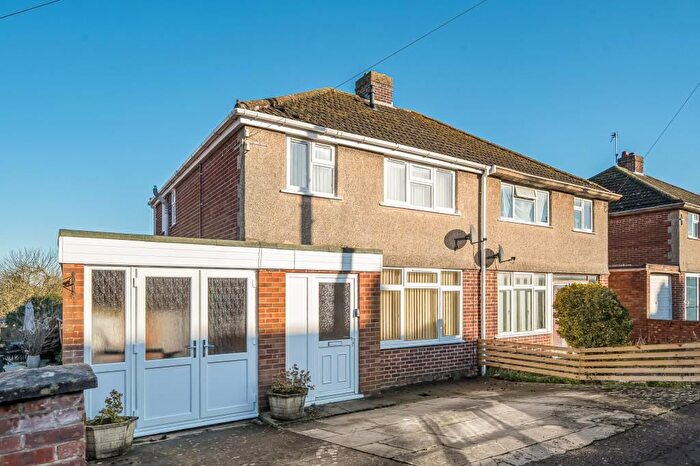
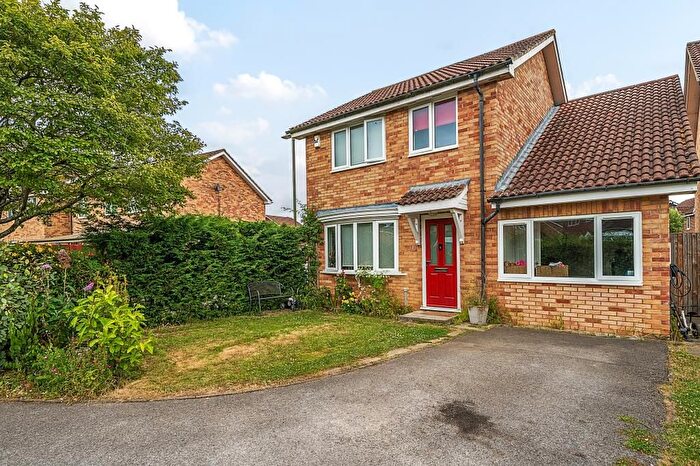
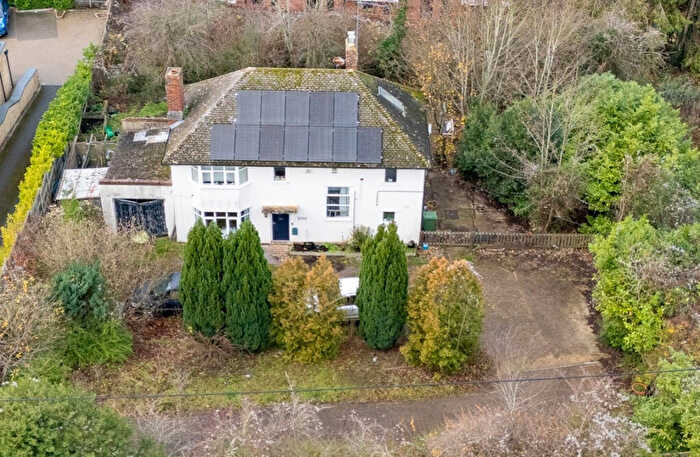
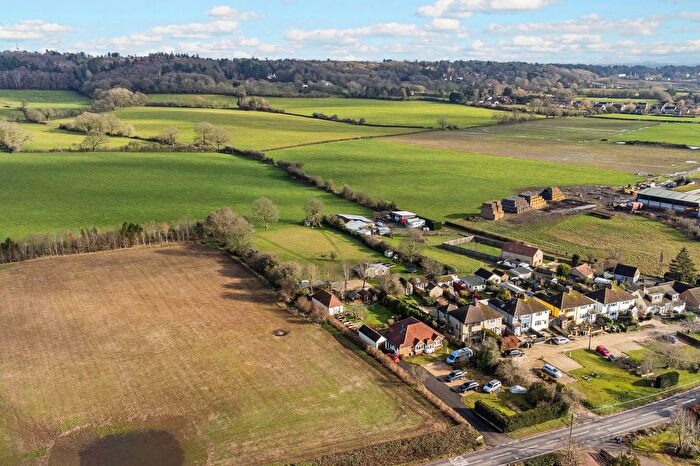
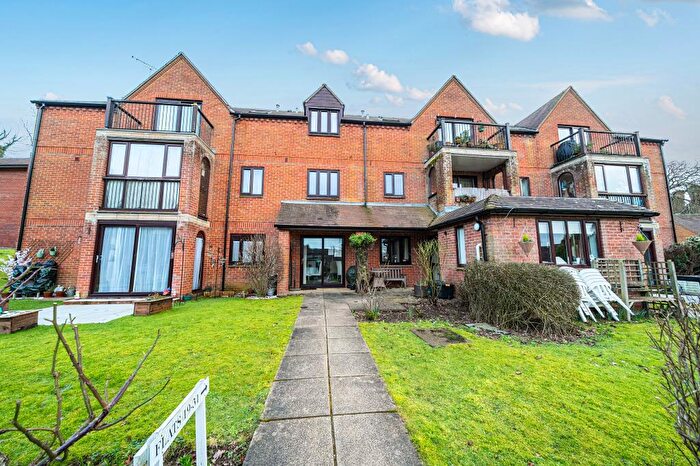
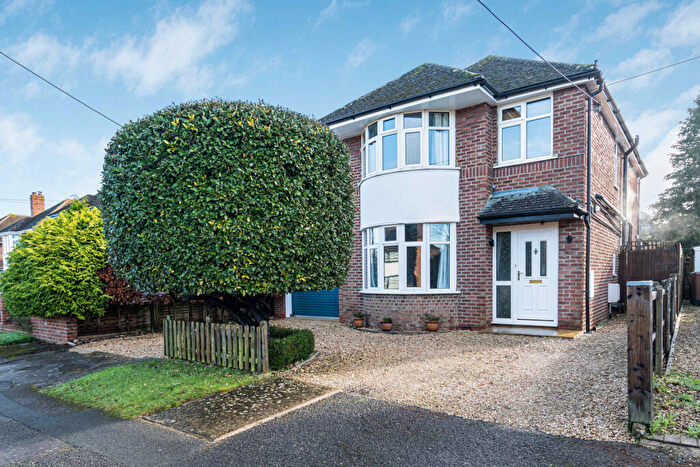
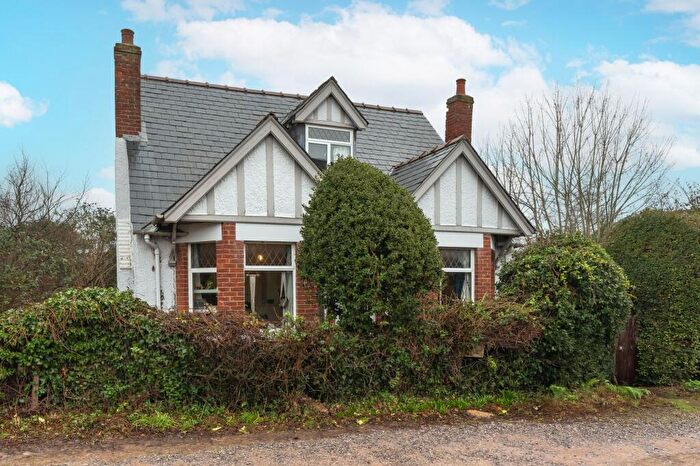
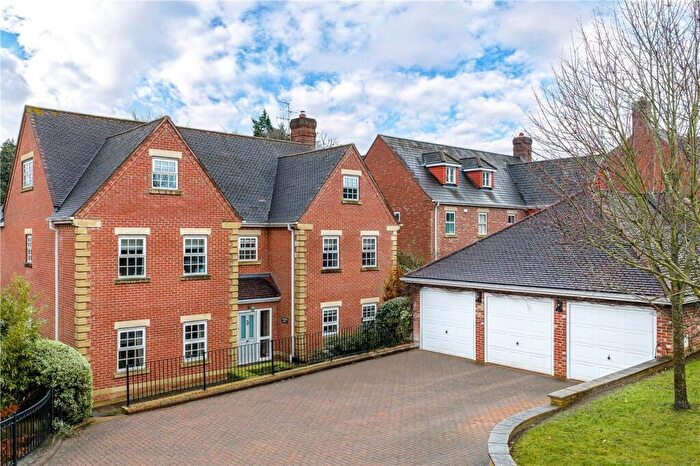
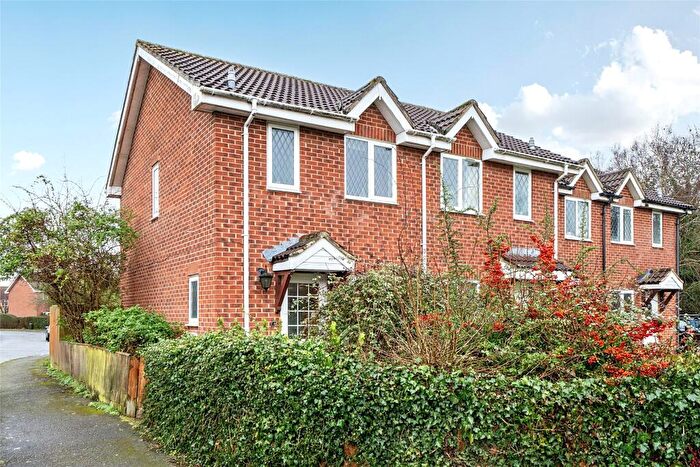
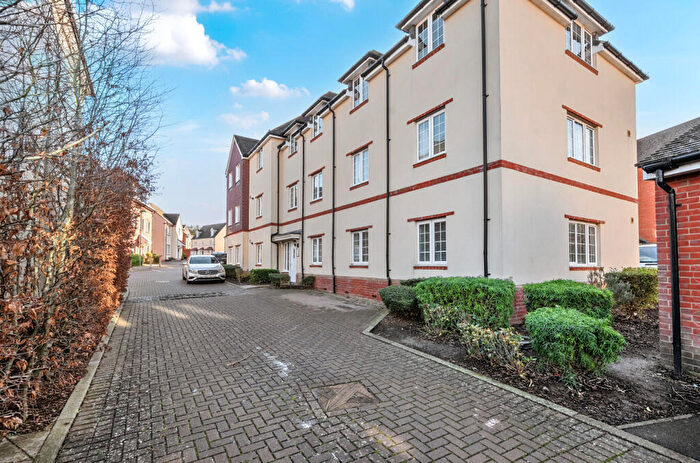
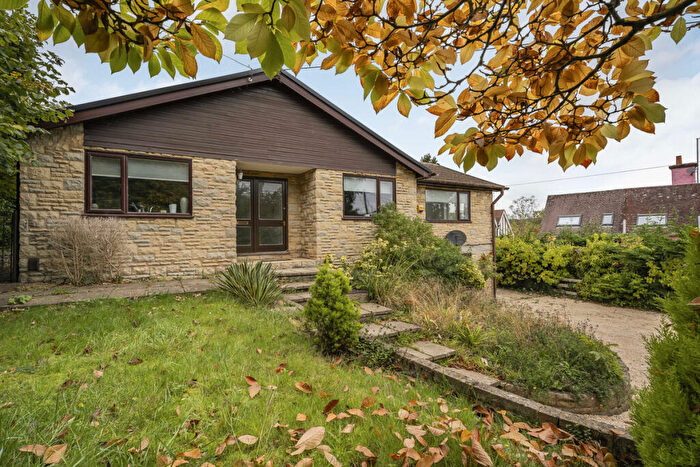
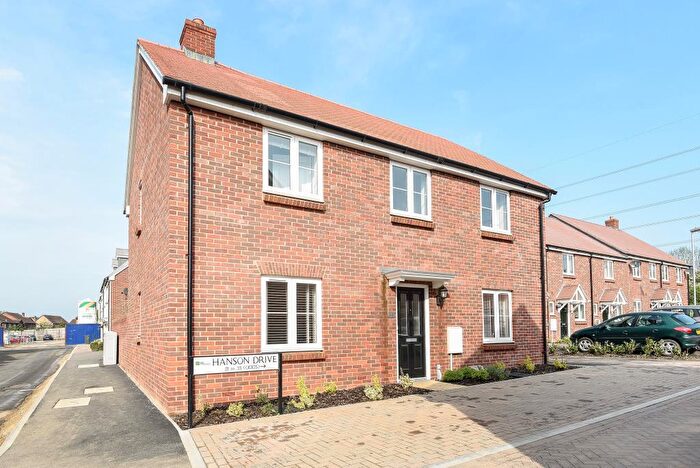
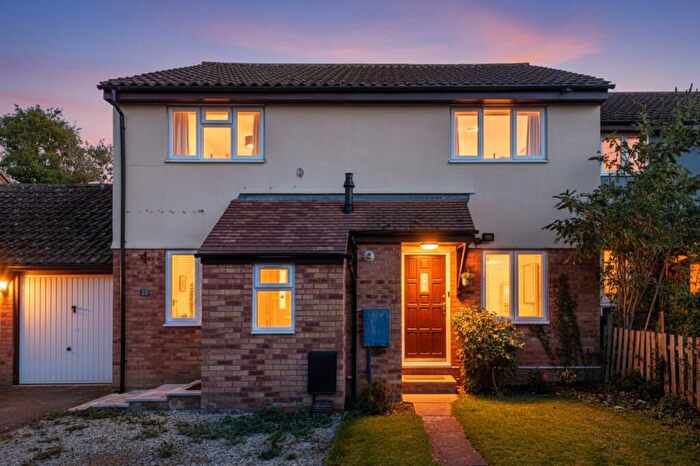
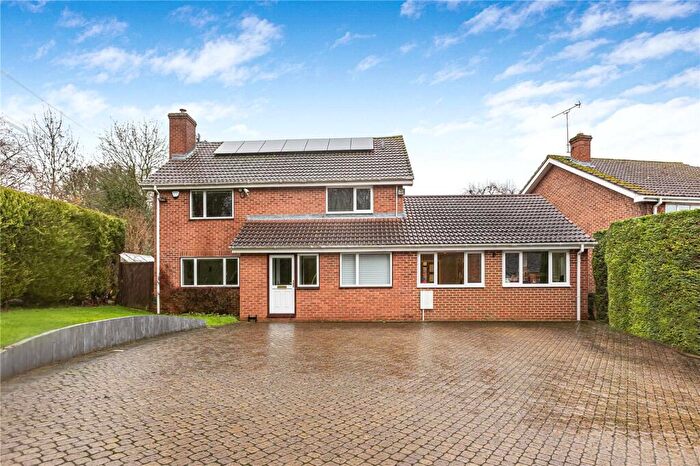
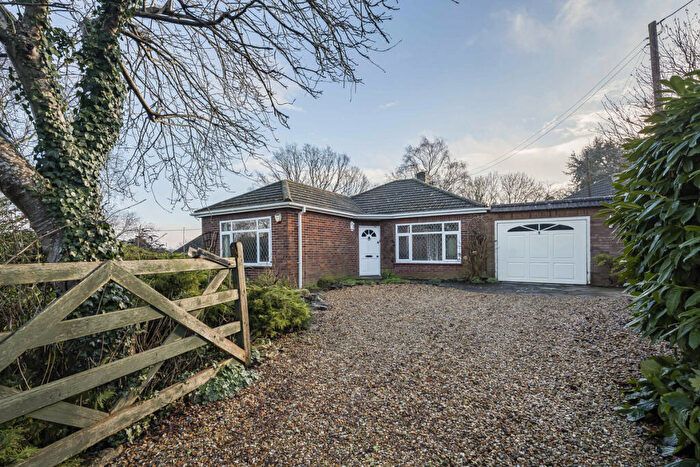
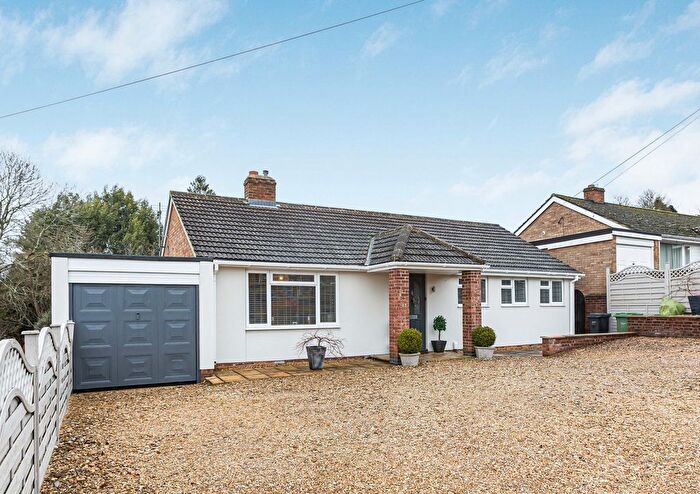
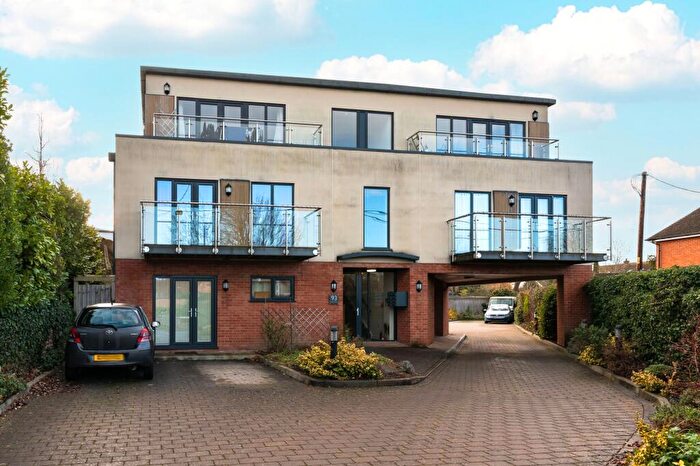
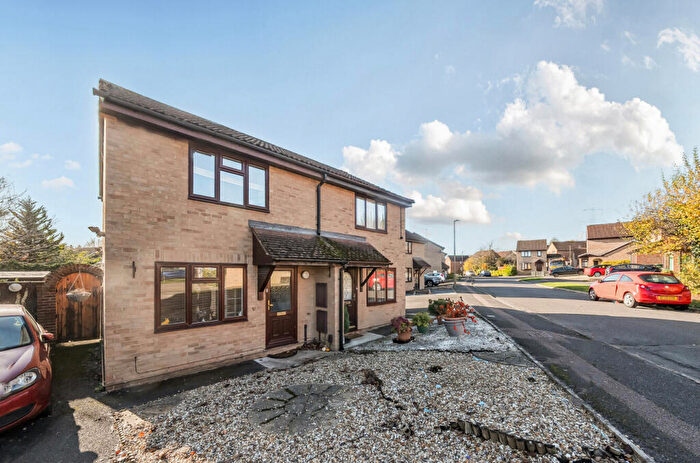
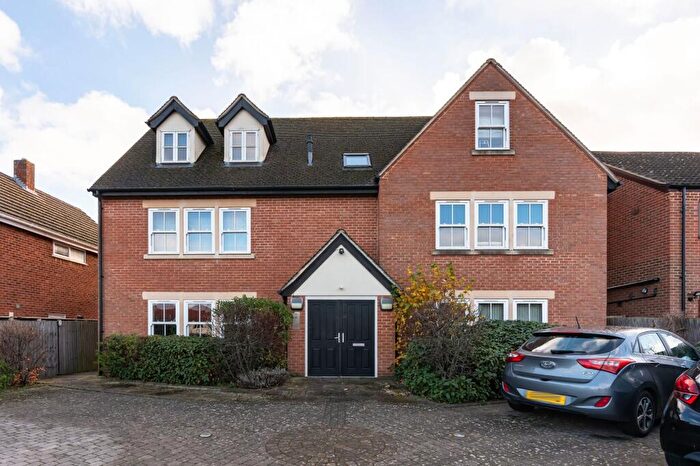
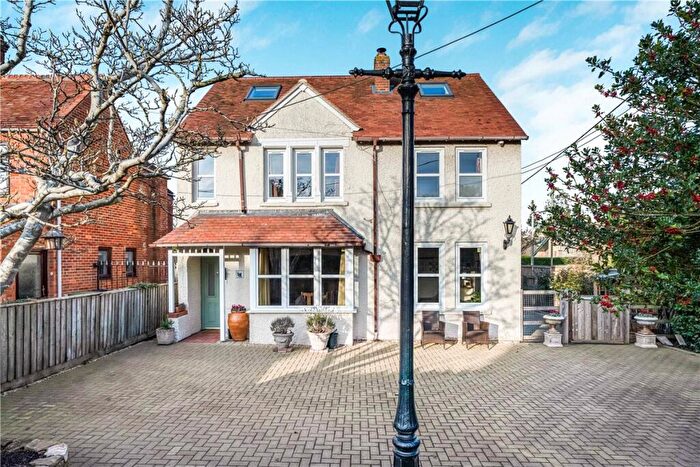
Houses for sale & to rent in Cumnor, Oxford
House Prices in Cumnor
Properties in Cumnor have an average house price of £594,500.00 and had 8 Property Transactions within the last 3 years¹.
Cumnor is an area in Oxford, Oxfordshire with 55 households², where the most expensive property was sold for £1,460,000.00.
Properties for sale in Cumnor
Roads and Postcodes in Cumnor
Navigate through our locations to find the location of your next house in Cumnor, Oxford for sale or to rent.
| Streets | Postcodes |
|---|---|
| Appleton Road | OX2 9QL |
| Arnolds Way | OX2 9JE |
| Boars Hill | OX1 5HB |
| Chawley Park | OX2 9GG |
| Cumnor Hill | OX2 9PL OX2 9PW OX2 9SY |
| Eynsham Road | OX2 9NH OX2 9NJ OX2 9NQ OX2 9TN |
| Faringdon Road | OX2 9QX OX2 9QZ |
| Farmoor Court | OX2 9LU |
| Hanson Drive | OX2 9RY |
| Hope Way | OX2 9RZ |
| Leys Road | OX2 9QG OX2 9QQ |
| Martin Close | OX2 9GU |
| Pine Rise | OX2 9SZ |
| Robsart Place | OX2 9RH |
| Sir Bevys Close | OX2 9RN |
| Thackeray Close | OX2 9GZ |
| The Glebe | OX2 9RL |
| Tudor Court Park | OX2 9NG |
| Vale View | OX2 9SS |
| Youlbury | OX1 5HA |
| OX2 9QU OX2 9TX |
Transport near Cumnor
-
Oxford Station
-
Oxford Parkway Station
-
Radley Station
-
Hanborough Station
-
Islip Station
-
Culham Station
-
Combe Station
-
Appleford Station
-
Didcot Parkway Station
-
Tackley Station
- FAQ
- Price Paid By Year
- Property Type Price
Frequently asked questions about Cumnor
What is the average price for a property for sale in Cumnor?
The average price for a property for sale in Cumnor is £594,500. This amount is 4% higher than the average price in Oxford. There are 685 property listings for sale in Cumnor.
What streets have the most expensive properties for sale in Cumnor?
The streets with the most expensive properties for sale in Cumnor are Vale View at an average of £1,460,000, Hope Way at an average of £585,000 and Hanson Drive at an average of £484,500.
What streets have the most affordable properties for sale in Cumnor?
The streets with the most affordable properties for sale in Cumnor are Faringdon Road at an average of £400,000 and Martin Close at an average of £467,500.
Which train stations are available in or near Cumnor?
Some of the train stations available in or near Cumnor are Oxford, Oxford Parkway and Radley.
Property Price Paid in Cumnor by Year
The average sold property price by year was:
| Year | Average Sold Price | Price Change |
Sold Properties
|
|---|---|---|---|
| 2025 | £1,030,000 | 56% |
2 Properties |
| 2024 | £454,750 | 4% |
4 Properties |
| 2023 | £438,500 | -112% |
2 Properties |
| 2022 | £930,000 | 18% |
3 Properties |
| 2021 | £759,916 | 30% |
6 Properties |
| 2020 | £532,669 | 17% |
21 Properties |
| 2019 | £444,125 | -103% |
4 Properties |
| 2018 | £902,990 | 50% |
5 Properties |
| 2017 | £447,746 | -20% |
14 Properties |
| 2016 | £536,064 | 12% |
7 Properties |
| 2015 | £474,067 | 23% |
17 Properties |
| 2014 | £364,118 | 18% |
28 Properties |
| 2006 | £300,000 | - |
1 Property |
Property Price per Property Type in Cumnor
Here you can find historic sold price data in order to help with your property search.
The average Property Paid Price for specific property types in the last three years are:
| Property Type | Average Sold Price | Sold Properties |
|---|---|---|
| Semi Detached House | £467,500.00 | 2 Semi Detached Houses |
| Flat | £407,000.00 | 1 Flat |
| Detached House | £761,250.00 | 4 Detached Houses |
| Terraced House | £369,000.00 | 1 Terraced House |

