
Houses for sale & to rent in OX44 7SE, Cromwell Close, Chalgrove, Oxford
House Prices in OX44 7SE, Cromwell Close, Chalgrove
Properties in OX44 7SE have an average house price of £410,000.00 and had 1 Property Transaction within the last 3 years.¹ OX44 7SE is a postcode in Cromwell Close located in Chalgrove, an area in Oxford, Oxfordshire, with 5 households², where the most expensive property was sold for £410,000.00.
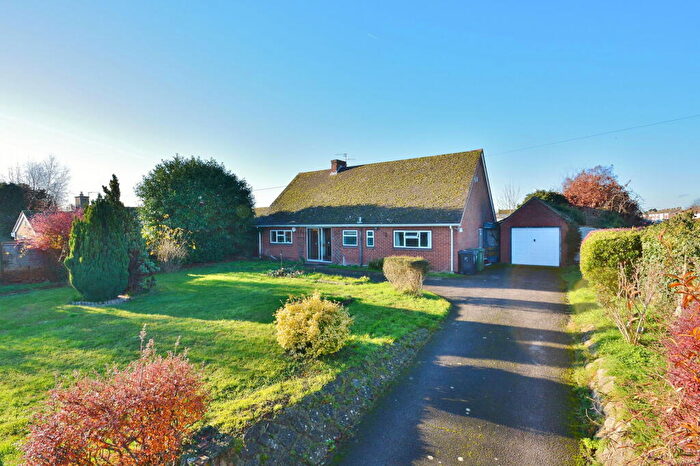
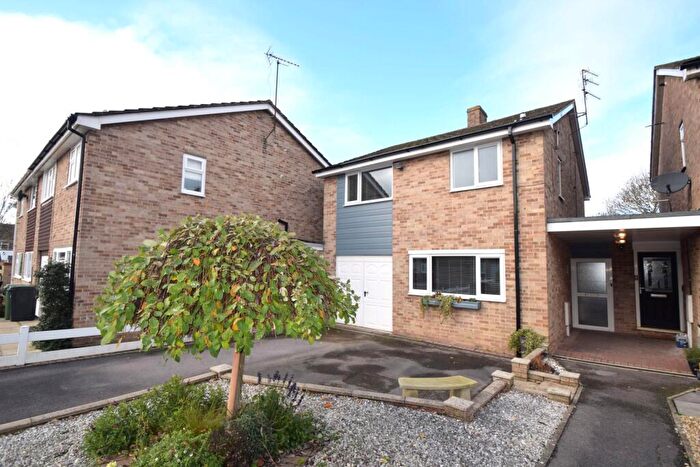
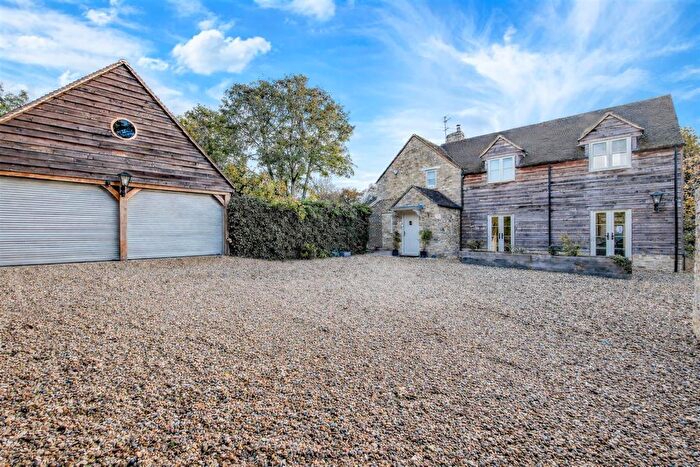
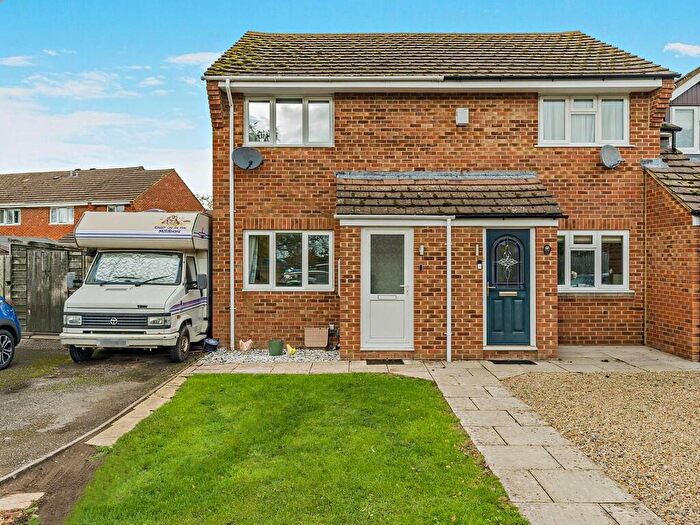
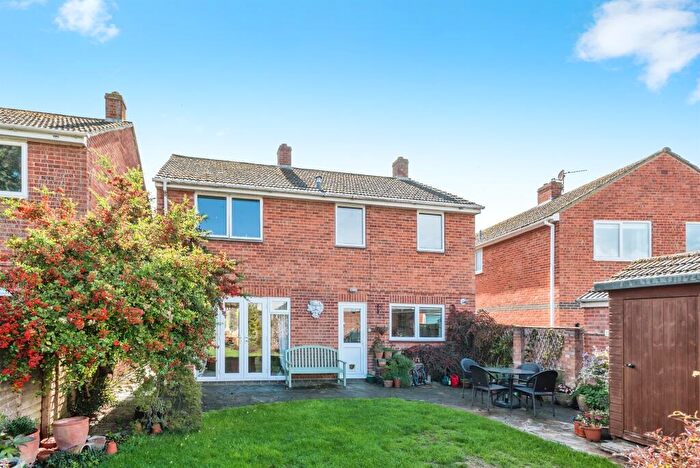
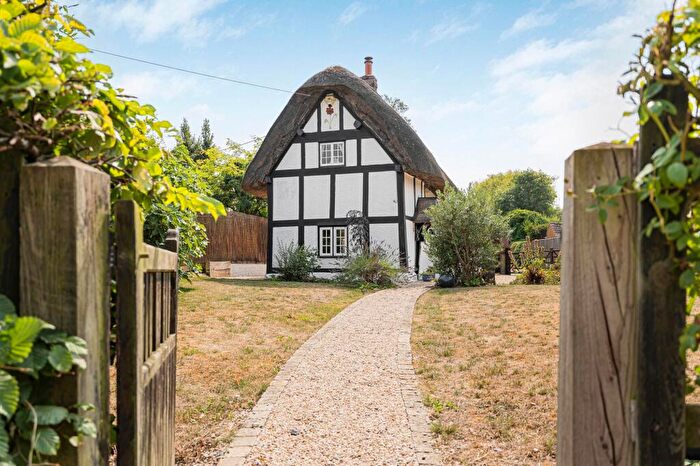
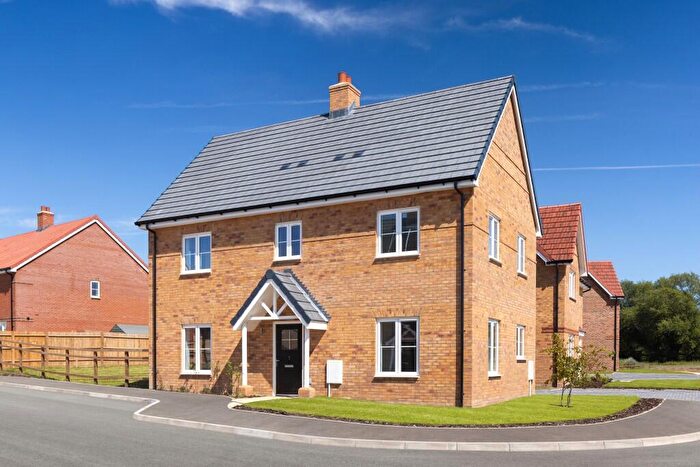
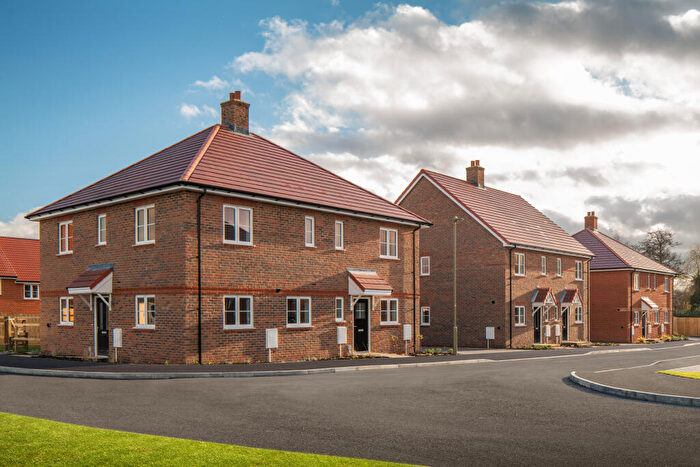
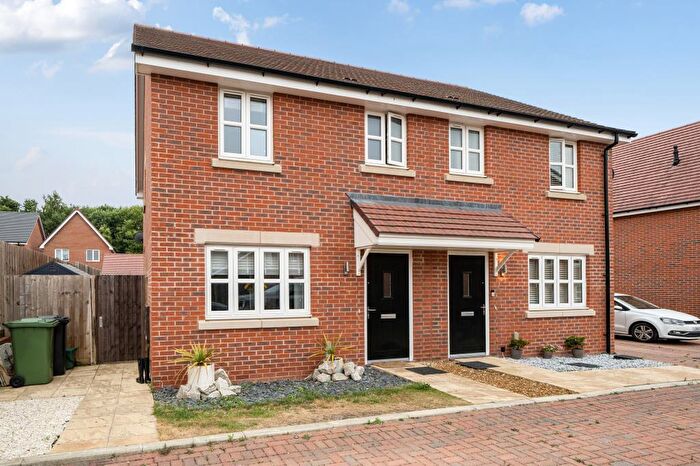
Properties for sale near OX44 7SE, Cromwell Close
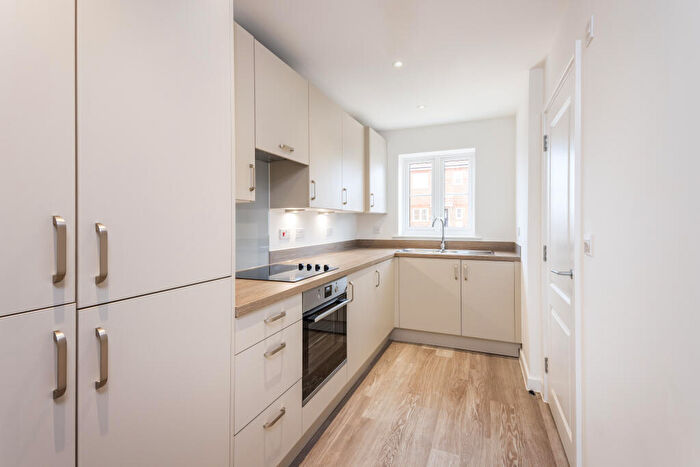
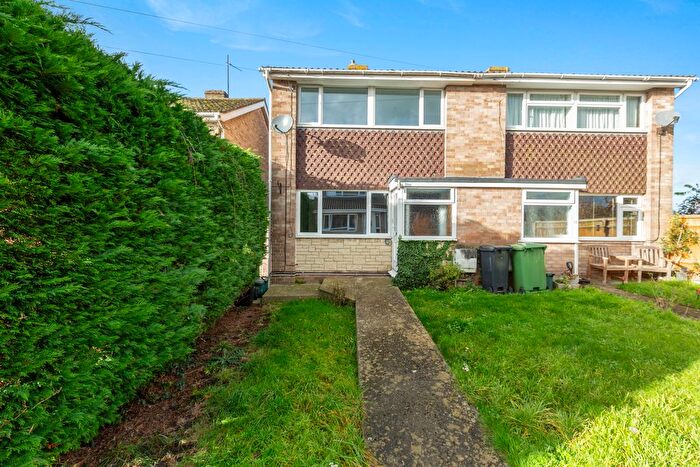
![]()
If you are looking to sell your house, let it out, or receive a property valuation, an expert can help you.
Click the button below to get started.
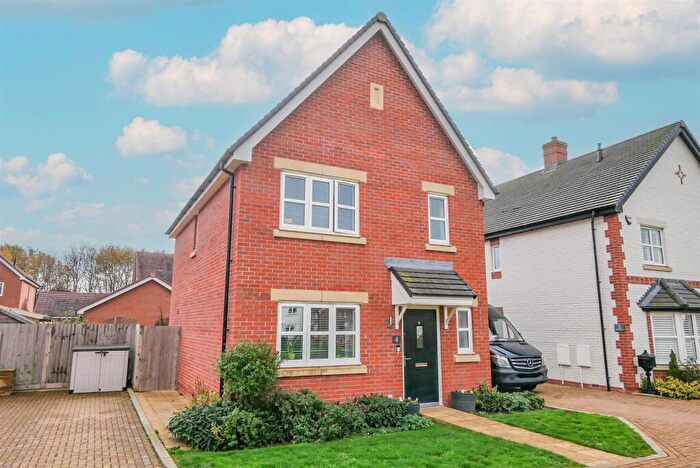
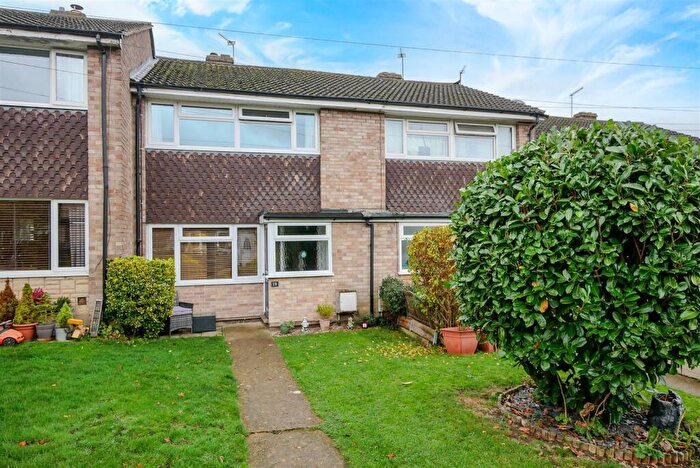
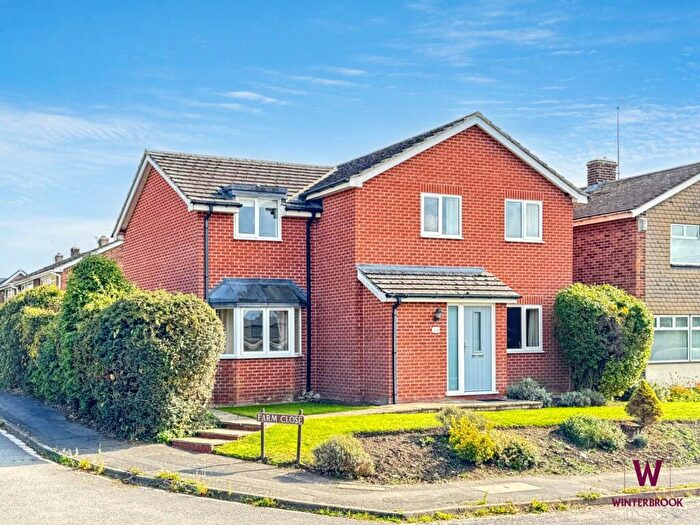
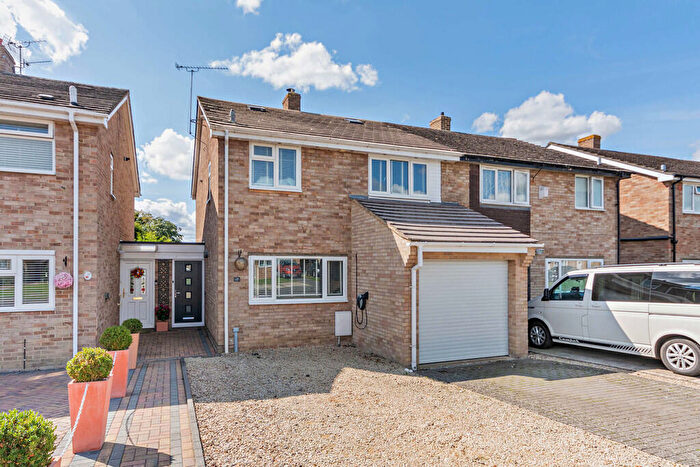
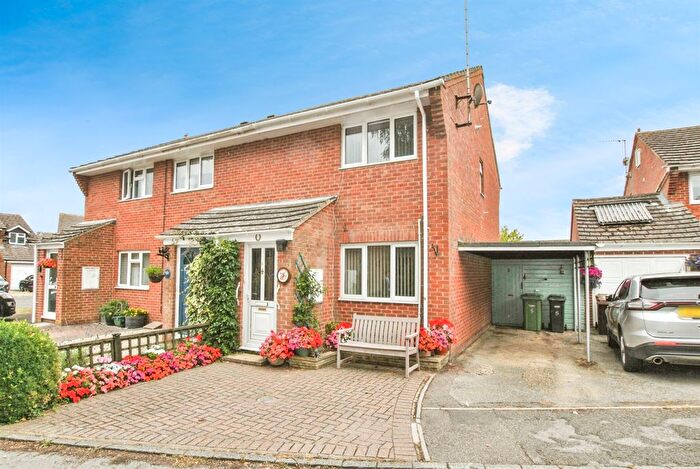
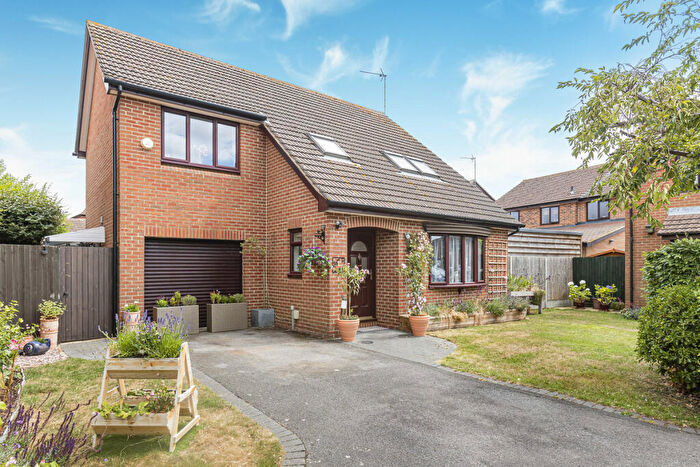
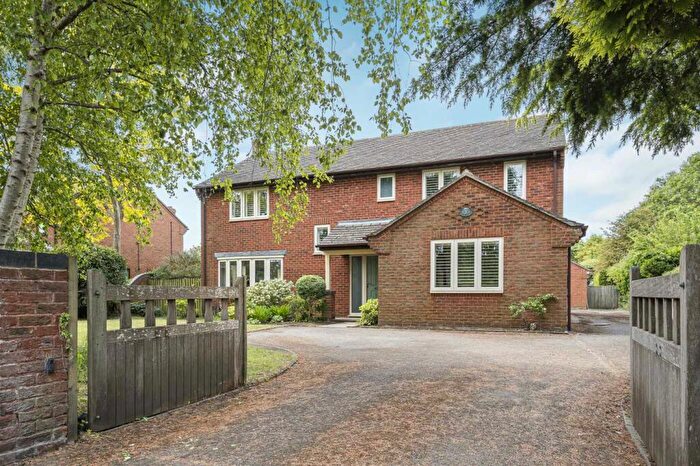
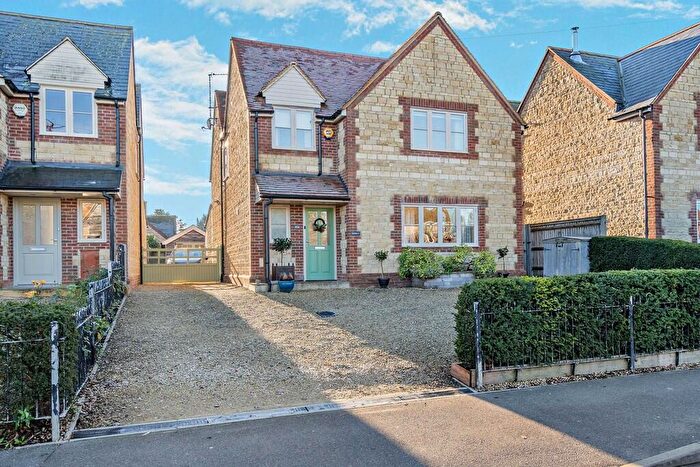
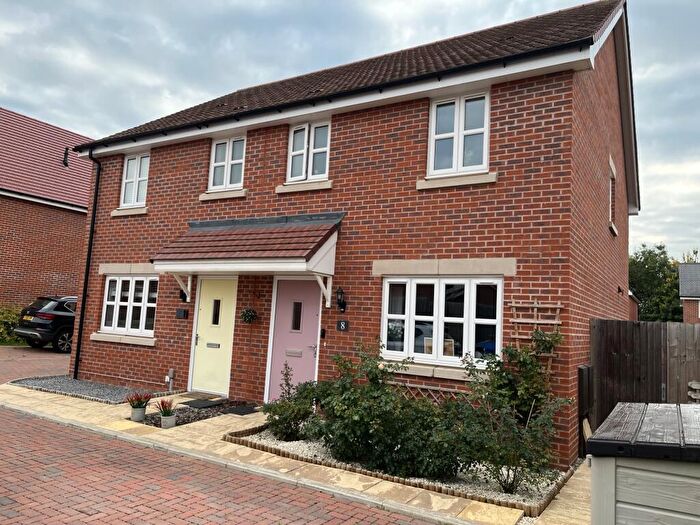
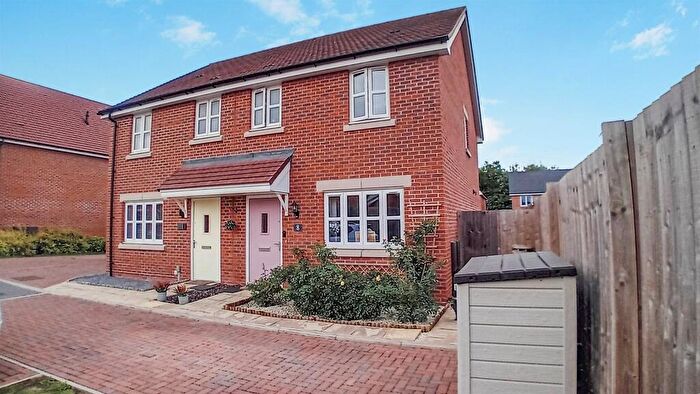
Previously listed properties near OX44 7SE, Cromwell Close
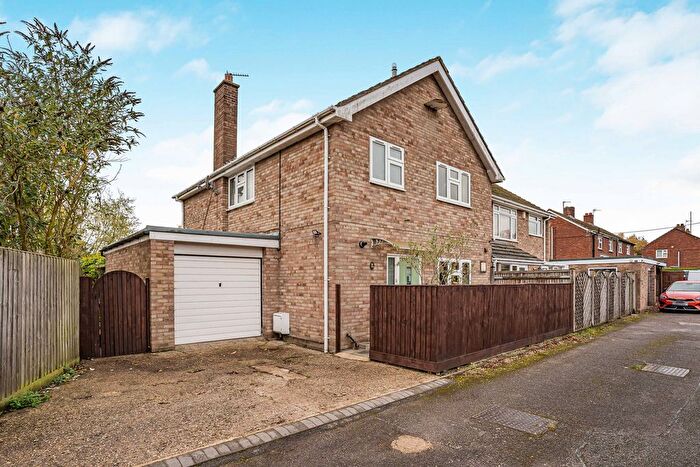
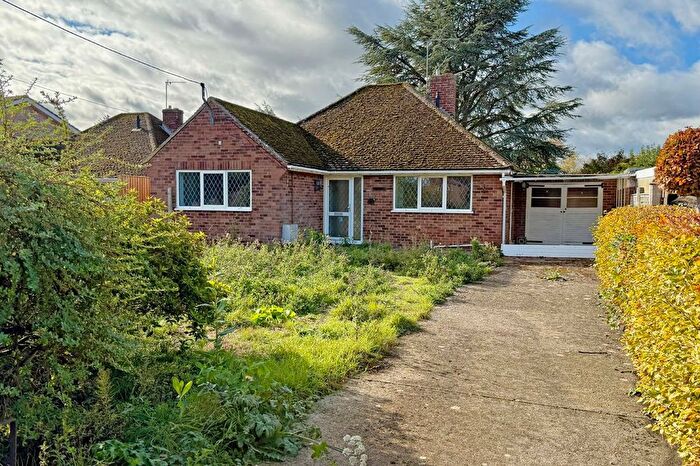
![]()
If you are looking to sell your house, let it out, or receive a property valuation, an expert can help you.
Click the button below to get started.
Price Paid in Cromwell Close, OX44 7SE, Chalgrove
3 Cromwell Close, OX44 7SE, Chalgrove Oxford
Property 3 has been sold 1 time. The last time it was sold was in 07/08/2024 and the sold price was £410,000.00.
This detached house, sold as a freehold on 07/08/2024, is a 91 sqm detached bungalow with an EPC rating of D.
| Date | Price | Property Type | Tenure | Classification |
|---|---|---|---|---|
| 07/08/2024 | £410,000.00 | Detached House | freehold | Established Building |
5 Cromwell Close, OX44 7SE, Chalgrove Oxford
Property 5 has been sold 3 times. The last time it was sold was in 20/08/2021 and the sold price was £440,000.00.
This detached house, sold as a freehold on 20/08/2021, is a 75 sqm detached bungalow with an EPC rating of D.
| Date | Price | Property Type | Tenure | Classification |
|---|---|---|---|---|
| 20/08/2021 | £440,000.00 | Detached House | freehold | Established Building |
| 13/04/2018 | £435,000.00 | Detached House | freehold | Established Building |
| 26/06/2015 | £283,500.00 | Detached House | freehold | Established Building |
1 Cromwell Close, OX44 7SE, Chalgrove Oxford
Property 1 has been sold 1 time. The last time it was sold was in 27/04/2011 and the sold price was £325,000.00.
This detached house, sold as a freehold on 27/04/2011, is a 129 sqm detached bungalow with an EPC rating of E.
| Date | Price | Property Type | Tenure | Classification |
|---|---|---|---|---|
| 27/04/2011 | £325,000.00 | Detached House | freehold | Established Building |
Transport near OX44 7SE, Cromwell Close
-
 Culham Station
 -
Radley Station
-
Appleford Station
-
Cholsey Station
-
Didcot Parkway Station
-
Haddenham and Thame Parkway Station
House price paid reports for OX44 7SE, Cromwell Close
Click on the buttons below to see price paid reports by year or property price:
- Price Paid By Year
- Property Type Price
Property Price Paid in OX44 7SE, Cromwell Close by Year
The average sold property price by year was:
| Year | Average Sold Price | Price Change |
Sold Properties
|
|---|---|---|---|
| 2024 | £410,000 | -7% |
1 Property |
| 2021 | £440,000 | 1% |
1 Property |
| 2018 | £435,000 | 35% |
1 Property |
| 2015 | £283,500 | -15% |
1 Property |
| 2011 | £325,000 | - |
1 Property |
Property Price per Property Type in OX44 7SE, Cromwell Close
Here you can find historic sold price data in order to help with your property search.
The average Property Paid Price for specific property types in the last three years are:
| Property Type | Average Sold Price | Sold Properties |
|---|---|---|
| Detached House | £410,000.00 | 1 Detached House |