
Houses for sale & to rent in Marston, Oxford
House Prices in Marston
Properties in Marston have an average house price of £533k and had 177 Property Transactions within the last 3 years¹.
Marston is an area in Oxford, Oxfordshire with 2,503 households², where the most expensive property was sold for £1.9M.
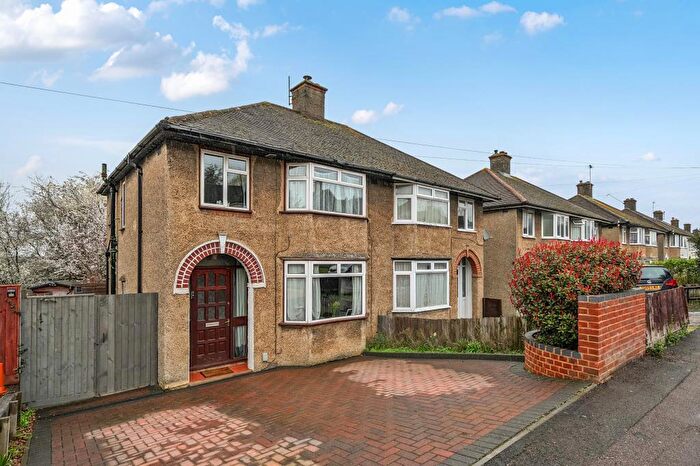
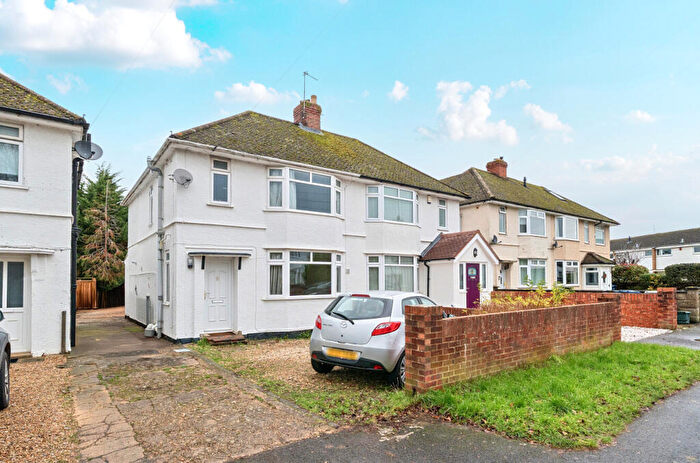
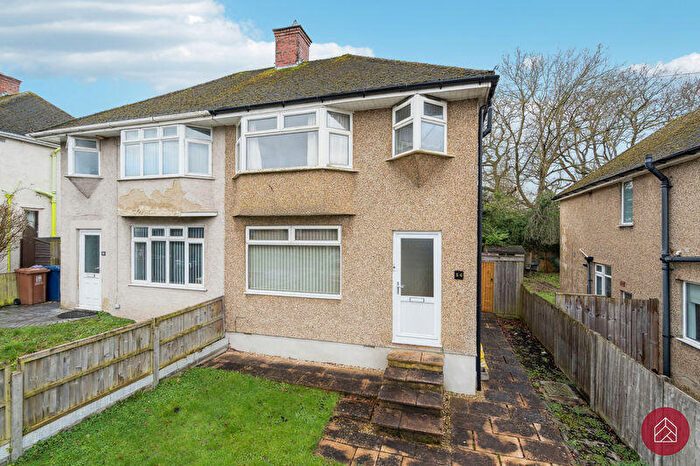
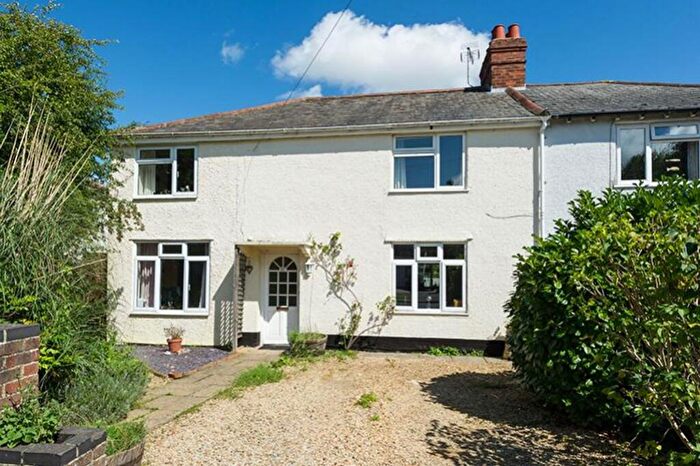
Properties for sale in Marston
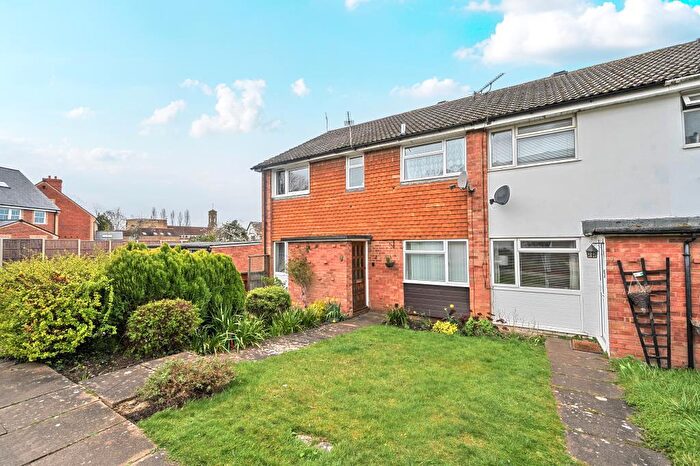
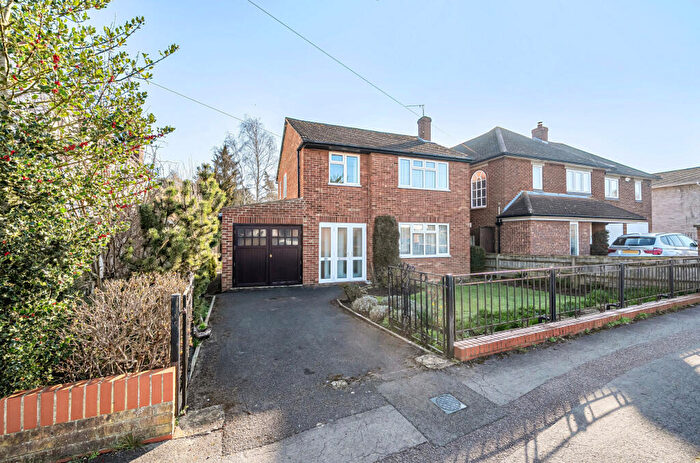
![]()
If you are looking to sell your house, let it out, or receive a property valuation, an expert can help you.
Click the button below to get started.
Roads and Postcodes in Marston
Navigate through our locations to find the location of your next house in Marston, Oxford for sale or to rent.
| Streets | Postcodes |
|---|---|
| Arlington Drive | OX3 0SH OX3 0SJ OX3 0SL |
| Ashlong Road | OX3 0NH |
| Barns Hay | OX3 0PN |
| Beechey Avenue | OX3 0JU |
| Boults Close | OX3 0PP |
| Boults Lane | OX3 0PW |
| Broughton Close | OX3 0RQ |
| Butts Lane | OX3 0PU |
| Cannons Field | OX3 0QR |
| Cavendish Drive | OX3 0SB OX3 0SD |
| Cherwell Drive | OX3 0LZ OX3 0NA OX3 0NB OX3 0ND OX3 0NY |
| Church Lane | OX3 0NZ OX3 0PT |
| Clays Close | OX3 0NX |
| Cotswold Crescent | OX3 0SG |
| Croft Close | OX3 0LH |
| Croft Road | OX3 0JX OX3 0JY OX3 0JZ OX3 0LA |
| Cromwell Close | OX3 0RW OX3 0FB |
| Cumberlege Close | OX3 0QW |
| Dents Close | OX3 0NP |
| Edgeway Road | OX3 0HD OX3 0HE OX3 0HF OX3 0HG OX3 0HH OX3 0HJ OX3 0HQ |
| Elms Drive | OX3 0NJ OX3 0NL OX3 0NN OX3 0NW |
| Elsfield Road | OX3 0PR |
| Ewin Close | OX3 0NE |
| Fairfax Avenue | OX3 0RP |
| Fane Road | OX3 0RZ OX3 0SA |
| Farmer Place | OX3 0LB |
| Ferry Road | OX3 0ET OX3 0EU OX3 0EX OX3 0EY OX3 0HA OX3 0HR |
| Goodson Walk | OX3 0HX |
| Gordon Close | OX3 0RG |
| Harlow Way | OX3 0QS |
| Hayes Close | OX3 0DZ |
| Haynes Road | OX3 0SE OX3 0SF |
| Heather Place | OX3 0LG |
| Horseman Close | OX3 0NR OX3 0NS OX3 0NT |
| Hugh Allen Crescent | OX3 0HL OX3 0HN |
| Jessops Close | OX3 0NU |
| John Garne Way | OX3 0TX |
| Lewell Avenue | OX3 0RL |
| Little Acreage | OX3 0PS |
| Lodge Close | OX3 0QP |
| Marsh Lane | OX3 0NF OX3 0NG OX3 0NQ |
| Marston Ferry Road | OX2 7WP |
| Marston Road | OX3 0EJ OX3 0EL OX3 0EN OX3 0EP OX3 0EW OX3 0JF OX3 0JG OX3 0JQ OX3 0DJ OX3 0EA OX3 0EG OX3 0EH OX3 0EQ |
| Mill Lane | OX3 0PY OX3 0QA OX3 0QB OX3 0PZ |
| Moody Road | OX3 0DH |
| Mortimer Drive | OX3 0RR OX3 0RS OX3 0RT OX3 0RU |
| Nicholas Avenue | OX3 0RN |
| Nicholson Road | OX3 0HW |
| Old Marston Road | OX3 0JP OX3 0JR |
| Ouseley Close | OX3 0JS |
| Oxford Road | OX3 0JT OX3 0PH OX3 0PQ OX3 0RA OX3 0RB OX3 0RD OX3 0RE OX3 0RF |
| Park Way | OX3 0QH |
| Parry Close | OX3 0HY |
| Peacock Road | OX3 0DQ |
| Ponds Lane | OX3 0PX |
| Prichard Road | OX3 0DG |
| Purcell Road | OX3 0EZ OX3 0HB |
| Raymund Road | OX3 0SN OX3 0SP OX3 0SW OX3 0PG OX3 0PJ OX3 0FS |
| Rimmer Close | OX3 0PB |
| Rippington Drive | OX3 0RH OX3 0RJ |
| Rylands | OX3 0SX |
| Salford Road | OX3 0RX OX3 0RY OX3 0FT |
| Southcroft | OX3 0PF |
| St Nicholas Park | OX3 0QN |
| Stainer Place | OX3 0LE |
| Taverner Place | OX3 0LF |
| Wards Caravan Site | OX3 0QL |
| Weldon Road | OX3 0HP |
| Westrup Close | OX3 0HZ |
| White Hart | OX3 0PL |
| William Street | OX3 0ER OX3 0ES |
| Windsor Crescent | OX3 0SQ |
| OX3 0FQ |
Transport near Marston

- FAQ
- Price Paid By Year
- Property Type Price
Frequently asked questions about Marston
What is the average price for a property for sale in Marston?
The average price for a property for sale in Marston is £533,086. This amount is 7% lower than the average price in Oxford. There are 647 property listings for sale in Marston.
What streets have the most expensive properties for sale in Marston?
The streets with the most expensive properties for sale in Marston are Boults Lane at an average of £1,600,000, Southcroft at an average of £1,375,000 and White Hart at an average of £1,300,000.
What streets have the most affordable properties for sale in Marston?
The streets with the most affordable properties for sale in Marston are Rippington Drive at an average of £289,500, Cavendish Drive at an average of £300,000 and John Garne Way at an average of £330,000.
Which train stations are available in or near Marston?
Some of the train stations available in or near Marston are Oxford, Oxford Parkway and Islip.
Property Price Paid in Marston by Year
The average sold property price by year was:
| Year | Average Sold Price | Price Change |
Sold Properties
|
|---|---|---|---|
| 2025 | £497,550 | -9% |
55 Properties |
| 2024 | £542,042 | -3% |
75 Properties |
| 2023 | £560,380 | 9% |
47 Properties |
| 2022 | £507,354 | 10% |
68 Properties |
| 2021 | £458,231 | 2% |
93 Properties |
| 2020 | £450,656 | 3% |
68 Properties |
| 2019 | £436,706 | 6% |
70 Properties |
| 2018 | £410,506 | -23% |
70 Properties |
| 2017 | £505,188 | 9% |
71 Properties |
| 2016 | £459,934 | 7% |
59 Properties |
| 2015 | £428,554 | 5% |
75 Properties |
| 2014 | £405,095 | 14% |
88 Properties |
| 2013 | £348,979 | 11% |
77 Properties |
| 2012 | £309,757 | -1% |
66 Properties |
| 2011 | £312,240 | 4% |
78 Properties |
| 2010 | £298,985 | 18% |
79 Properties |
| 2009 | £246,328 | -3% |
62 Properties |
| 2008 | £253,566 | -10% |
53 Properties |
| 2007 | £278,992 | -3% |
97 Properties |
| 2006 | £287,460 | 13% |
130 Properties |
| 2005 | £249,822 | -2% |
107 Properties |
| 2004 | £255,508 | 8% |
111 Properties |
| 2003 | £233,978 | 14% |
105 Properties |
| 2002 | £201,966 | 17% |
103 Properties |
| 2001 | £168,274 | 8% |
95 Properties |
| 2000 | £155,420 | 27% |
101 Properties |
| 1999 | £113,810 | 5% |
119 Properties |
| 1998 | £108,405 | 9% |
99 Properties |
| 1997 | £98,553 | 17% |
97 Properties |
| 1996 | £81,949 | -6% |
126 Properties |
| 1995 | £87,113 | - |
87 Properties |
Property Price per Property Type in Marston
Here you can find historic sold price data in order to help with your property search.
The average Property Paid Price for specific property types in the last three years are:
| Property Type | Average Sold Price | Sold Properties |
|---|---|---|
| Semi Detached House | £540,029.00 | 92 Semi Detached Houses |
| Detached House | £973,000.00 | 15 Detached Houses |
| Terraced House | £461,925.00 | 58 Terraced Houses |
| Flat | £273,916.00 | 12 Flats |