
Houses for sale & to rent in Canford Cliffs, Poole
House Prices in Canford Cliffs
Properties in Canford Cliffs have an average house price of £847k and had 681 Property Transactions within the last 3 years¹.
Canford Cliffs is an area in Poole, Poole with 4,397 households², where the most expensive property was sold for £13.5M.
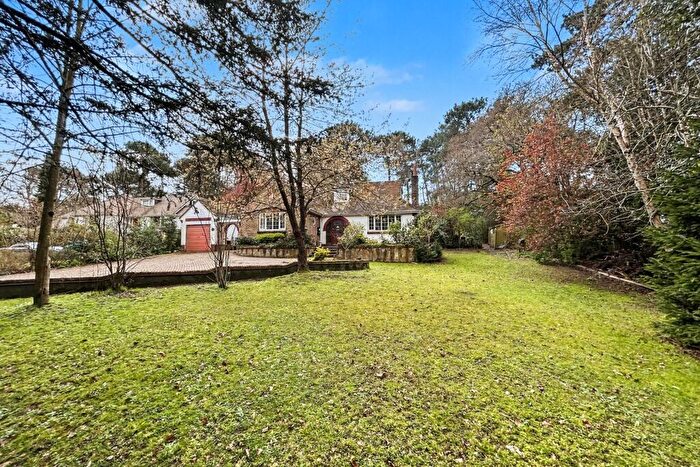
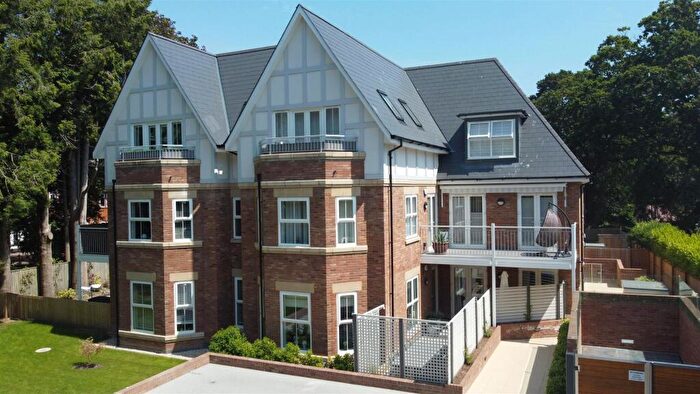
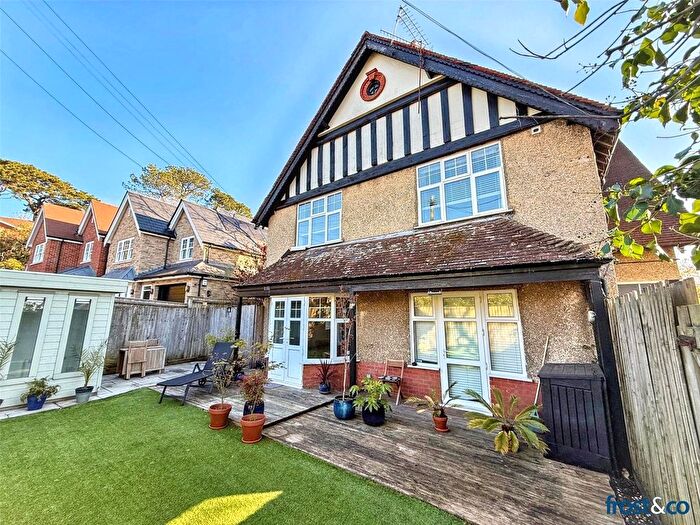
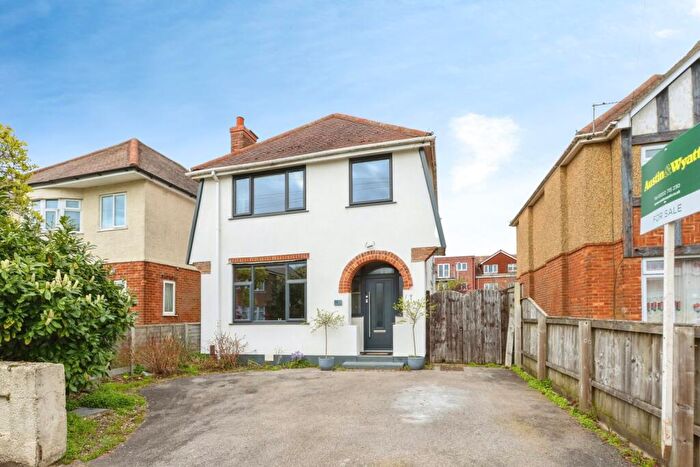
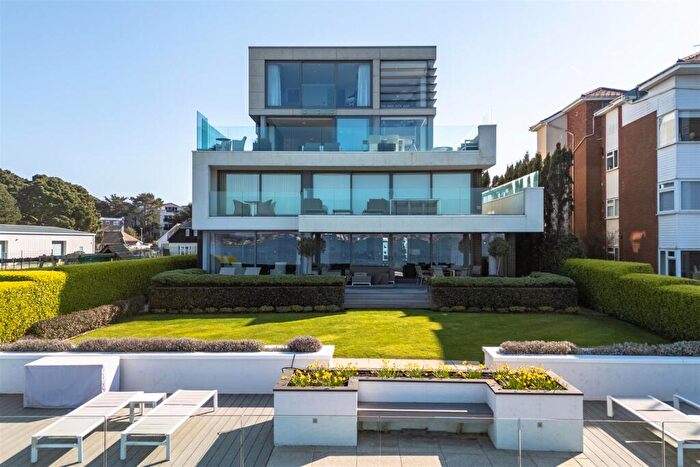
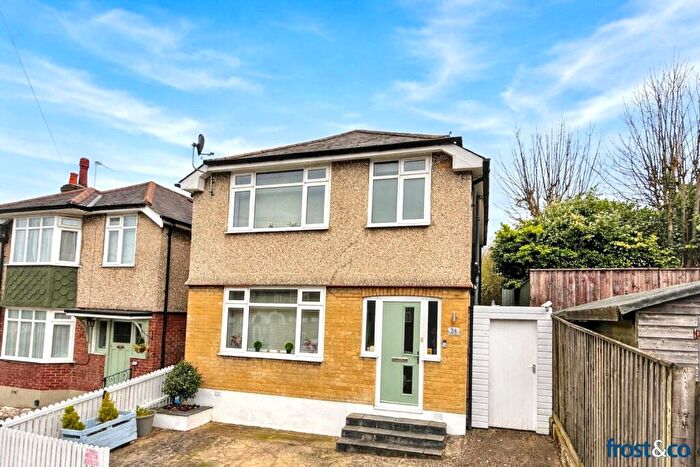
Properties for sale in Canford Cliffs
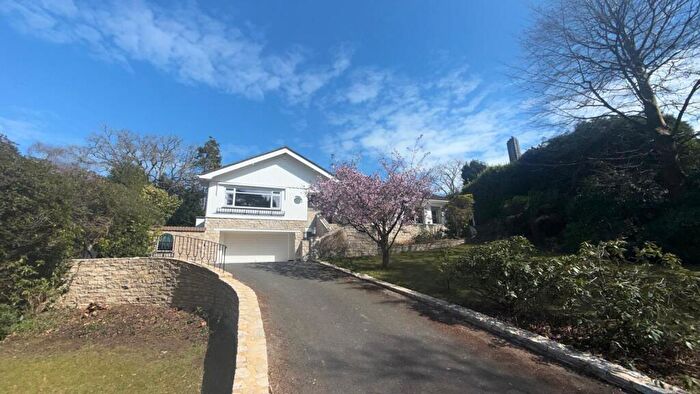
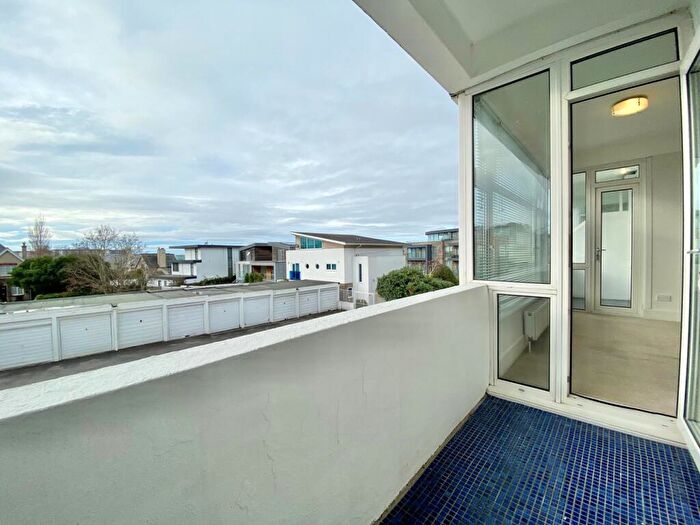
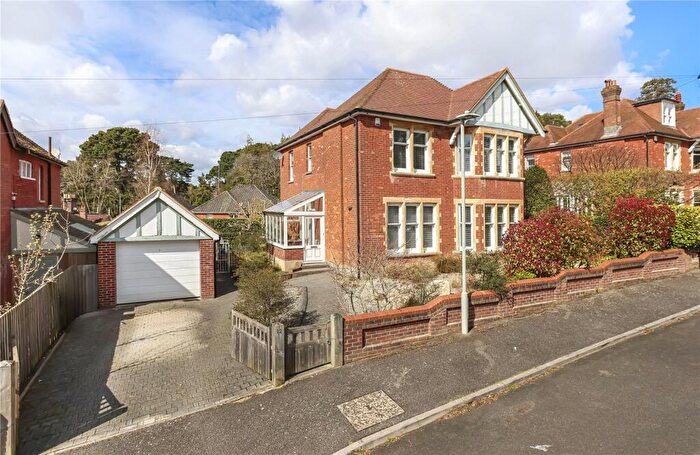
![]()
If you are looking to sell your house, let it out, or receive a property valuation, an expert can help you.
Click the button below to get started.
Roads and Postcodes in Canford Cliffs
Navigate through our locations to find the location of your next house in Canford Cliffs, Poole for sale or to rent.
Transport near Canford Cliffs

- FAQ
- Price Paid By Year
- Property Type Price
Frequently asked questions about Canford Cliffs
What is the average price for a property for sale in Canford Cliffs?
The average price for a property for sale in Canford Cliffs is £846,517. This amount is 98% higher than the average price in Poole. There are more than 10,000 property listings for sale in Canford Cliffs.
What streets have the most expensive properties for sale in Canford Cliffs?
The streets with the most expensive properties for sale in Canford Cliffs are Chesterfield Close at an average of £4,875,000, Mornish Road at an average of £3,811,500 and Panorama Road at an average of £3,590,576.
What streets have the most affordable properties for sale in Canford Cliffs?
The streets with the most affordable properties for sale in Canford Cliffs are Langley Road at an average of £141,666, Poole Road at an average of £157,500 and St Aldhelms Road at an average of £230,000.
Which train stations are available in or near Canford Cliffs?
Some of the train stations available in or near Canford Cliffs are Branksome, Parkstone and Bournemouth.
Property Price Paid in Canford Cliffs by Year
The average sold property price by year was:
| Year | Average Sold Price | Price Change |
Sold Properties
|
|---|---|---|---|
| 2025 | £762,246 | -6% |
168 Properties |
| 2024 | £806,839 | -20% |
302 Properties |
| 2023 | £970,406 | 2% |
211 Properties |
| 2022 | £951,162 | 5% |
339 Properties |
| 2021 | £903,698 | 5% |
519 Properties |
| 2020 | £857,830 | 19% |
347 Properties |
| 2019 | £696,488 | -6% |
353 Properties |
| 2018 | £739,293 | 13% |
318 Properties |
| 2017 | £639,531 | -8% |
397 Properties |
| 2016 | £687,988 | 6% |
363 Properties |
| 2015 | £645,614 | 8% |
344 Properties |
| 2014 | £596,850 | 10% |
396 Properties |
| 2013 | £537,185 | -4% |
318 Properties |
| 2012 | £556,829 | 5% |
241 Properties |
| 2011 | £528,521 | 3% |
291 Properties |
| 2010 | £510,581 | -6% |
260 Properties |
| 2009 | £538,945 | -11% |
279 Properties |
| 2008 | £597,080 | -1% |
216 Properties |
| 2007 | £602,944 | 18% |
436 Properties |
| 2006 | £497,314 | 2% |
423 Properties |
| 2005 | £488,203 | 18% |
322 Properties |
| 2004 | £402,375 | -5% |
391 Properties |
| 2003 | £421,389 | 16% |
362 Properties |
| 2002 | £354,530 | 9% |
494 Properties |
| 2001 | £321,665 | 3% |
366 Properties |
| 2000 | £312,478 | 17% |
384 Properties |
| 1999 | £257,948 | 17% |
497 Properties |
| 1998 | £214,689 | 14% |
391 Properties |
| 1997 | £184,945 | 17% |
460 Properties |
| 1996 | £153,681 | 5% |
375 Properties |
| 1995 | £145,910 | - |
291 Properties |
Property Price per Property Type in Canford Cliffs
Here you can find historic sold price data in order to help with your property search.
The average Property Paid Price for specific property types in the last three years are:
| Property Type | Average Sold Price | Sold Properties |
|---|---|---|
| Flat | £483,810.00 | 507 Flats |
| Semi Detached House | £891,282.00 | 13 Semi Detached Houses |
| Detached House | £2,165,294.00 | 142 Detached Houses |
| Terraced House | £638,315.00 | 19 Terraced Houses |