
Houses for sale & to rent in Penn Hill, Poole
House Prices in Penn Hill
Properties in Penn Hill have an average house price of £677k and had 562 Property Transactions within the last 3 years¹.
Penn Hill is an area in Poole, Poole with 4,920 households², where the most expensive property was sold for £5.2M.
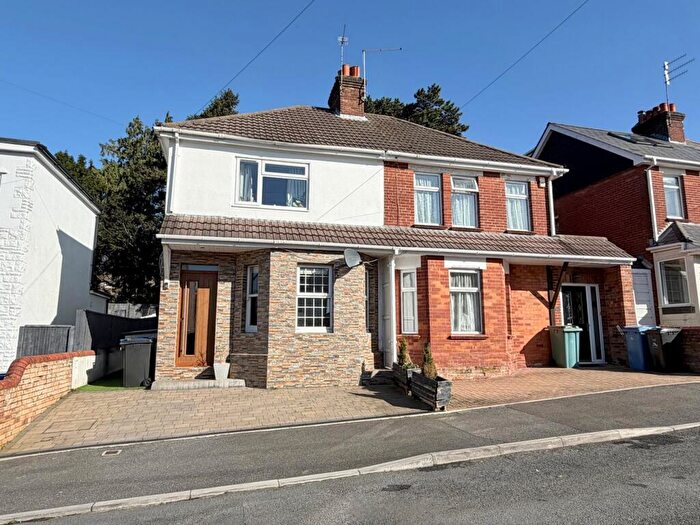
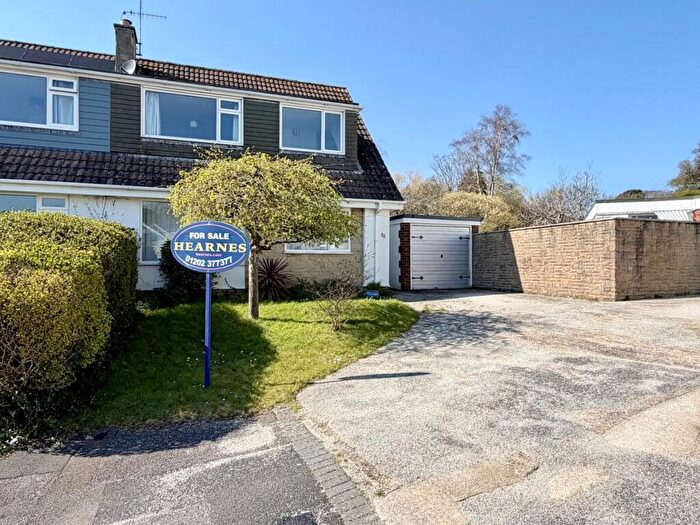
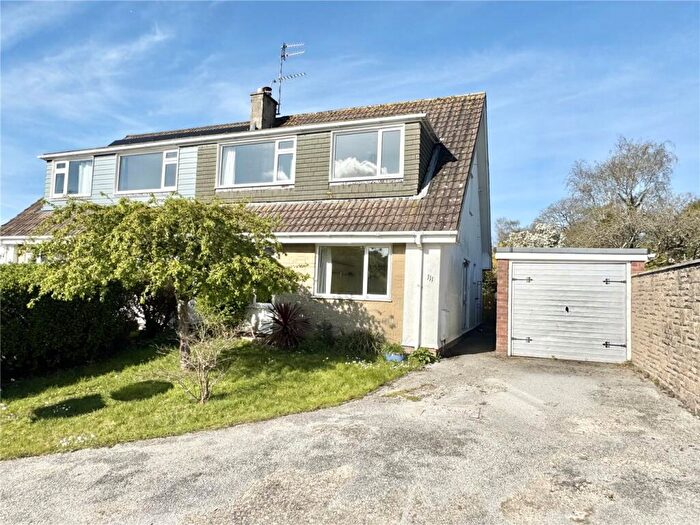
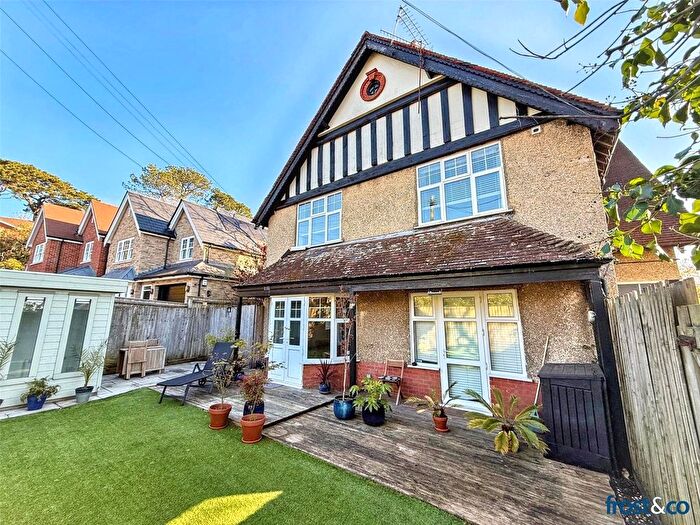
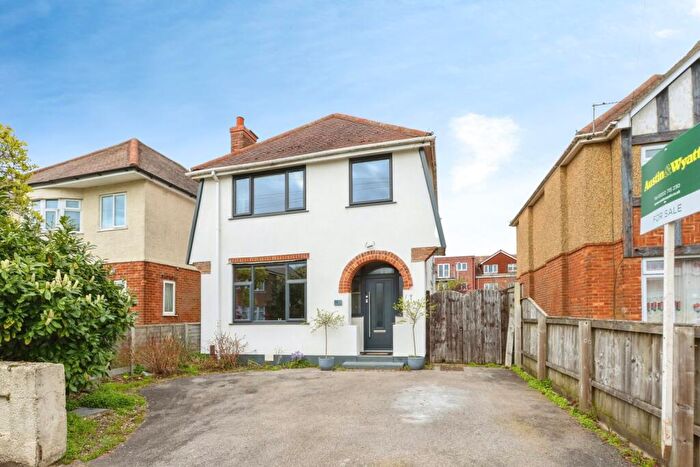
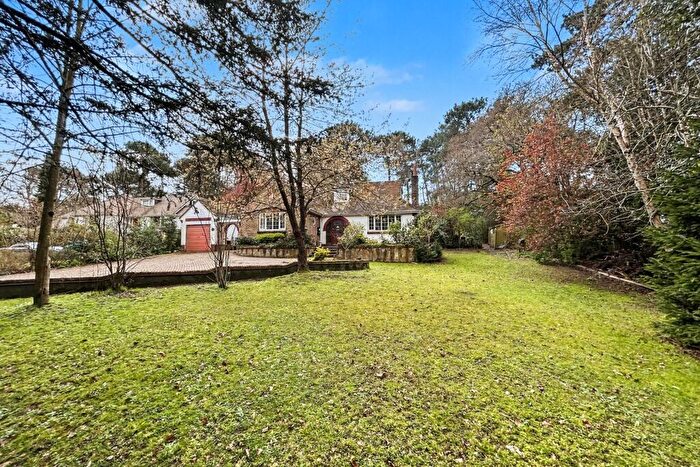
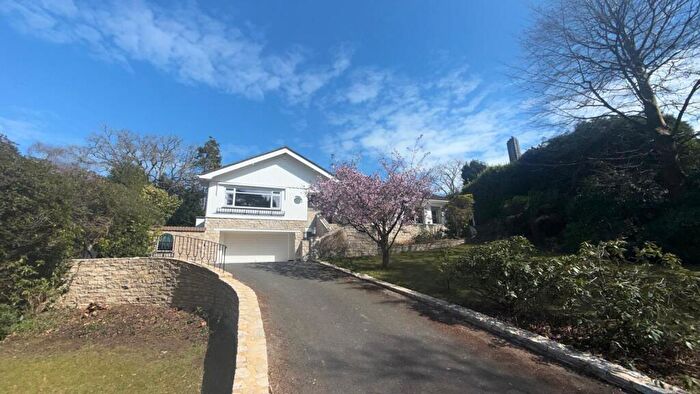
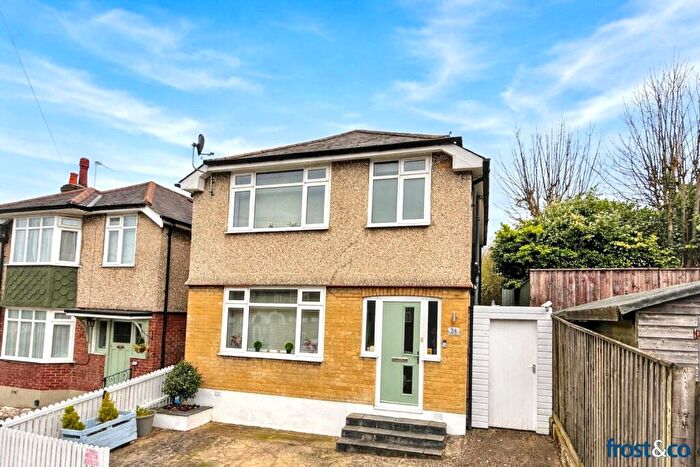
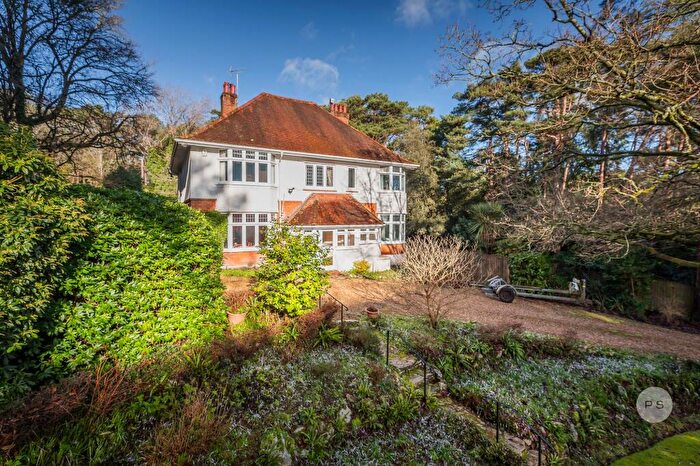
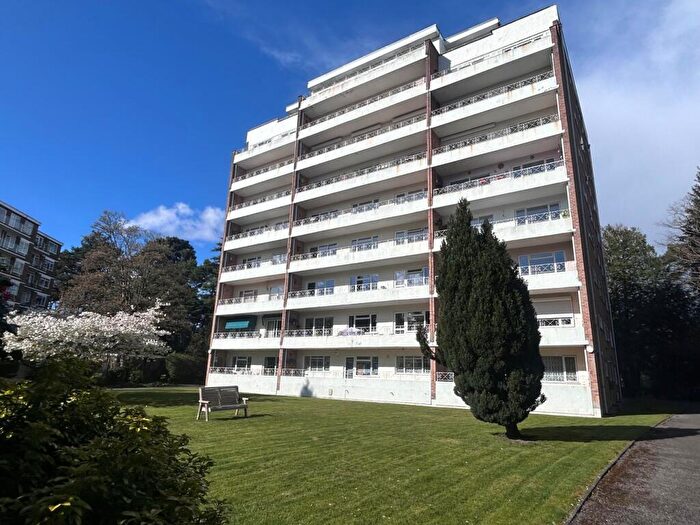
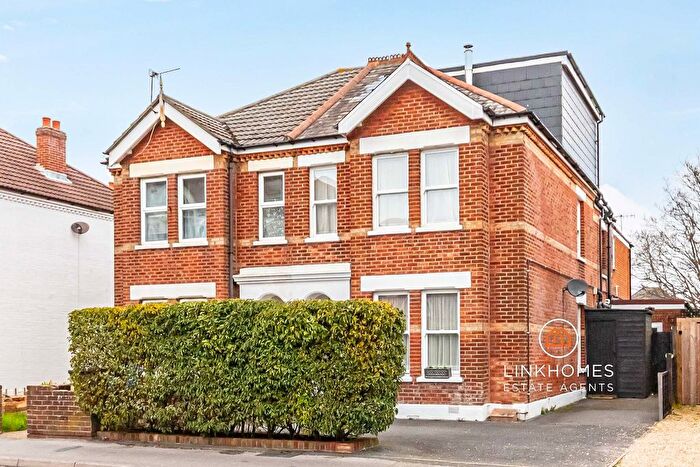
Properties for sale in Penn Hill
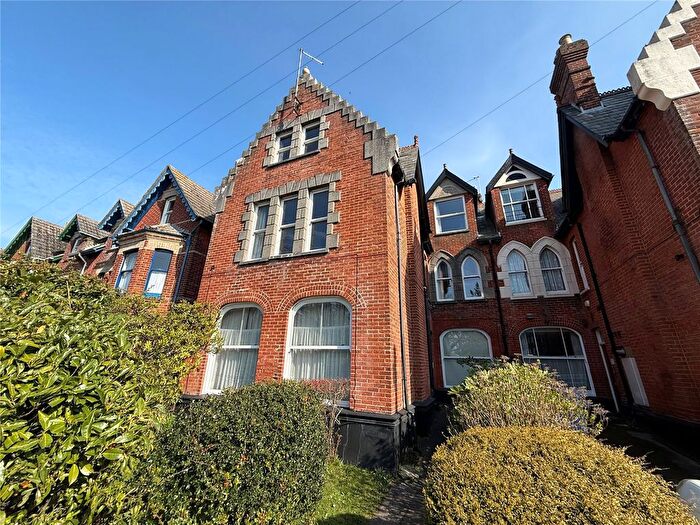
![]()
If you are looking to sell your house, let it out, or receive a property valuation, an expert can help you.
Click the button below to get started.

Roads and Postcodes in Penn Hill
Navigate through our locations to find the location of your next house in Penn Hill, Poole for sale or to rent.
Transport near Penn Hill

- FAQ
- Price Paid By Year
- Property Type Price
Frequently asked questions about Penn Hill
What is the average price for a property for sale in Penn Hill?
The average price for a property for sale in Penn Hill is £677,176. This amount is 58% higher than the average price in Poole. There are 8,348 property listings for sale in Penn Hill.
What streets have the most expensive properties for sale in Penn Hill?
The streets with the most expensive properties for sale in Penn Hill are Alington Road at an average of £2,952,857, Partridge Walk at an average of £1,972,500 and Minterne Road at an average of £1,820,000.
What streets have the most affordable properties for sale in Penn Hill?
The streets with the most affordable properties for sale in Penn Hill are Randolph Road at an average of £194,000, Ashley Road at an average of £276,000 and Bournemouth Road at an average of £278,061.
Which train stations are available in or near Penn Hill?
Some of the train stations available in or near Penn Hill are Parkstone, Branksome and Poole.
Property Price Paid in Penn Hill by Year
The average sold property price by year was:
| Year | Average Sold Price | Price Change |
Sold Properties
|
|---|---|---|---|
| 2026 | £534,000 | -9% |
10 Properties |
| 2025 | £584,450 | -24% |
164 Properties |
| 2024 | £723,704 | 1% |
186 Properties |
| 2023 | £716,703 | -2% |
202 Properties |
| 2022 | £732,442 | 10% |
300 Properties |
| 2021 | £660,590 | 14% |
402 Properties |
| 2020 | £567,761 | 5% |
279 Properties |
| 2019 | £537,612 | 7% |
247 Properties |
| 2018 | £498,050 | -11% |
322 Properties |
| 2017 | £553,801 | 6% |
289 Properties |
| 2016 | £522,006 | -0,3% |
298 Properties |
| 2015 | £523,549 | 9% |
362 Properties |
| 2014 | £474,001 | 10% |
336 Properties |
| 2013 | £427,602 | -3% |
241 Properties |
| 2012 | £441,598 | -1% |
187 Properties |
| 2011 | £444,458 | 11% |
199 Properties |
| 2010 | £394,527 | -9% |
193 Properties |
| 2009 | £429,346 | -20% |
209 Properties |
| 2008 | £513,475 | 21% |
163 Properties |
| 2007 | £405,795 | 4% |
401 Properties |
| 2006 | £389,341 | 10% |
422 Properties |
| 2005 | £350,909 | 5% |
328 Properties |
| 2004 | £332,226 | 7% |
349 Properties |
| 2003 | £310,222 | 18% |
347 Properties |
| 2002 | £254,637 | 15% |
378 Properties |
| 2001 | £215,262 | 7% |
434 Properties |
| 2000 | £199,333 | 25% |
340 Properties |
| 1999 | £148,668 | 14% |
374 Properties |
| 1998 | £127,910 | 3% |
287 Properties |
| 1997 | £124,160 | 16% |
344 Properties |
| 1996 | £103,830 | 4% |
312 Properties |
| 1995 | £99,534 | - |
267 Properties |
Property Price per Property Type in Penn Hill
Here you can find historic sold price data in order to help with your property search.
The average Property Paid Price for specific property types in the last three years are:
| Property Type | Average Sold Price | Sold Properties |
|---|---|---|
| Flat | £423,982.00 | 194 Flats |
| Semi Detached House | £506,571.00 | 70 Semi Detached Houses |
| Detached House | £960,575.00 | 258 Detached Houses |
| Terraced House | £375,795.00 | 40 Terraced Houses |