
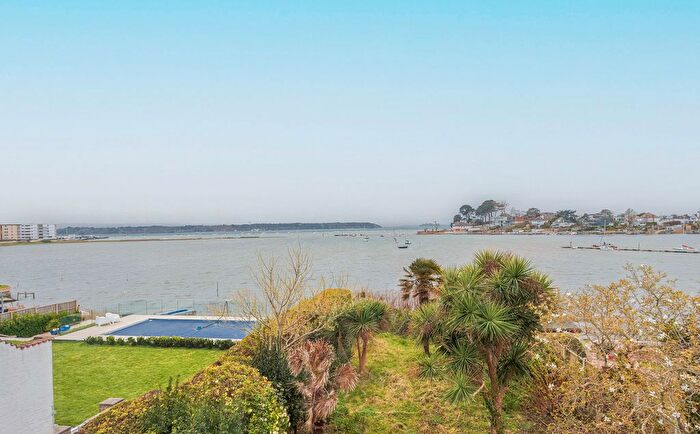
Houses for sale & to rent in Parkstone, Poole
House Prices in Parkstone
Properties in Parkstone have an average house price of £462k and had 689 Property Transactions within the last 3 years¹.
Parkstone is an area in Poole, Poole with 5,147 households², where the most expensive property was sold for £4M.
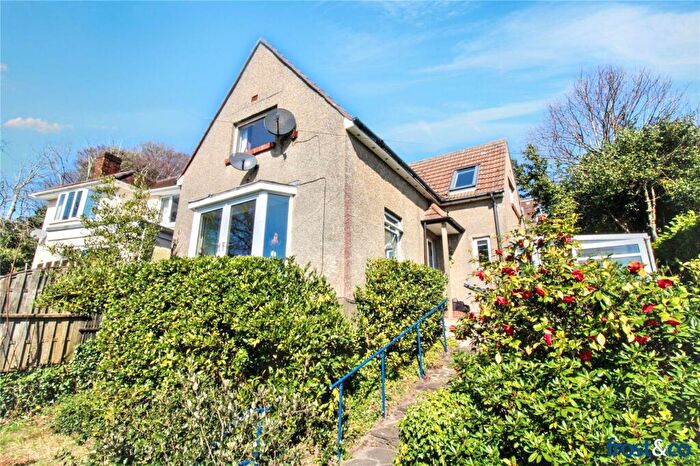
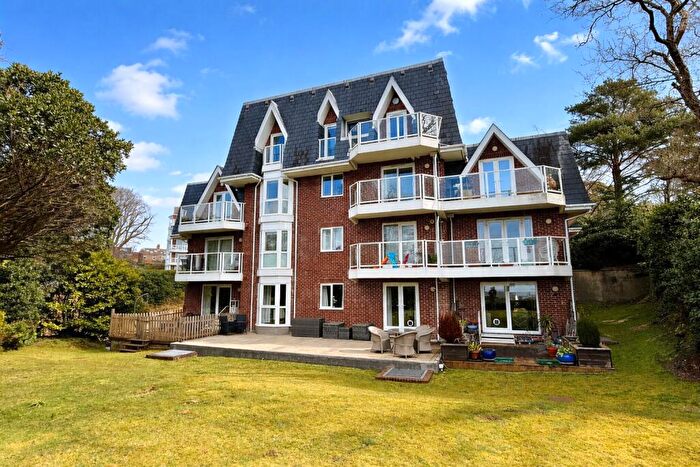
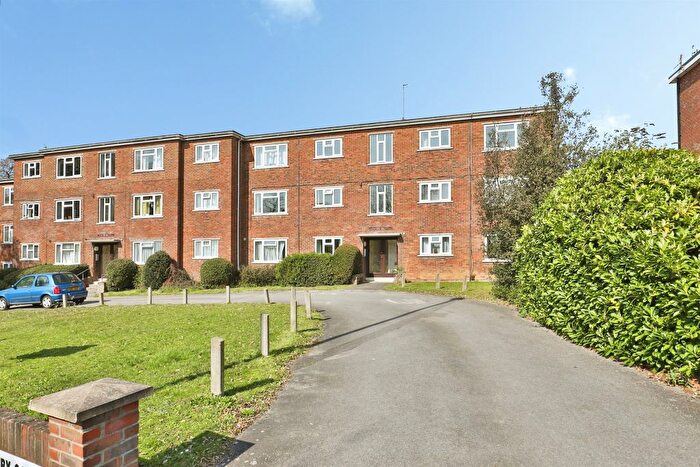
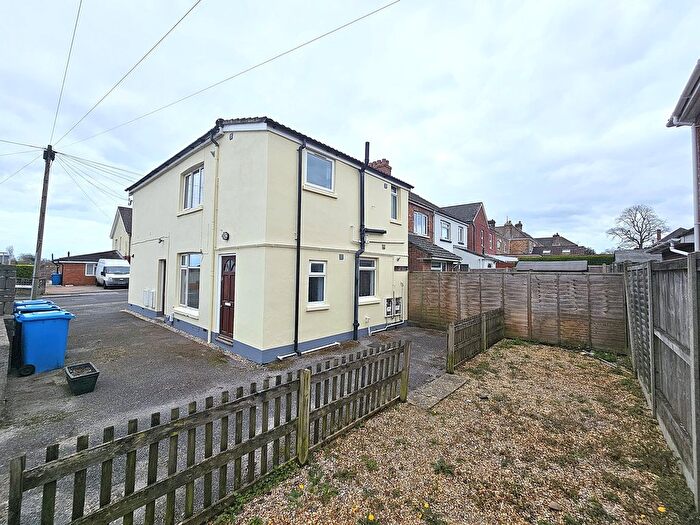
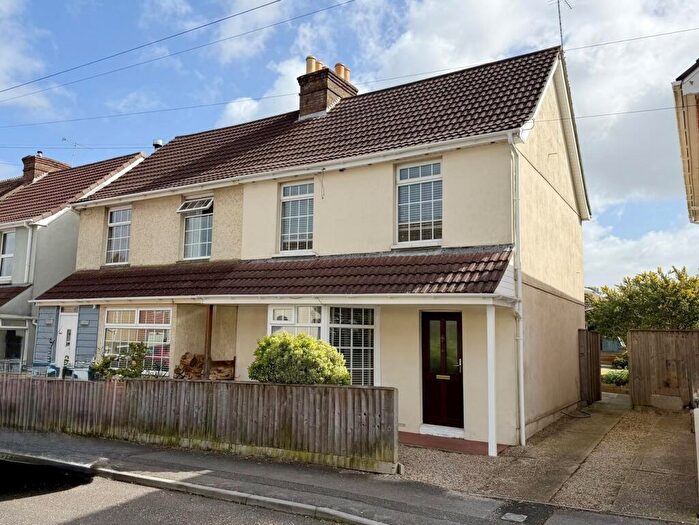
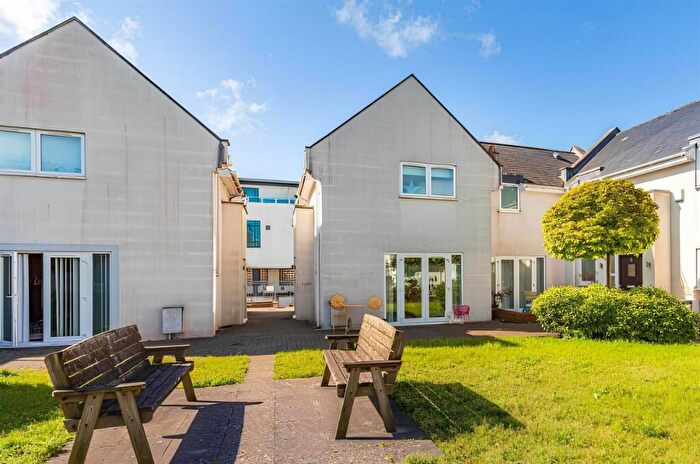
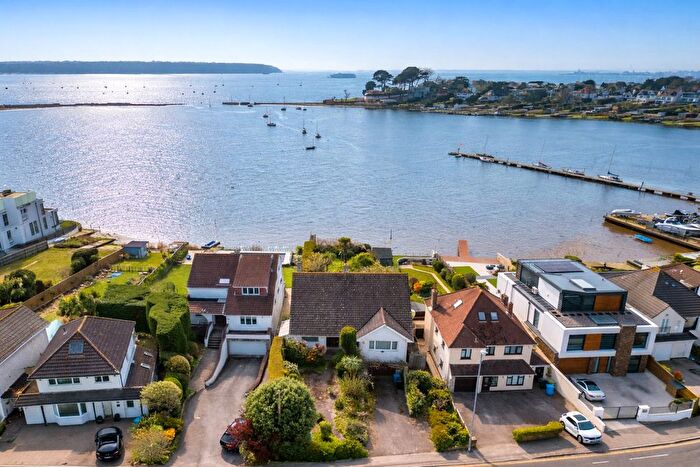
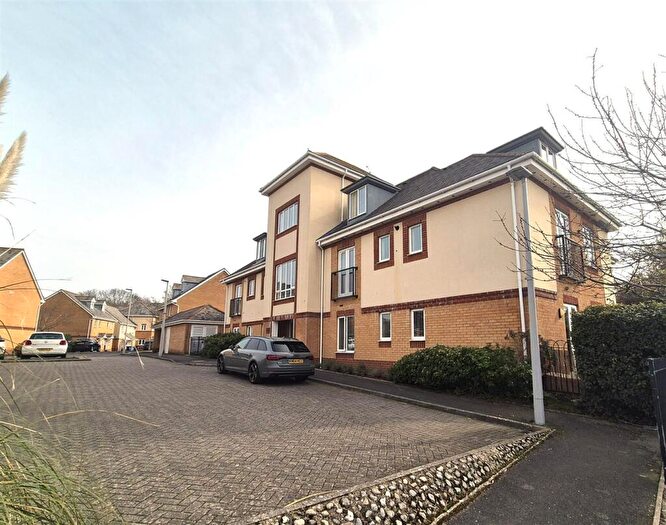
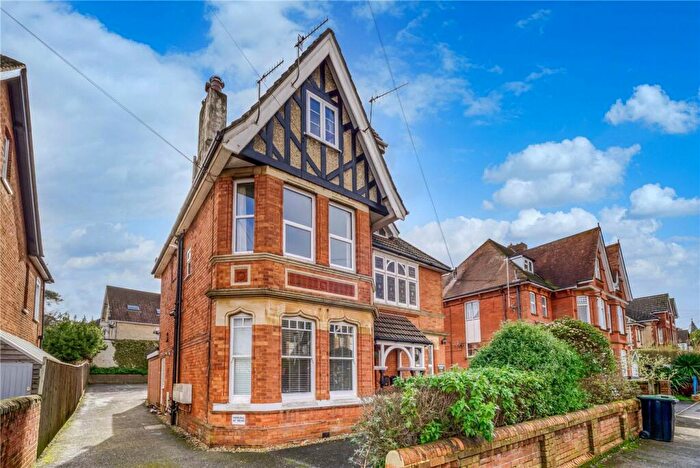
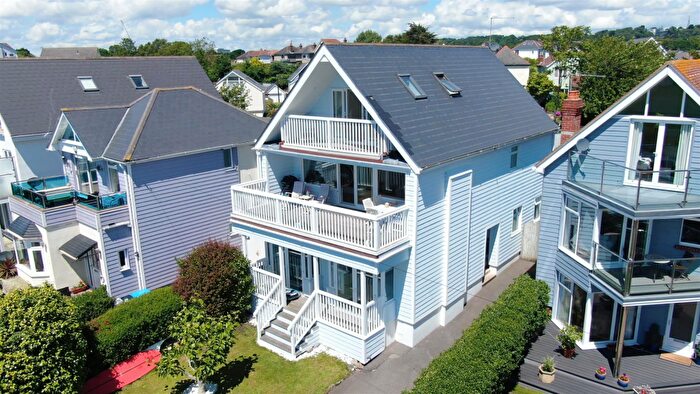
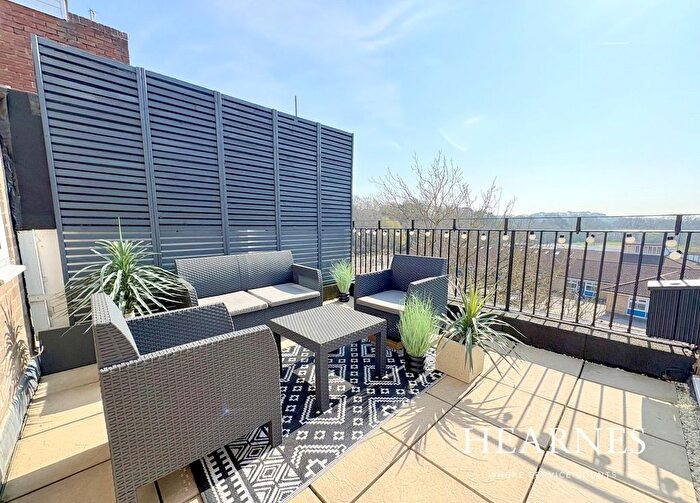
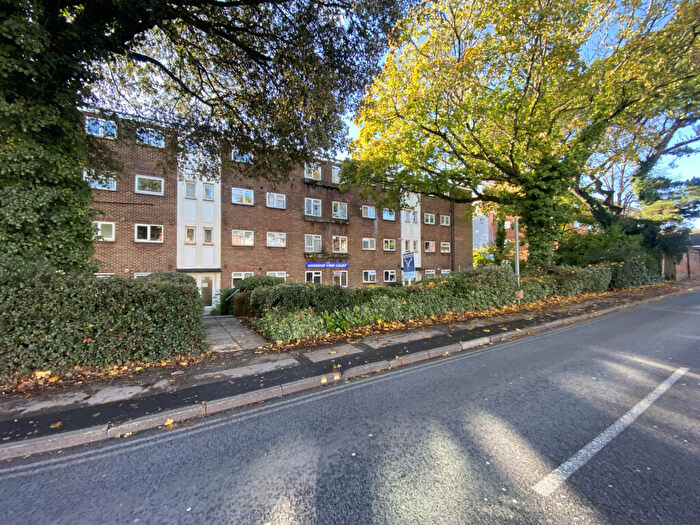
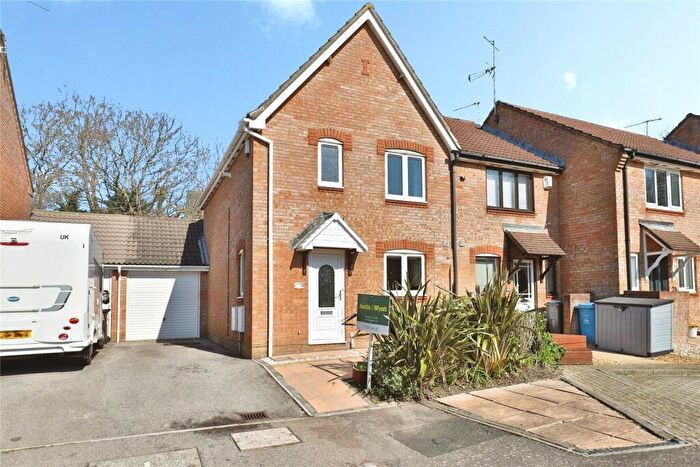
Properties for sale in Parkstone
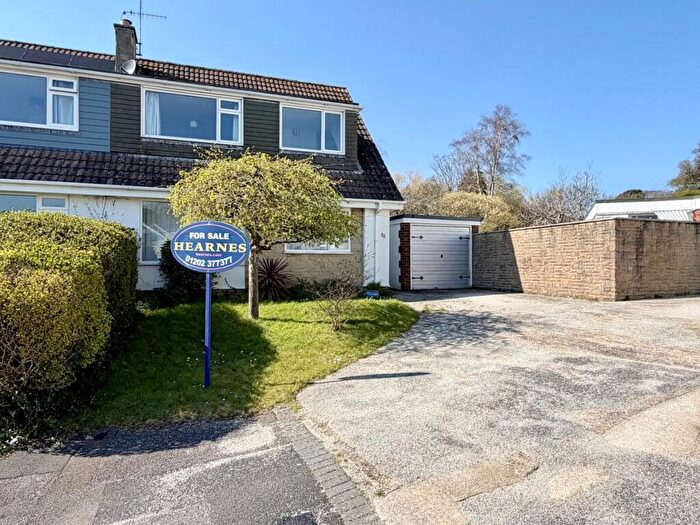
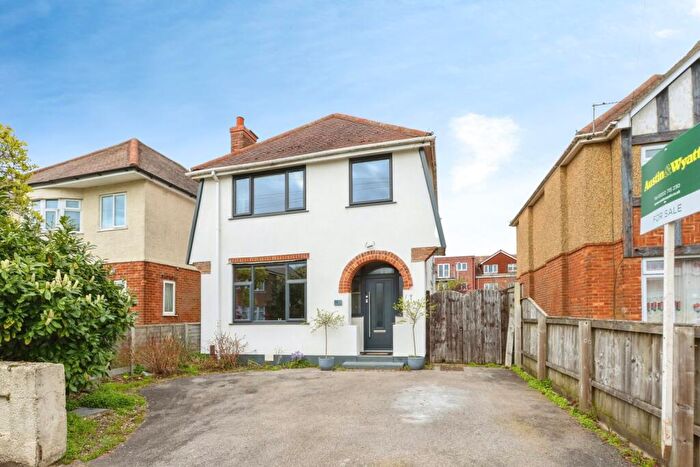
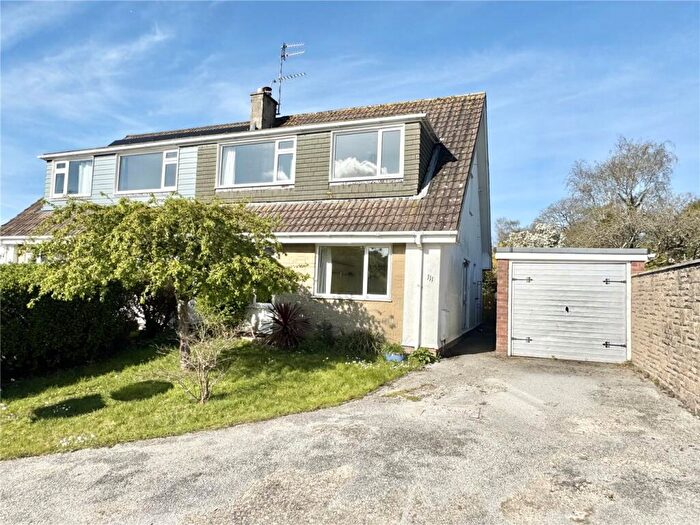
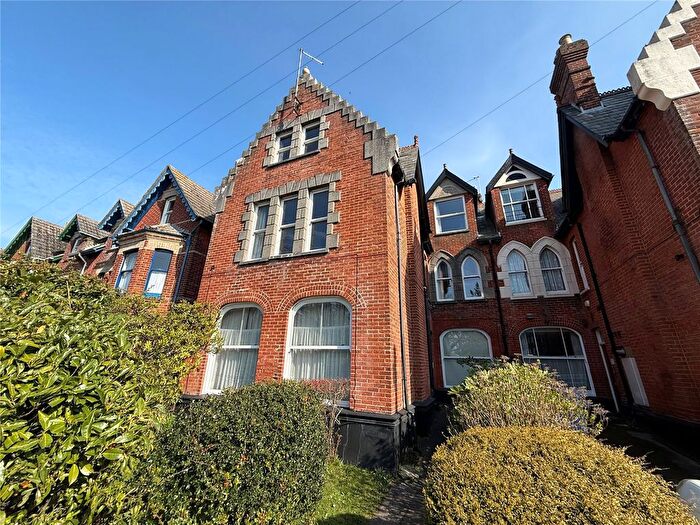
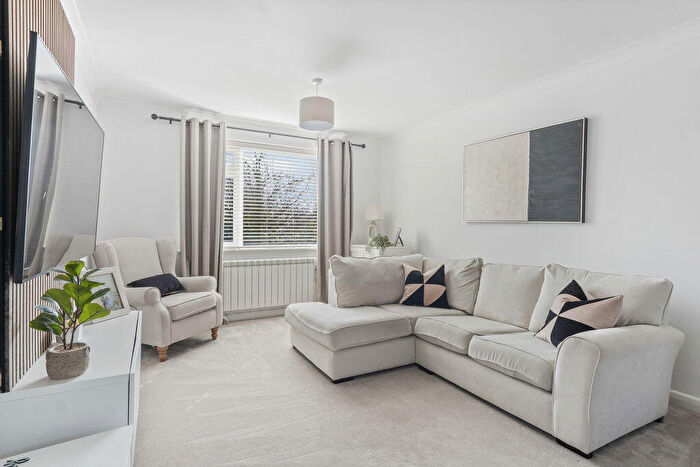
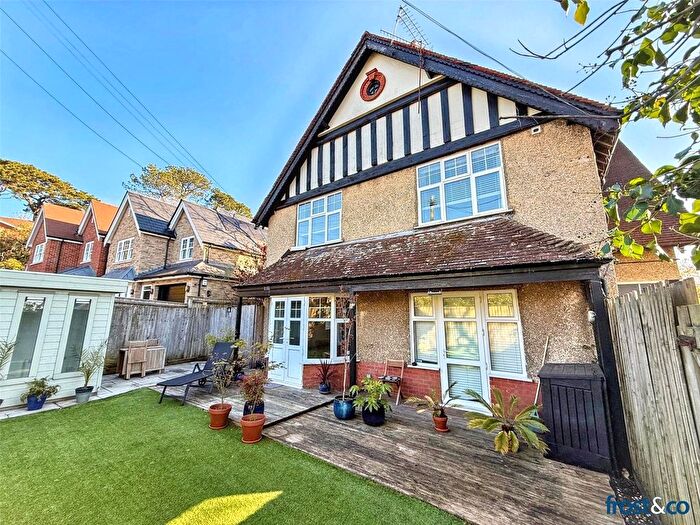
![]()
If you are looking to sell your house, let it out, or receive a property valuation, an expert can help you.
Click the button below to get started.
Roads and Postcodes in Parkstone
Navigate through our locations to find the location of your next house in Parkstone, Poole for sale or to rent.
Transport near Parkstone

- FAQ
- Price Paid By Year
- Property Type Price
Frequently asked questions about Parkstone
What is the average price for a property for sale in Parkstone?
The average price for a property for sale in Parkstone is £462,457. This amount is 8% higher than the average price in Poole. There are 2,915 property listings for sale in Parkstone.
What streets have the most expensive properties for sale in Parkstone?
The streets with the most expensive properties for sale in Parkstone are Elms Avenue at an average of £2,261,250, Whitecliff Road at an average of £1,636,466 and Lagoon Road at an average of £1,628,166.
What streets have the most affordable properties for sale in Parkstone?
The streets with the most affordable properties for sale in Parkstone are Station Road at an average of £106,100, Parkstone Road at an average of £148,166 and Park Road at an average of £151,541.
Which train stations are available in or near Parkstone?
Some of the train stations available in or near Parkstone are Parkstone, Poole and Branksome.
Property Price Paid in Parkstone by Year
The average sold property price by year was:
| Year | Average Sold Price | Price Change |
Sold Properties
|
|---|---|---|---|
| 2025 | £516,424 | 15% |
191 Properties |
| 2024 | £437,194 | -2% |
239 Properties |
| 2023 | £445,970 | -8% |
259 Properties |
| 2022 | £480,635 | 2% |
330 Properties |
| 2021 | £470,430 | 8% |
417 Properties |
| 2020 | £434,160 | 7% |
278 Properties |
| 2019 | £404,743 | -1% |
293 Properties |
| 2018 | £410,023 | 3% |
269 Properties |
| 2017 | £396,776 | 12% |
328 Properties |
| 2016 | £347,768 | 0,5% |
343 Properties |
| 2015 | £346,203 | -2% |
341 Properties |
| 2014 | £351,500 | - |
304 Properties |
| 2013 | £351,353 | 13% |
264 Properties |
| 2012 | £306,333 | 4% |
215 Properties |
| 2011 | £293,040 | -10% |
200 Properties |
| 2010 | £323,217 | 9% |
242 Properties |
| 2009 | £294,248 | - |
227 Properties |
| 2008 | £294,286 | -8% |
204 Properties |
| 2007 | £317,617 | -1% |
399 Properties |
| 2006 | £321,403 | 17% |
439 Properties |
| 2005 | £267,985 | -0,5% |
358 Properties |
| 2004 | £269,232 | 15% |
344 Properties |
| 2003 | £227,638 | 15% |
344 Properties |
| 2002 | £193,037 | 18% |
342 Properties |
| 2001 | £157,850 | -2% |
392 Properties |
| 2000 | £160,355 | 25% |
304 Properties |
| 1999 | £120,171 | 11% |
396 Properties |
| 1998 | £107,067 | 18% |
287 Properties |
| 1997 | £87,477 | 6% |
319 Properties |
| 1996 | £82,136 | 10% |
311 Properties |
| 1995 | £73,659 | - |
265 Properties |
Property Price per Property Type in Parkstone
Here you can find historic sold price data in order to help with your property search.
The average Property Paid Price for specific property types in the last three years are:
| Property Type | Average Sold Price | Sold Properties |
|---|---|---|
| Flat | £266,408.00 | 332 Flats |
| Semi Detached House | £486,584.00 | 82 Semi Detached Houses |
| Detached House | £795,283.00 | 192 Detached Houses |
| Terraced House | £452,903.00 | 83 Terraced Houses |