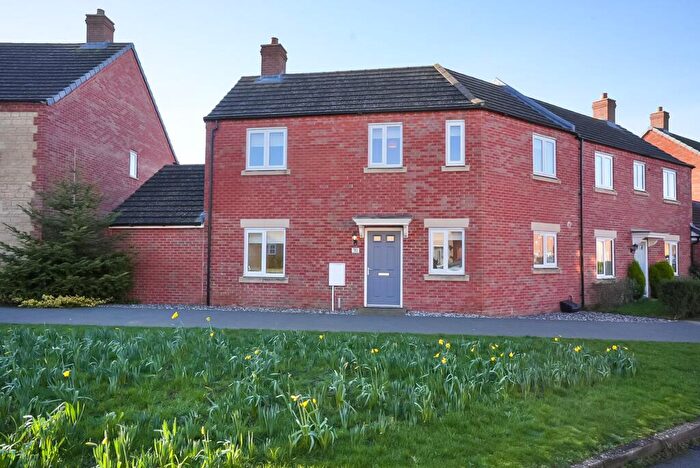
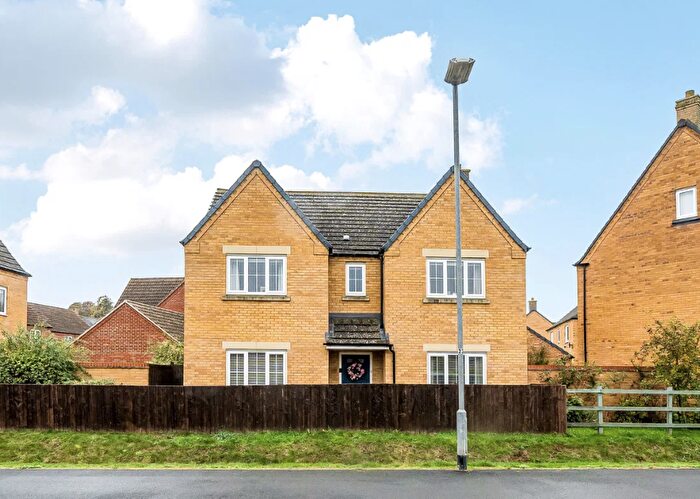
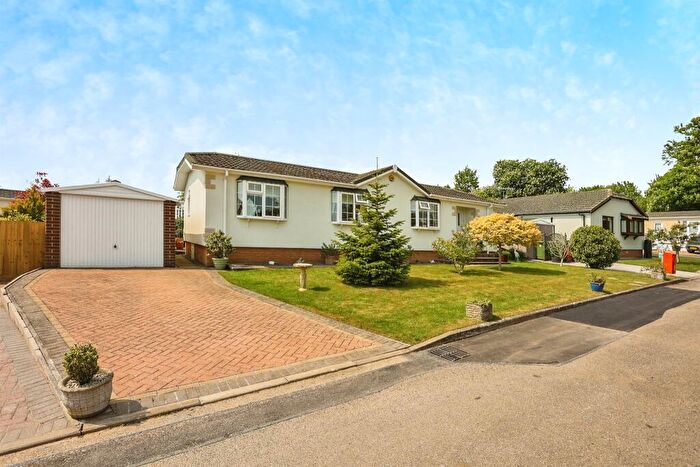
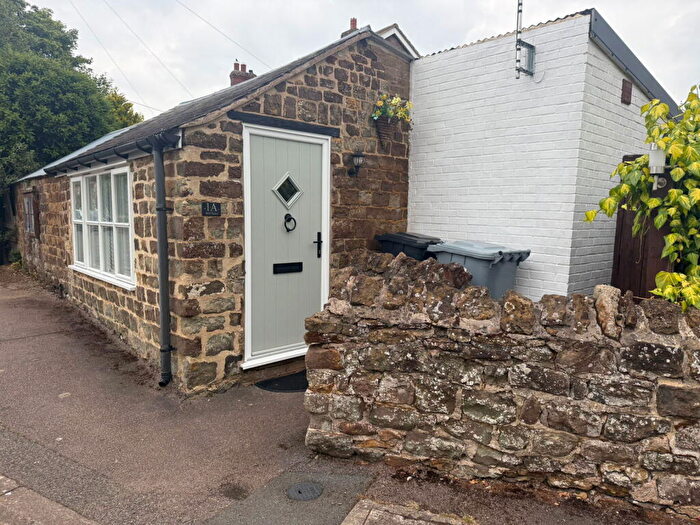
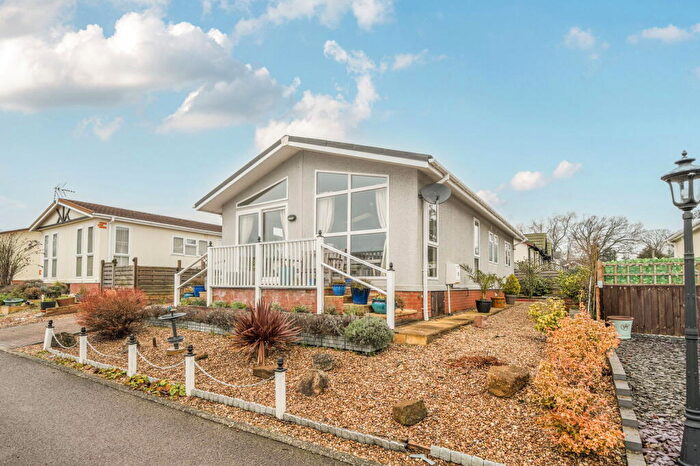
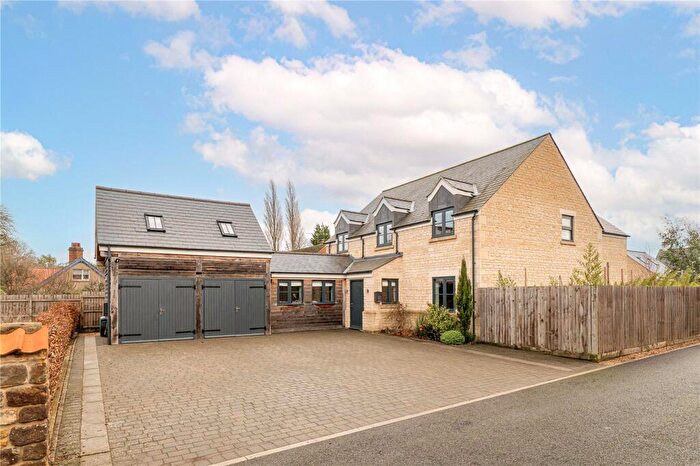
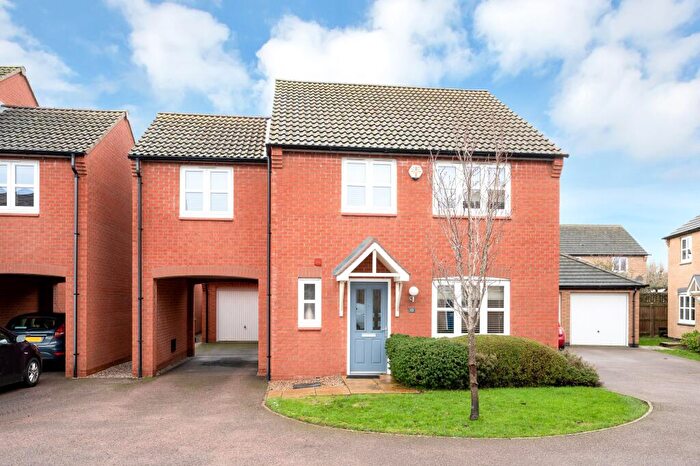
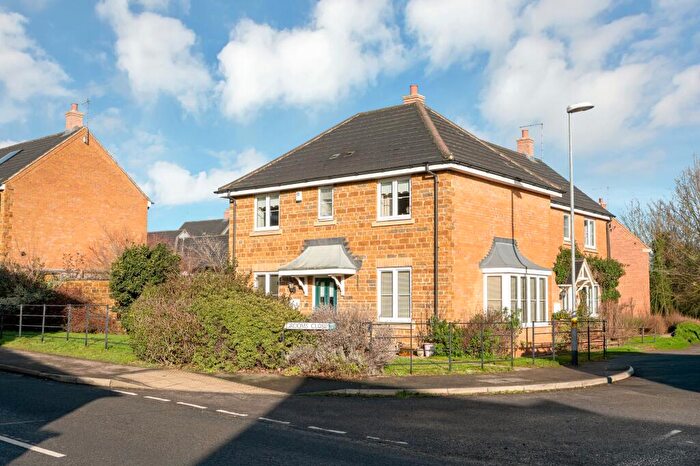
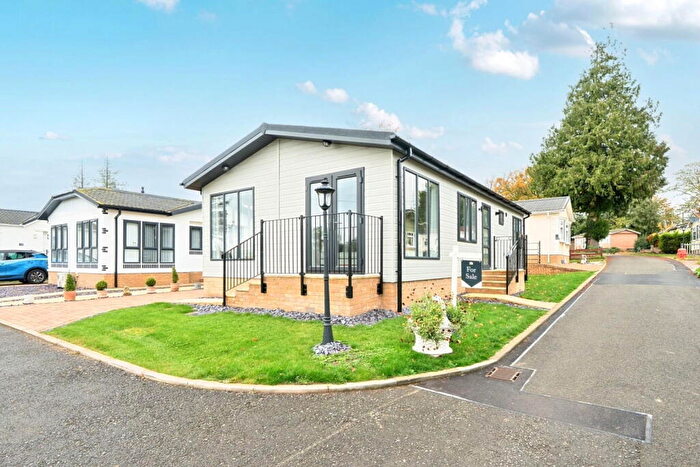
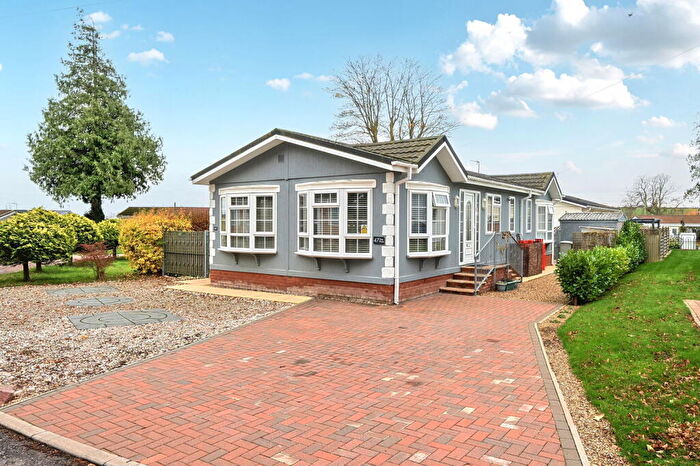
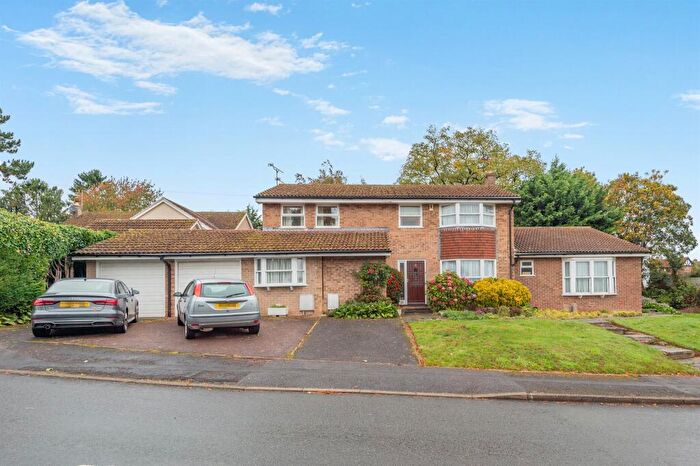
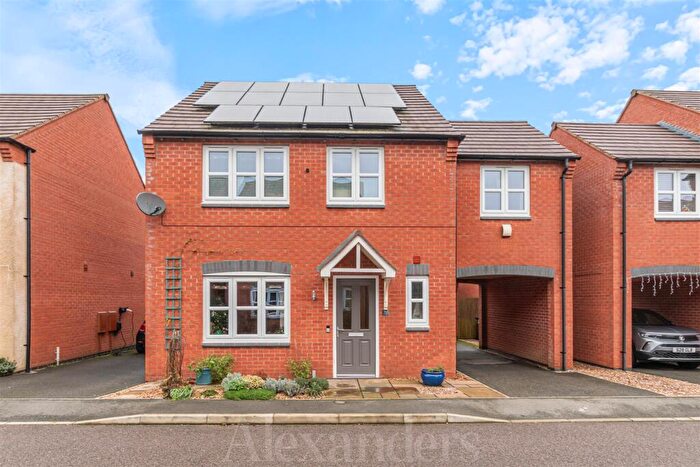
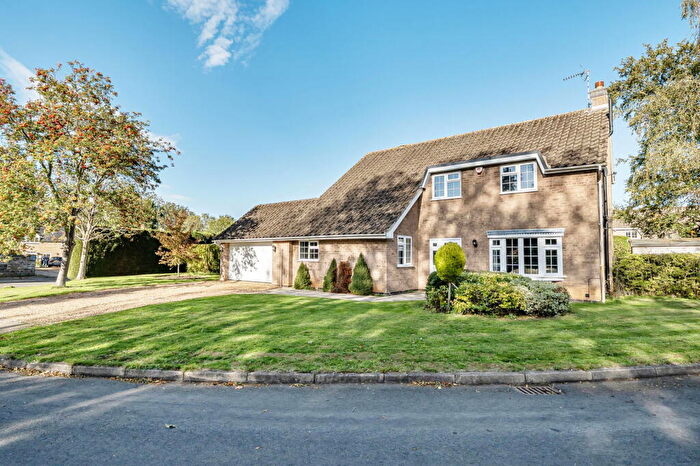
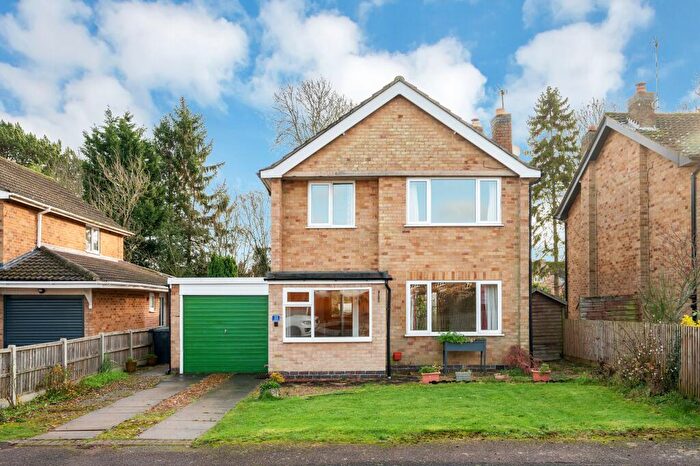
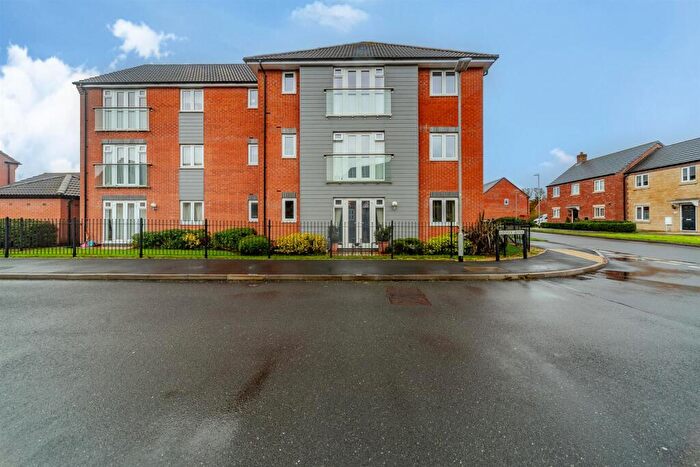
Houses for sale & to rent in Langham, Oakham
House Prices in Langham
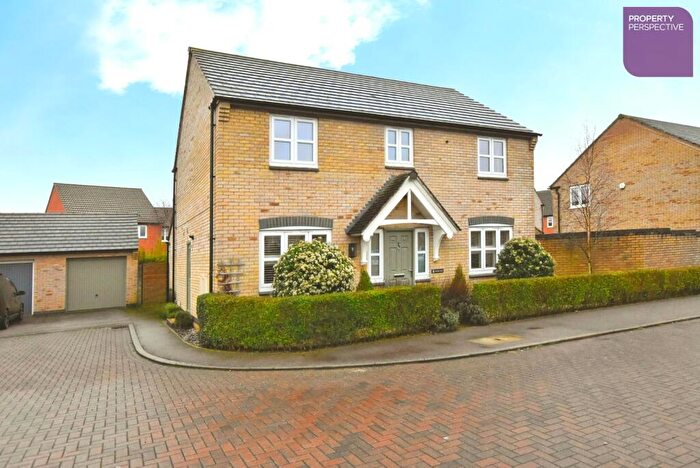
Properties in Langham have an average house price of £435,237.00 and had 44 Property Transactions within the last 3 years¹.
Langham is an area in Oakham, Rutland with 605 households², where the most expensive property was sold for £1,225,000.00.
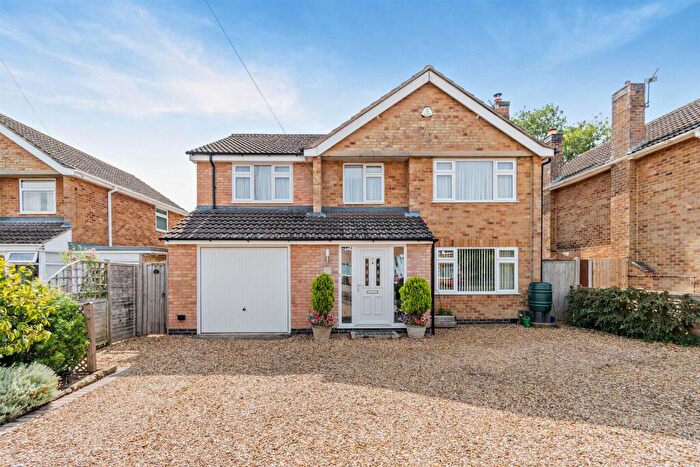
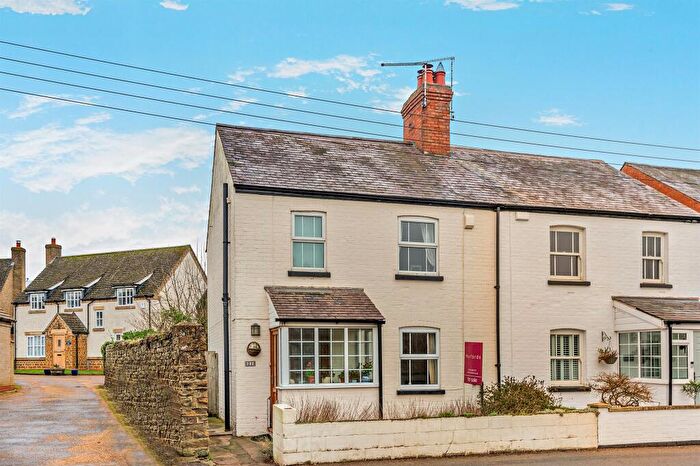
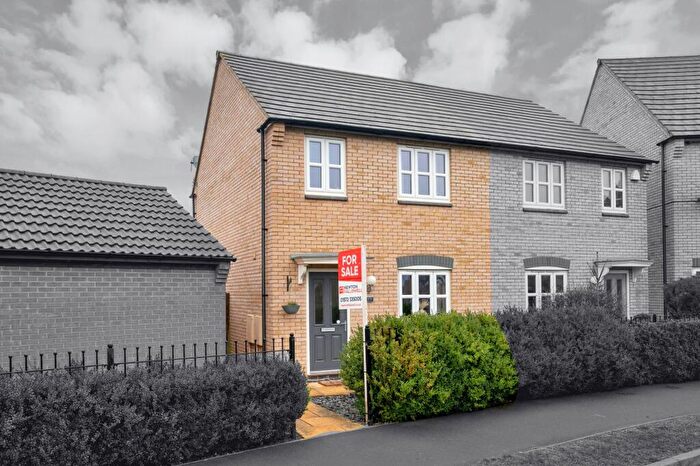
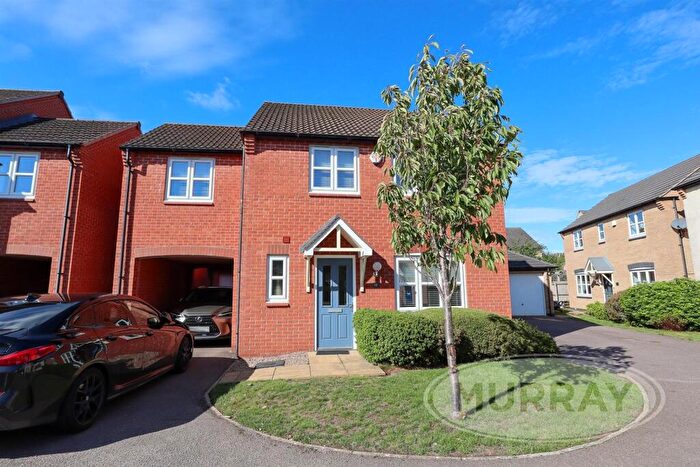
Properties for sale in Langham
Roads and Postcodes in Langham
Navigate through our locations to find the location of your next house in Langham, Oakham for sale or to rent.
| Streets | Postcodes |
|---|---|
| Ashwell Road | LE15 7HT LE15 7QJ |
| Bridge Street | LE15 7HU |
| Briggins Walk | LE15 7HX |
| Brocklehurst Park | LE15 7UT |
| Burley Road | LE15 7HY LE15 7HZ LE15 7JB |
| Church Street | LE15 7JE |
| Cold Overton Road | LE15 7JG |
| Fairfield Close | LE15 7JQ |
| Grange Close | LE15 7JX |
| Hainsworth Close | LE15 7HS |
| Harewood Close | LE15 7JZ |
| Hayes Close | LE15 7LD |
| Jubilee Drive | LE15 7JH |
| Kennel Cottages | LE15 7QW |
| Kimball Close | LE15 7QP |
| Langham Place | LE15 7QN |
| Lodge Park | LE15 7GZ |
| Lonsborough Gardens | LE15 7SA |
| Lowther Close | LE15 7JJ |
| Manor Lane | LE15 7JL |
| Melton Road | LE15 7JN |
| Mickley Lane | LE15 7LA |
| Oakham Road | LE15 7JW |
| Orchard Road | LE15 7JP |
| Ranksborough Drive | LE15 7JR |
| Ranksborough Hall Park | LE15 7EL |
| Ruddle Way | LE15 7NZ |
| Sharrads Way | LE15 7JY |
| Squires Close | LE15 7JU |
| The Glade | LE15 7GN |
| The Range | LE15 7EB |
| The Rookery | LE15 7JF |
| Well Street | LE15 7JS |
| Westons Lane | LE15 7JT |
| LE15 7EH LE15 7EJ |
Transport near Langham
- FAQ
- Price Paid By Year
- Property Type Price
Frequently asked questions about Langham
What is the average price for a property for sale in Langham?
The average price for a property for sale in Langham is £435,237. This amount is 6% higher than the average price in Oakham. There are 173 property listings for sale in Langham.
What streets have the most expensive properties for sale in Langham?
The streets with the most expensive properties for sale in Langham are The Range at an average of £715,500, Cold Overton Road at an average of £658,333 and Sharrads Way at an average of £526,500.
What streets have the most affordable properties for sale in Langham?
The streets with the most affordable properties for sale in Langham are Ruddle Way at an average of £268,307, Well Street at an average of £347,500 and Kimball Close at an average of £371,309.
Which train stations are available in or near Langham?
Some of the train stations available in or near Langham are Oakham, Melton Mowbray and Stamford.
Property Price Paid in Langham by Year
The average sold property price by year was:
| Year | Average Sold Price | Price Change |
Sold Properties
|
|---|---|---|---|
| 2025 | £506,711 | 17% |
13 Properties |
| 2024 | £421,833 | 9% |
17 Properties |
| 2023 | £385,145 | -22% |
14 Properties |
| 2022 | £469,944 | 16% |
18 Properties |
| 2021 | £393,497 | -4% |
35 Properties |
| 2020 | £409,815 | 21% |
19 Properties |
| 2019 | £322,720 | -18% |
24 Properties |
| 2018 | £379,446 | 8% |
28 Properties |
| 2017 | £350,102 | 17% |
24 Properties |
| 2016 | £291,653 | 2% |
29 Properties |
| 2015 | £284,500 | -4% |
24 Properties |
| 2014 | £296,267 | -10% |
28 Properties |
| 2013 | £325,456 | 24% |
18 Properties |
| 2012 | £247,337 | -23% |
28 Properties |
| 2011 | £305,330 | 28% |
21 Properties |
| 2010 | £219,125 | -7% |
16 Properties |
| 2009 | £234,803 | 7% |
13 Properties |
| 2008 | £219,208 | -25% |
12 Properties |
| 2007 | £274,253 | 8% |
33 Properties |
| 2006 | £253,214 | 0,4% |
37 Properties |
| 2005 | £252,265 | 1% |
36 Properties |
| 2004 | £248,989 | 10% |
39 Properties |
| 2003 | £225,023 | 27% |
21 Properties |
| 2002 | £163,510 | 7% |
64 Properties |
| 2001 | £152,508 | 15% |
36 Properties |
| 2000 | £129,790 | -1% |
30 Properties |
| 1999 | £131,026 | 25% |
15 Properties |
| 1998 | £98,520 | -13% |
17 Properties |
| 1997 | £111,277 | 23% |
18 Properties |
| 1996 | £85,275 | 4% |
14 Properties |
| 1995 | £81,571 | - |
14 Properties |
Property Price per Property Type in Langham
Here you can find historic sold price data in order to help with your property search.
The average Property Paid Price for specific property types in the last three years are:
| Property Type | Average Sold Price | Sold Properties |
|---|---|---|
| Semi Detached House | £389,500.00 | 5 Semi Detached Houses |
| Detached House | £510,648.00 | 30 Detached Houses |
| Terraced House | £209,276.00 | 9 Terraced Houses |

