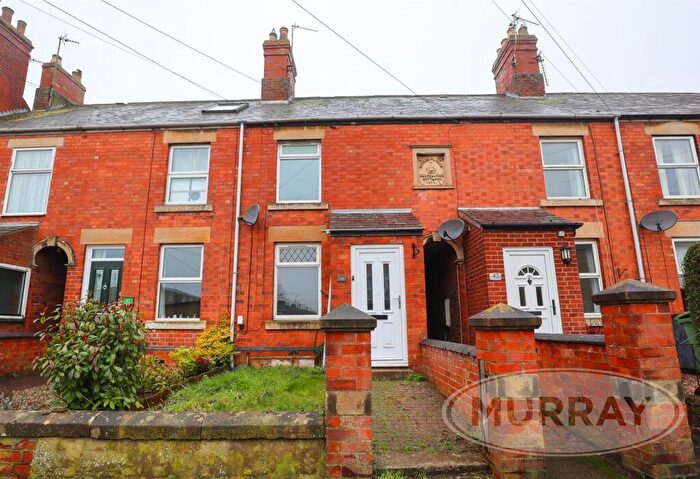
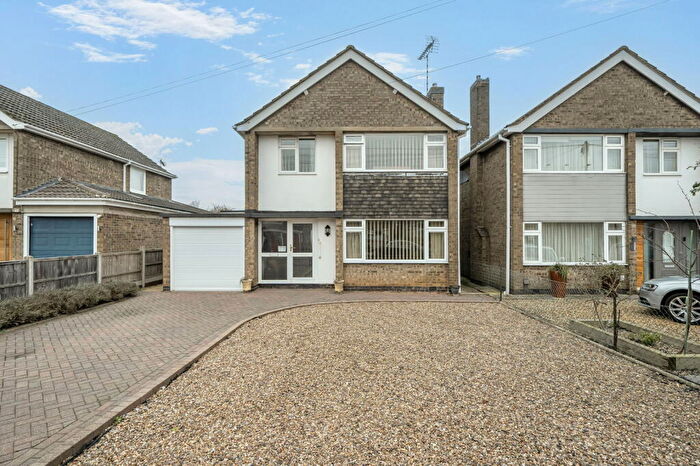
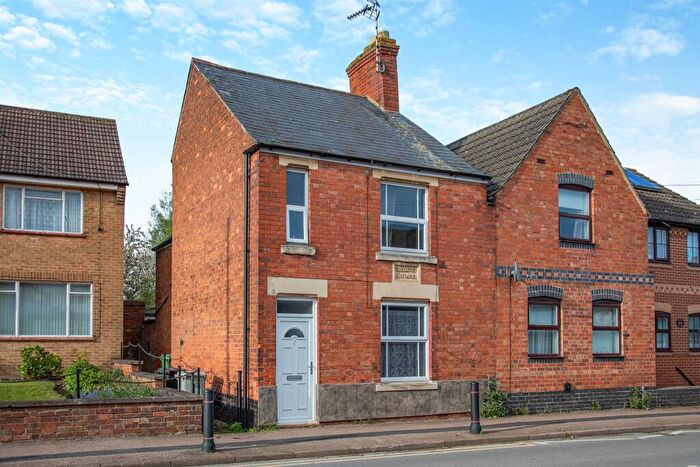
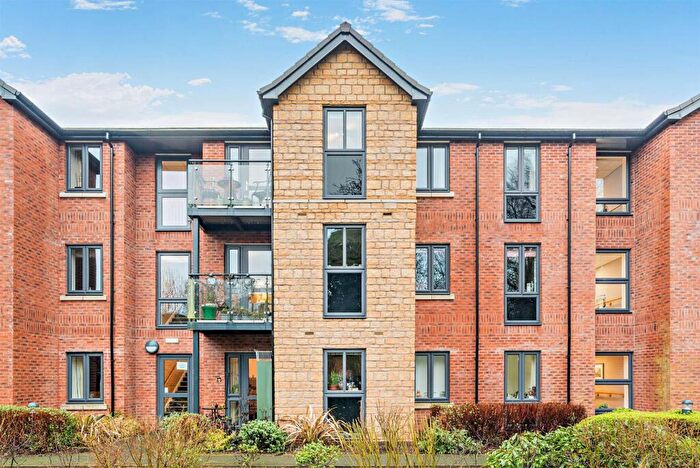
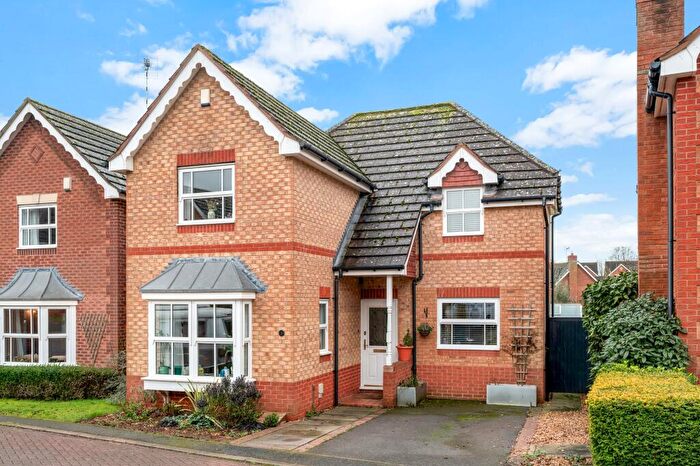
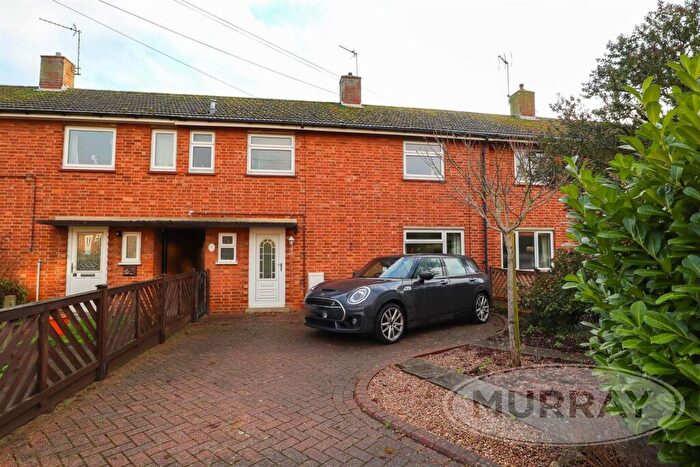
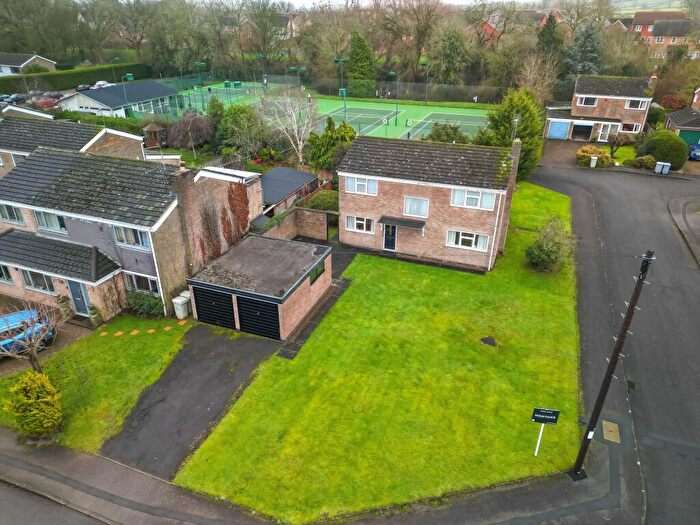
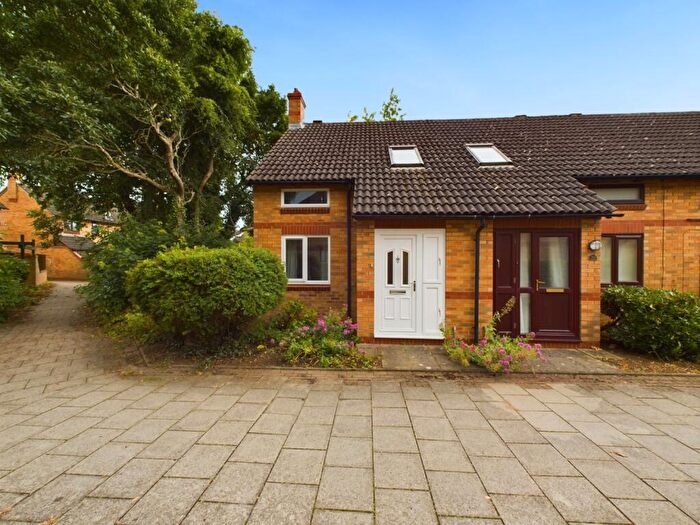
Houses for sale & to rent in Oakham South, Oakham
House Prices in Oakham South
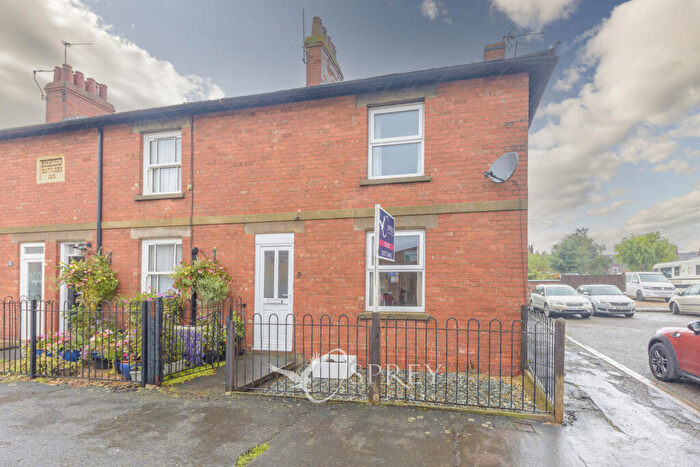
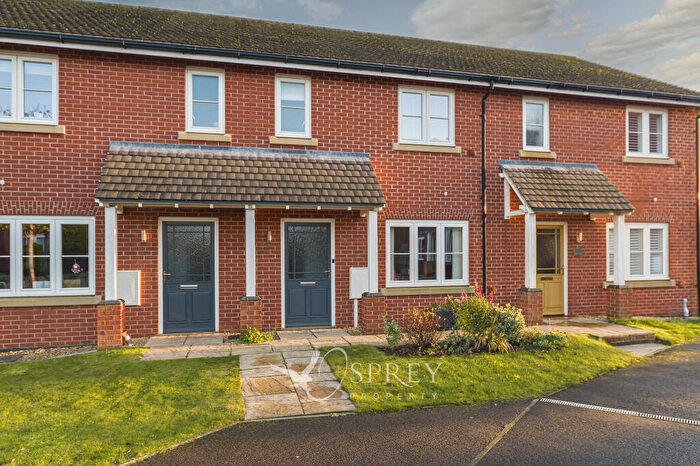
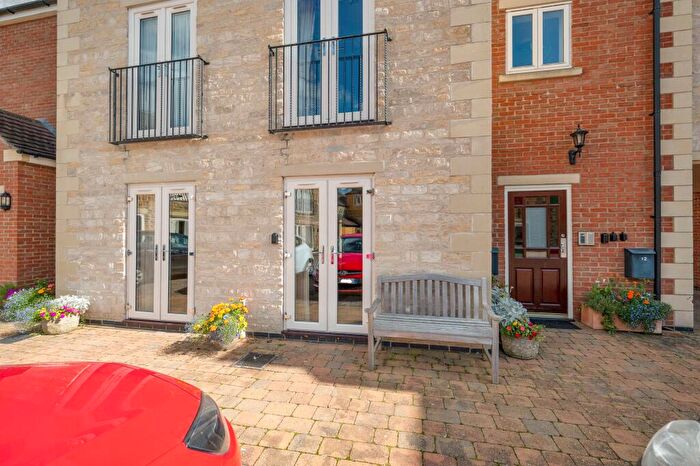
Properties in Oakham South have an average house price of £368,727.00 and had 18 Property Transactions within the last 3 years¹.
Oakham South is an area in Oakham, Rutland with 57 households², where the most expensive property was sold for £675,000.00.
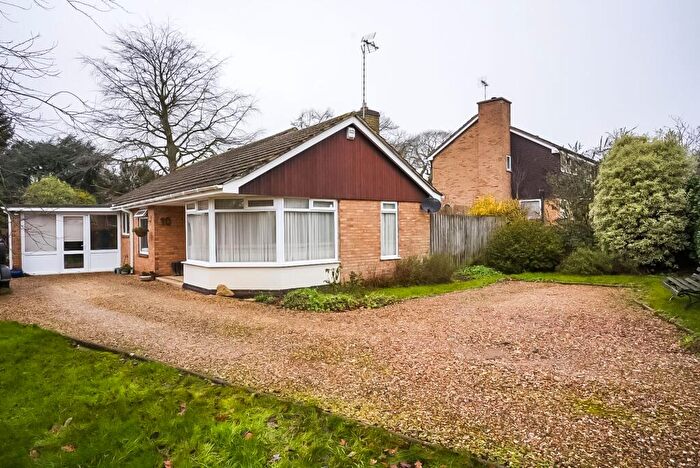
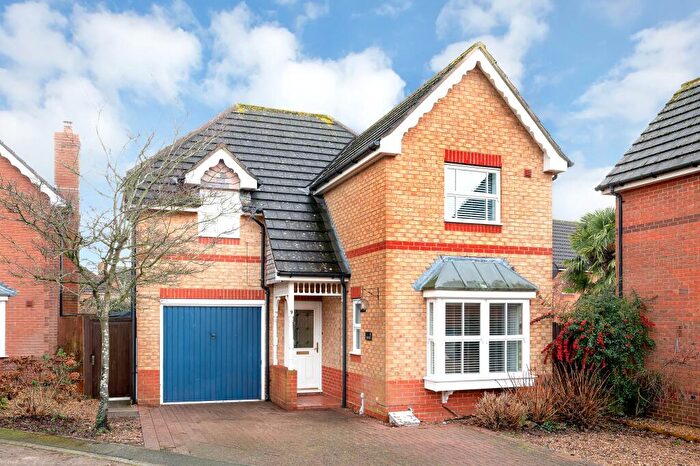
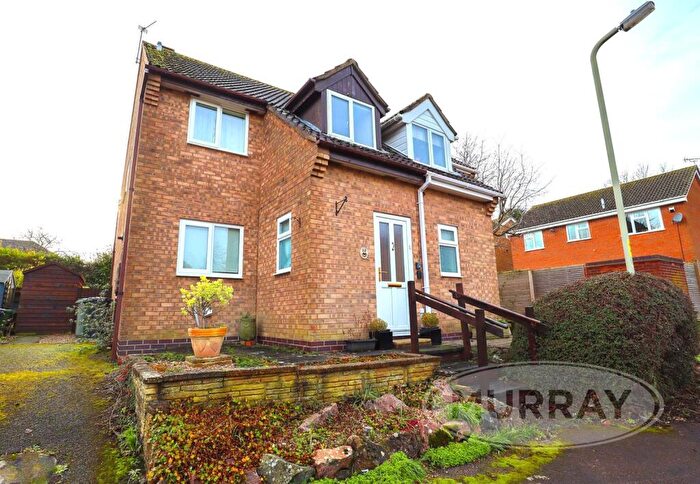
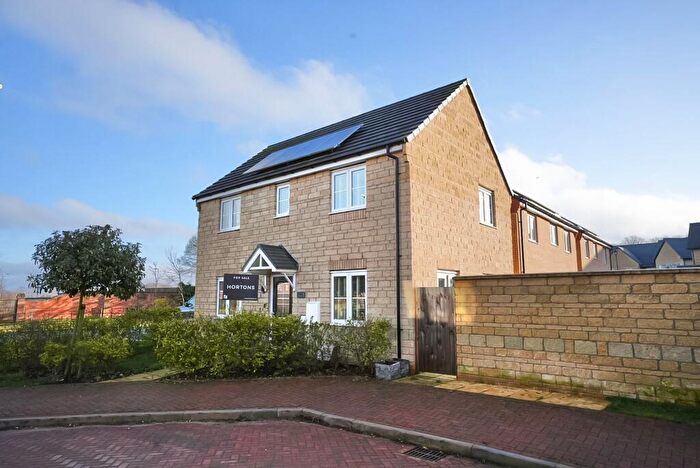
Properties for sale in Oakham South
Roads and Postcodes in Oakham South
Navigate through our locations to find the location of your next house in Oakham South, Oakham for sale or to rent.
| Streets | Postcodes |
|---|---|
| Brooke Road | LE15 6HH |
| Burley Road | LE15 6DE LE15 6DN |
| Catmos Street | LE15 0SA LE15 0SB LE15 0SD LE15 0SE LE15 0SF LE15 0SG LE15 0SH LE15 0SJ LE15 0SL LE15 0SN LE15 0SP LE15 0SQ LE15 0SR LE15 0SS LE15 0ST LE15 0SW LE15 6HP |
| Dyrham Place | LE15 6FA |
| Egleton Place | LE15 6JY |
| Martinsley Place | LE15 6JH |
| Penn Street | LE15 6DF |
| Priors Close | LE15 6NY |
| South Street | LE15 6HD |
| Spinney Hill | LE15 6JL |
| The Lodge | LE15 6JX |
| Uppingham Road | LE15 8AA |
Transport near Oakham South
- FAQ
- Price Paid By Year
- Property Type Price
Frequently asked questions about Oakham South
What is the average price for a property for sale in Oakham South?
The average price for a property for sale in Oakham South is £368,727. This amount is 10% lower than the average price in Oakham. There are 657 property listings for sale in Oakham South.
What streets have the most expensive properties for sale in Oakham South?
The streets with the most expensive properties for sale in Oakham South are Egleton Place at an average of £497,500 and Spinney Hill at an average of £433,583.
What streets have the most affordable properties for sale in Oakham South?
The streets with the most affordable properties for sale in Oakham South are Priors Close at an average of £260,000 and Penn Street at an average of £292,887.
Which train stations are available in or near Oakham South?
Some of the train stations available in or near Oakham South are Oakham, Melton Mowbray and Stamford.
Property Price Paid in Oakham South by Year
The average sold property price by year was:
| Year | Average Sold Price | Price Change |
Sold Properties
|
|---|---|---|---|
| 2025 | £399,375 | 16% |
4 Properties |
| 2024 | £336,325 | -16% |
8 Properties |
| 2023 | £391,500 | 38% |
6 Properties |
| 2022 | £243,154 | -35% |
17 Properties |
| 2021 | £328,636 | -11% |
25 Properties |
| 2020 | £364,253 | 30% |
19 Properties |
| 2019 | £256,421 | -97% |
71 Properties |
| 2018 | £504,000 | -4% |
15 Properties |
| 2017 | £522,692 | -3% |
13 Properties |
| 2016 | £537,222 | - |
9 Properties |
Property Price per Property Type in Oakham South
Here you can find historic sold price data in order to help with your property search.
The average Property Paid Price for specific property types in the last three years are:
| Property Type | Average Sold Price | Sold Properties |
|---|---|---|
| Semi Detached House | £245,000.00 | 4 Semi Detached Houses |
| Flat | £292,887.00 | 8 Flats |
| Detached House | £552,333.00 | 6 Detached Houses |

