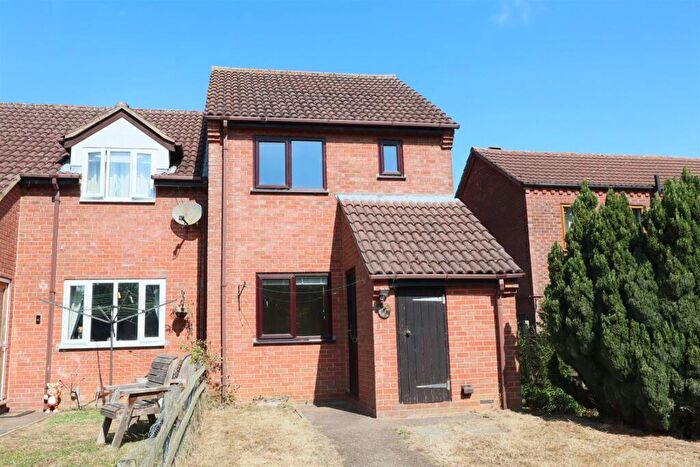
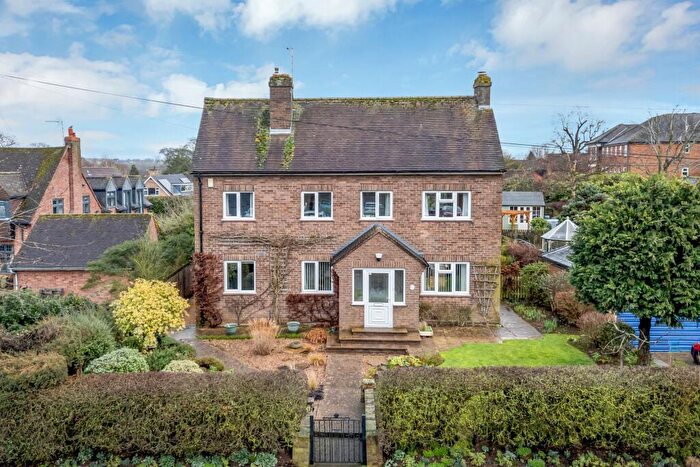
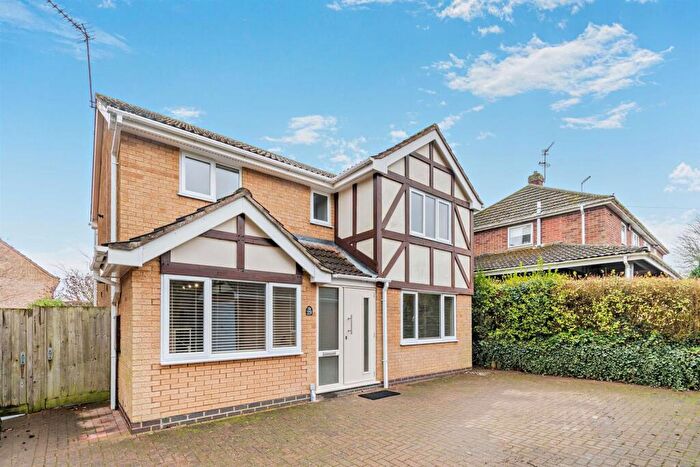
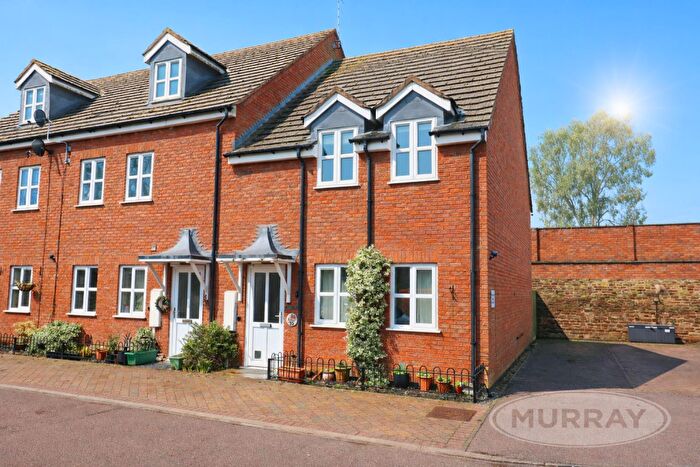
Houses for sale & to rent in Oakham South East, Oakham
House Prices in Oakham South East
Properties in Oakham South East have an average house price of £403,424.00 and had 134 Property Transactions within the last 3 years¹.
Oakham South East is an area in Oakham, Rutland with 1,129 households², where the most expensive property was sold for £1,200,000.00.
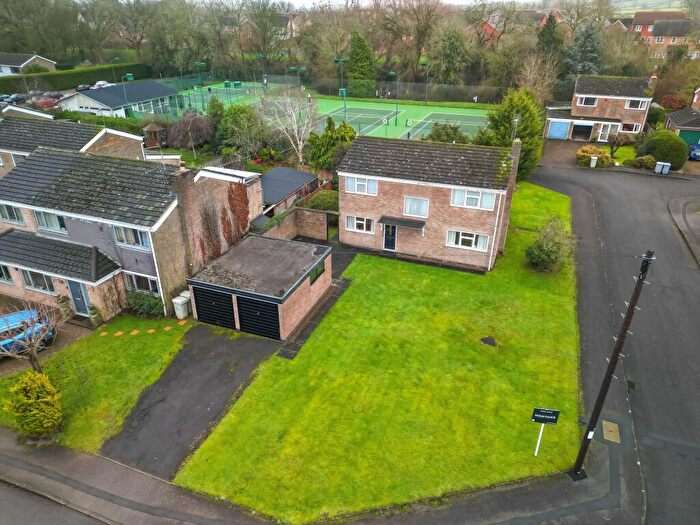
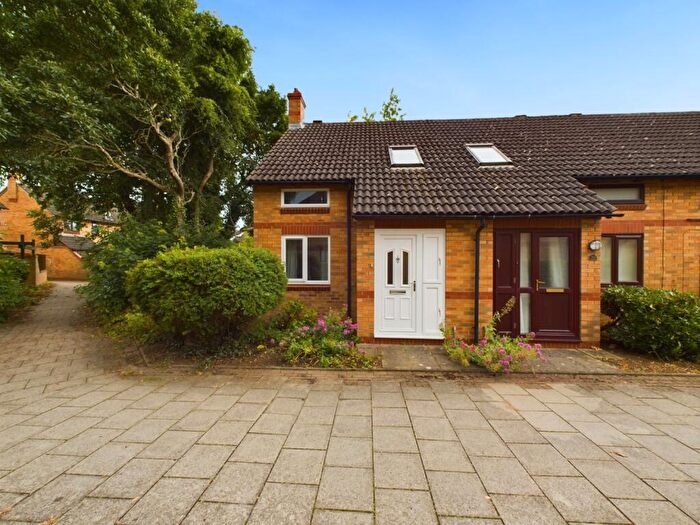
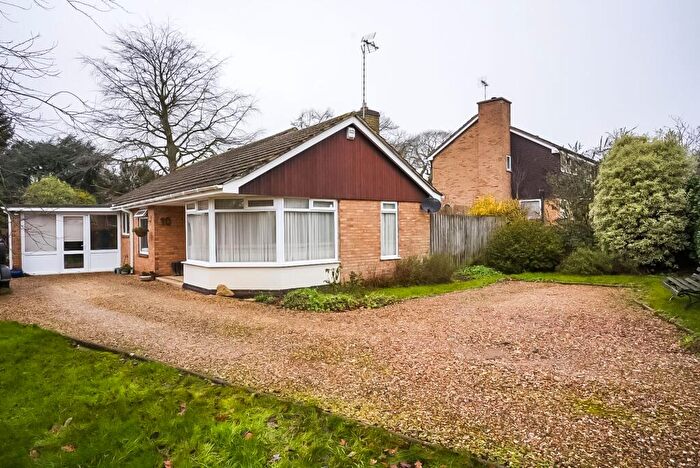
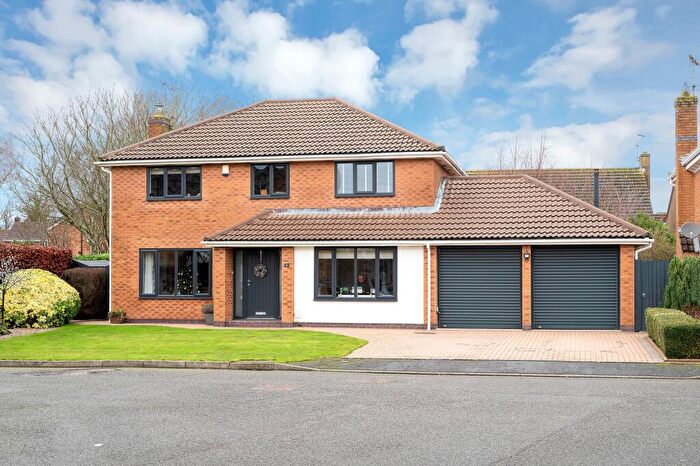
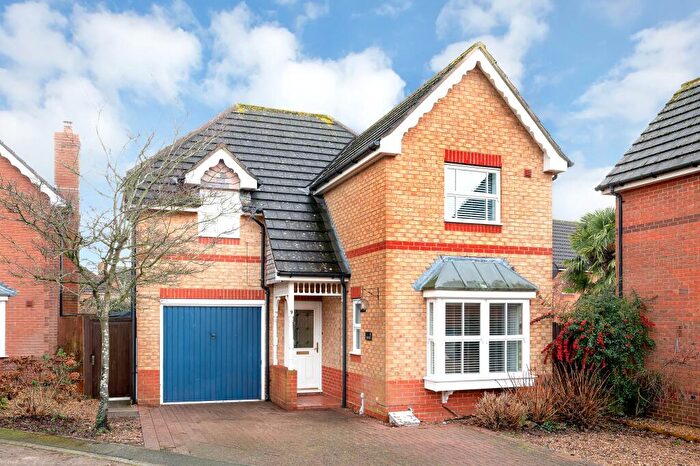
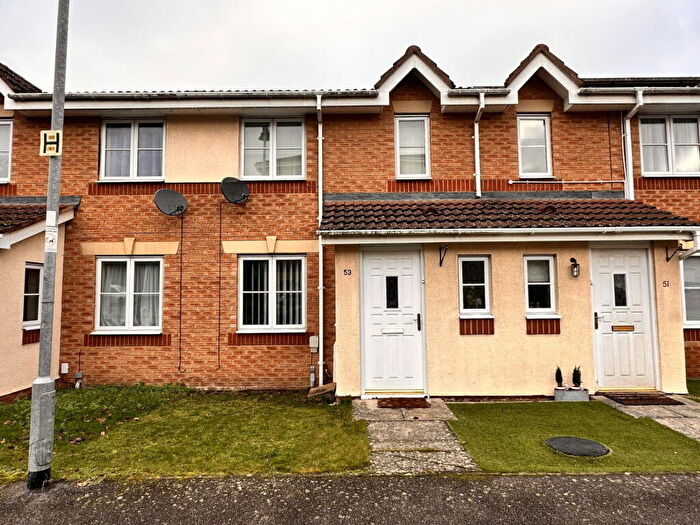
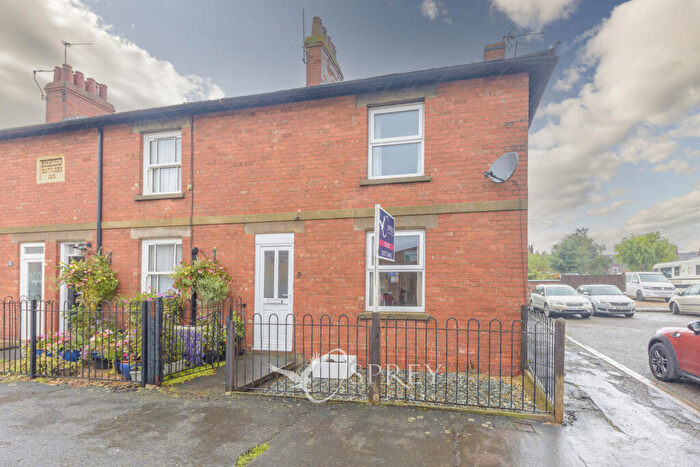
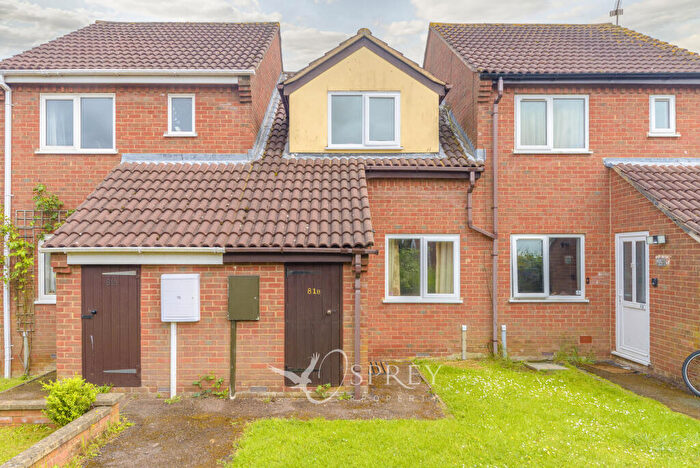
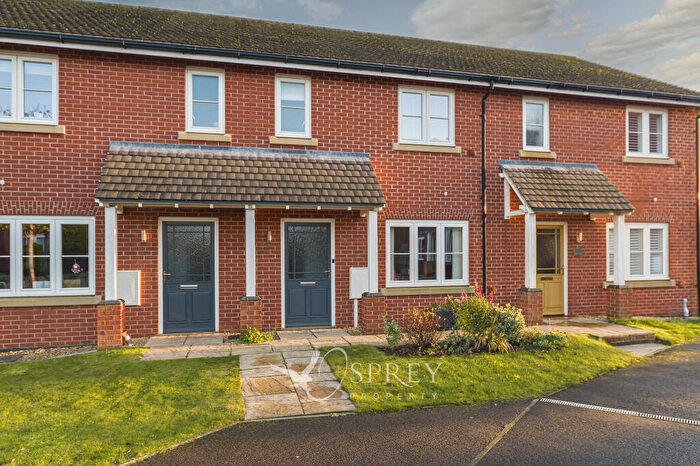
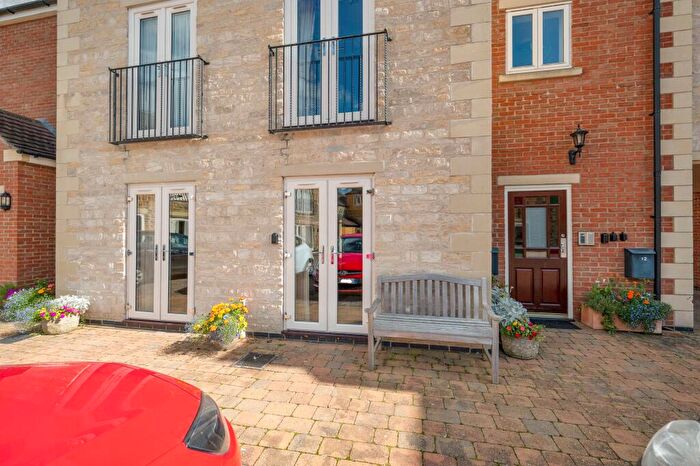
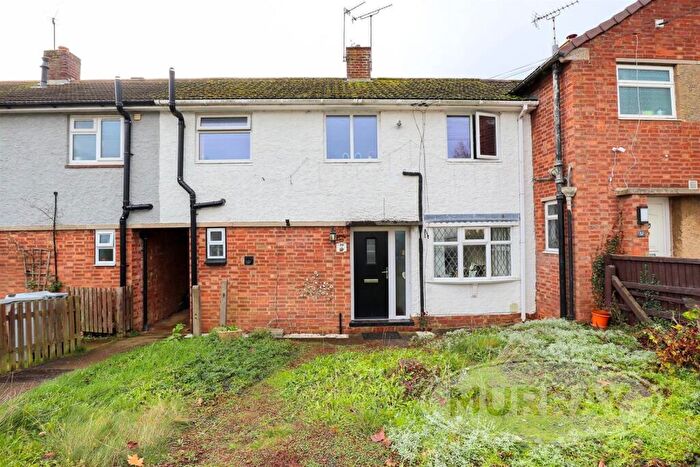
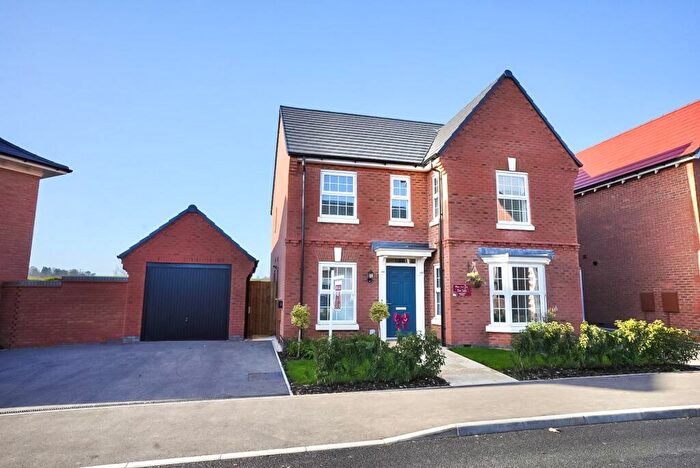
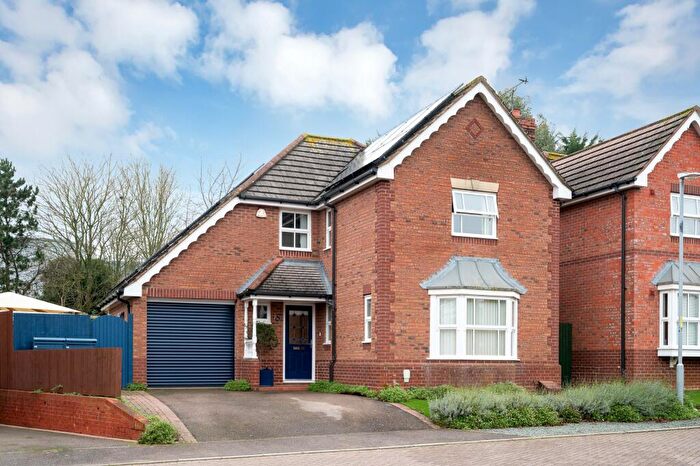
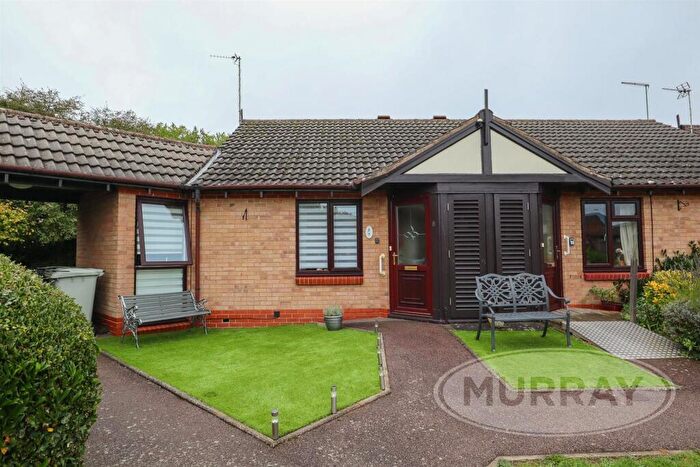
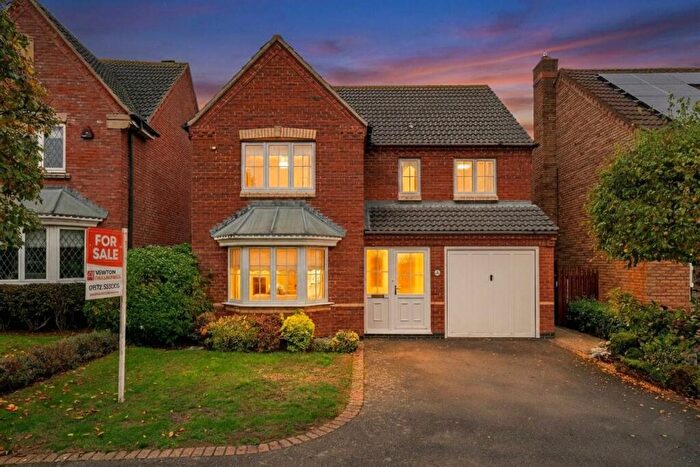
Properties for sale in Oakham South East
Roads and Postcodes in Oakham South East
Navigate through our locations to find the location of your next house in Oakham South East, Oakham for sale or to rent.
| Streets | Postcodes |
|---|---|
| Alsthorpe Road | LE15 6FD |
| Alwyne Close | LE15 6HR |
| Banff Close | LE15 6JJ |
| Beech Road | LE15 6DG |
| Bowling Green Close | LE15 6HL |
| Brooke Close | LE15 6GD |
| Brooke Road | LE15 6HG |
| Burley Park Way | LE15 6FB |
| Burley Road | LE15 6DH LE15 6DJ LE15 6DL |
| Calgary Crescent | LE15 6JF |
| Camrose Close | LE15 6UW |
| Catmose Park Road | LE15 6HN |
| Catmose Street | LE15 6HW |
| Claresholm Close | LE15 6UR |
| Cricket Lawns | LE15 6HT |
| Crown Gardens | LE15 6JN |
| Edmonton Way | LE15 6JE |
| Elm Close | LE15 6DS |
| Fair View | LE15 6UP |
| Gunthorpe Close | LE15 6FH |
| Hambleton Close | LE15 6FY |
| Hardwick Close | LE15 6FF |
| Horn Close | LE15 6FE |
| Jasper Road | LE15 6UL LE15 6UN |
| Ladywell | LE15 6DB LE15 6DD |
| Lethbridge Close | LE15 6UJ |
| Lodge Gardens | LE15 6EP |
| Normanton Drive | LE15 6FG |
| Penn Street | LE15 6BB LE15 6DP |
| Peterborough Avenue | LE15 6EB |
| Pickworth Close | LE15 6FL |
| Pilton Close | LE15 6HS |
| Sculthorpe Close | LE15 6FJ |
| Snelston Close | LE15 6FQ |
| South Street | LE15 6BQ LE15 6HY |
| St Albans Close | LE15 6EW |
| St Peters Close | LE15 6EE |
| Stamford Road | LE15 6HZ LE15 6JA |
| The Dell | LE15 6JG |
| The Sidings | LE15 6RN |
| The Vale | LE15 6JQ |
| Tolethorpe Close | LE15 6GF |
| Uppingham Road | LE15 6HU LE15 6JB LE15 6JD |
| Vicarage Road | LE15 6EG |
| Wensum Close | LE15 6FU |
| Willow Crescent | LE15 6EH LE15 6EQ |
| Witchley Close | LE15 6FZ |
| Woodland View | LE15 6EJ LE15 6EL |
Transport near Oakham South East
- FAQ
- Price Paid By Year
- Property Type Price
Frequently asked questions about Oakham South East
What is the average price for a property for sale in Oakham South East?
The average price for a property for sale in Oakham South East is £403,424. This amount is 2% lower than the average price in Oakham. There are 527 property listings for sale in Oakham South East.
What streets have the most expensive properties for sale in Oakham South East?
The streets with the most expensive properties for sale in Oakham South East are Stamford Road at an average of £1,020,000, Uppingham Road at an average of £877,500 and Catmose Park Road at an average of £868,333.
What streets have the most affordable properties for sale in Oakham South East?
The streets with the most affordable properties for sale in Oakham South East are Ladywell at an average of £157,176, The Sidings at an average of £175,000 and Elm Close at an average of £190,000.
Which train stations are available in or near Oakham South East?
Some of the train stations available in or near Oakham South East are Oakham, Melton Mowbray and Stamford.
Property Price Paid in Oakham South East by Year
The average sold property price by year was:
| Year | Average Sold Price | Price Change |
Sold Properties
|
|---|---|---|---|
| 2025 | £382,311 | -14% |
44 Properties |
| 2024 | £435,999 | 10% |
45 Properties |
| 2023 | £391,493 | 10% |
45 Properties |
| 2022 | £350,978 | 13% |
52 Properties |
| 2021 | £305,729 | -17% |
54 Properties |
| 2020 | £357,685 | 3% |
39 Properties |
| 2019 | £345,797 | 13% |
52 Properties |
| 2018 | £301,448 | -7% |
53 Properties |
| 2017 | £323,301 | 19% |
56 Properties |
| 2016 | £262,899 | -9% |
48 Properties |
| 2015 | £286,014 | 9% |
66 Properties |
| 2014 | £259,409 | -1% |
47 Properties |
| 2013 | £261,803 | 0,3% |
46 Properties |
| 2012 | £260,991 | 14% |
40 Properties |
| 2011 | £225,192 | -19% |
41 Properties |
| 2010 | £268,364 | 22% |
47 Properties |
| 2009 | £209,003 | -33% |
48 Properties |
| 2008 | £278,841 | 16% |
44 Properties |
| 2007 | £233,438 | -10% |
63 Properties |
| 2006 | £257,175 | 15% |
87 Properties |
| 2005 | £219,056 | 2% |
77 Properties |
| 2004 | £215,176 | 4% |
96 Properties |
| 2003 | £207,598 | 16% |
78 Properties |
| 2002 | £175,283 | 22% |
88 Properties |
| 2001 | £137,060 | 9% |
121 Properties |
| 2000 | £124,422 | 20% |
115 Properties |
| 1999 | £98,971 | 3% |
106 Properties |
| 1998 | £95,641 | 23% |
77 Properties |
| 1997 | £74,073 | 0,4% |
57 Properties |
| 1996 | £73,763 | -3% |
33 Properties |
| 1995 | £76,218 | - |
38 Properties |
Property Price per Property Type in Oakham South East
Here you can find historic sold price data in order to help with your property search.
The average Property Paid Price for specific property types in the last three years are:
| Property Type | Average Sold Price | Sold Properties |
|---|---|---|
| Semi Detached House | £253,031.00 | 23 Semi Detached Houses |
| Detached House | £604,589.00 | 64 Detached Houses |
| Terraced House | £231,466.00 | 30 Terraced Houses |
| Flat | £153,029.00 | 17 Flats |

