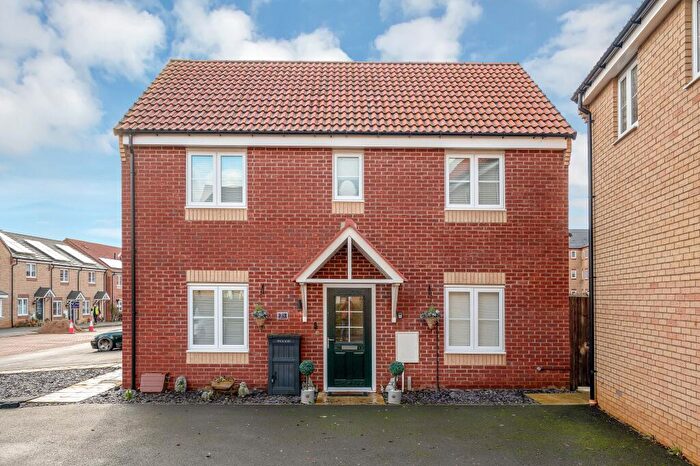
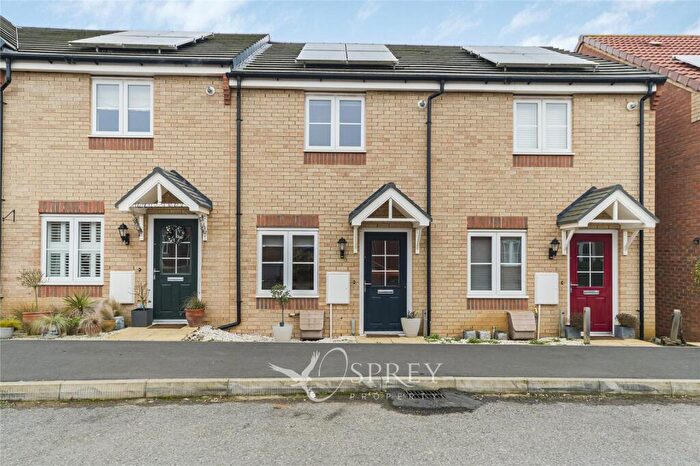
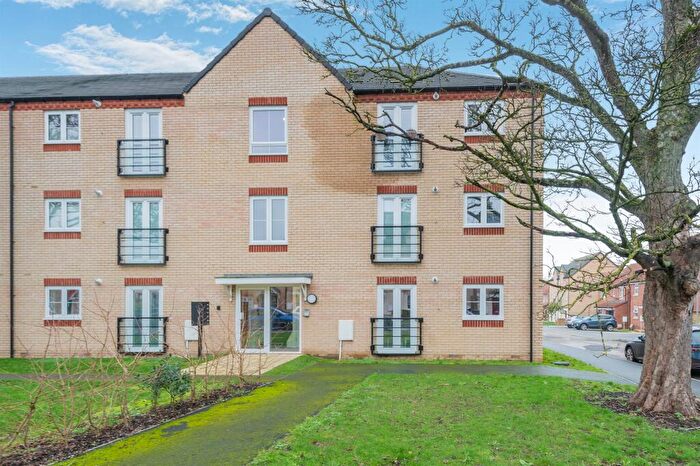
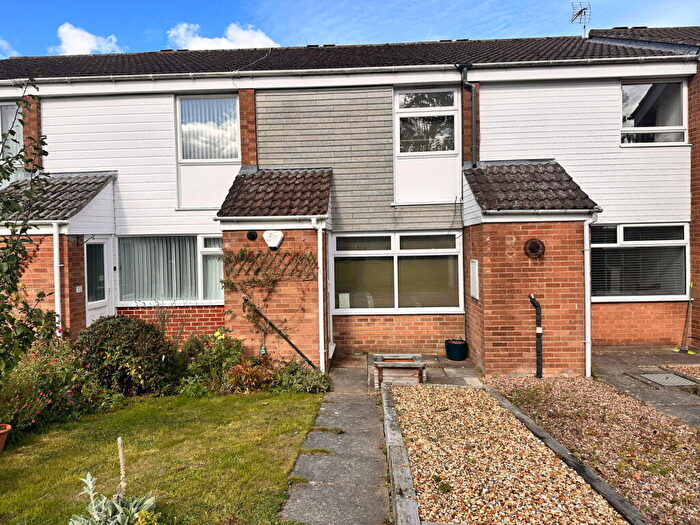
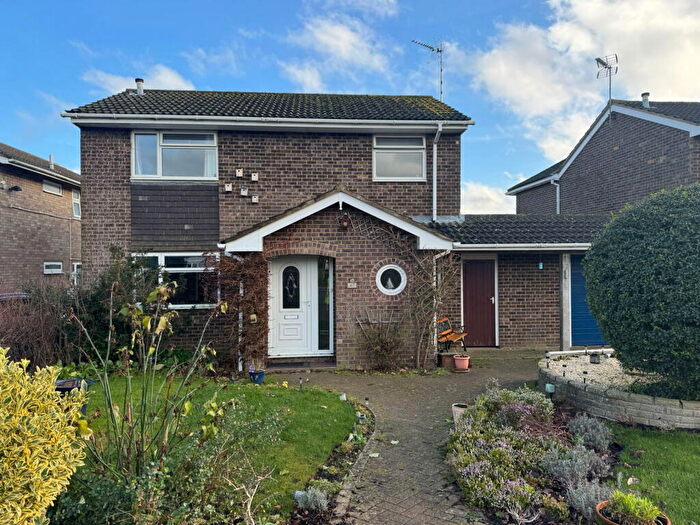
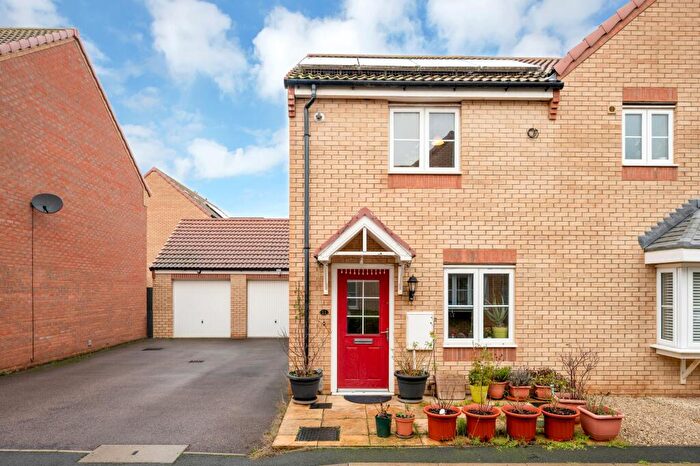
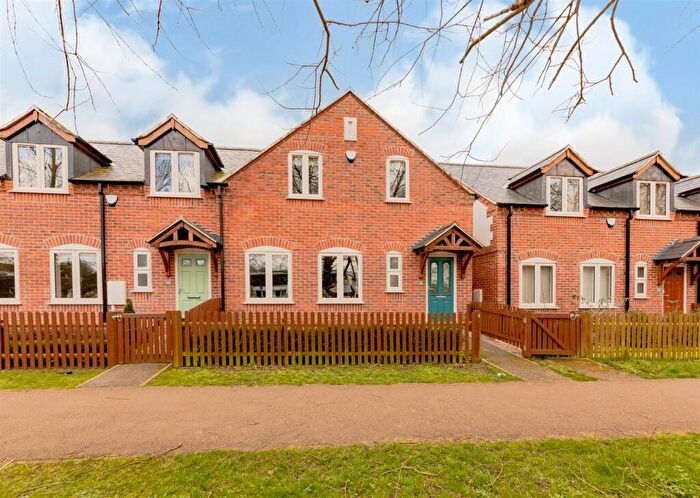
Houses for sale & to rent in Oakham North West, Oakham
House Prices in Oakham North West
Properties in Oakham North West have an average house price of £264,739.00 and had 189 Property Transactions within the last 3 years¹.
Oakham North West is an area in Oakham, Rutland with 1,384 households², where the most expensive property was sold for £700,000.00.
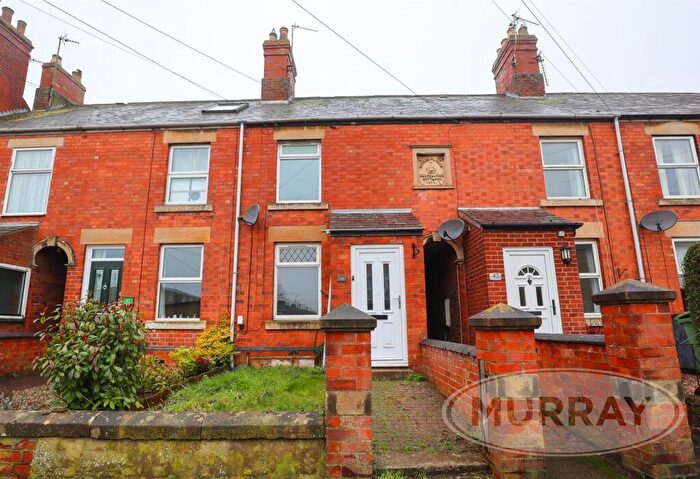
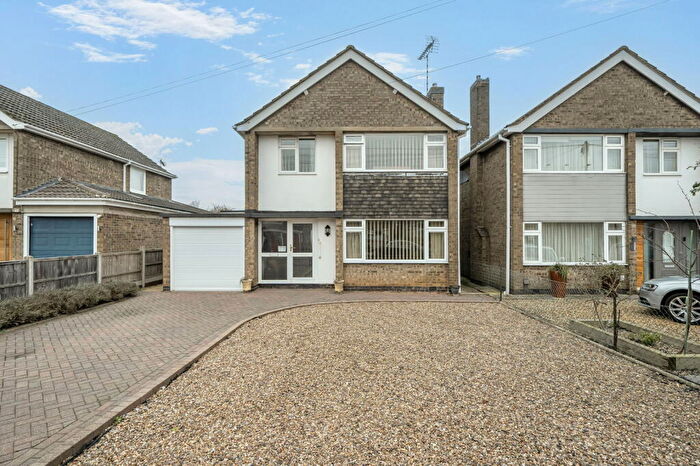
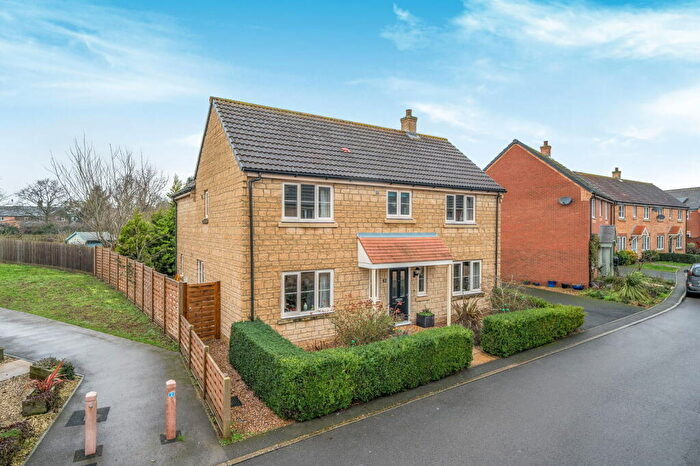
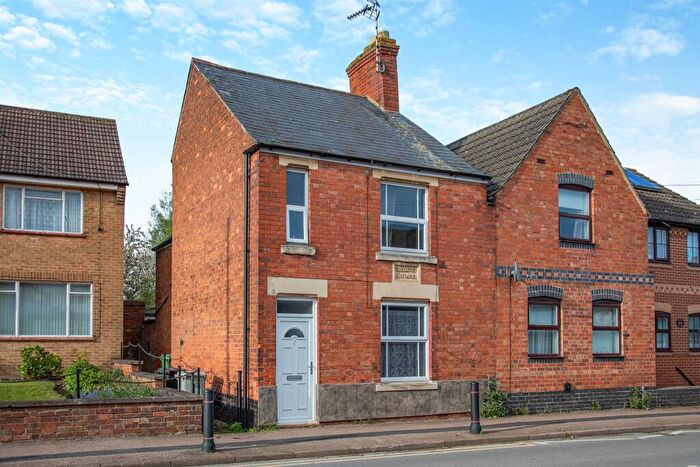
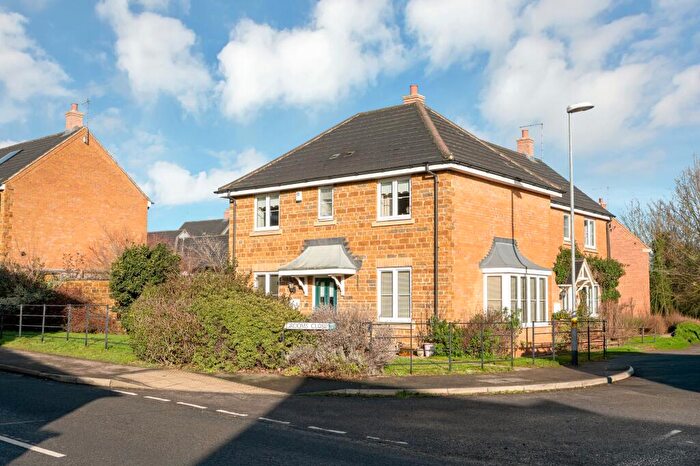
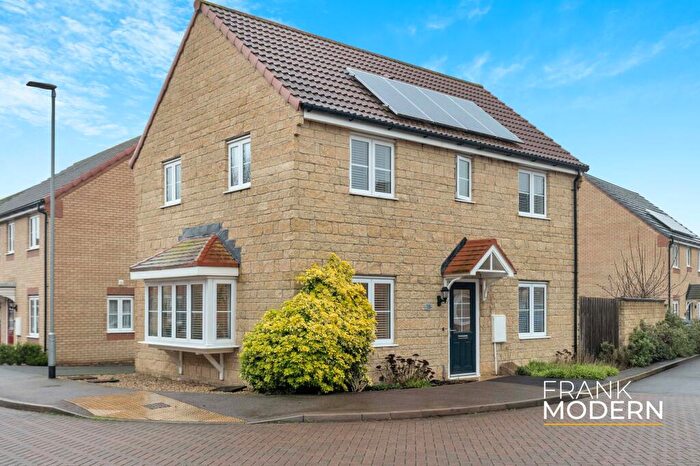
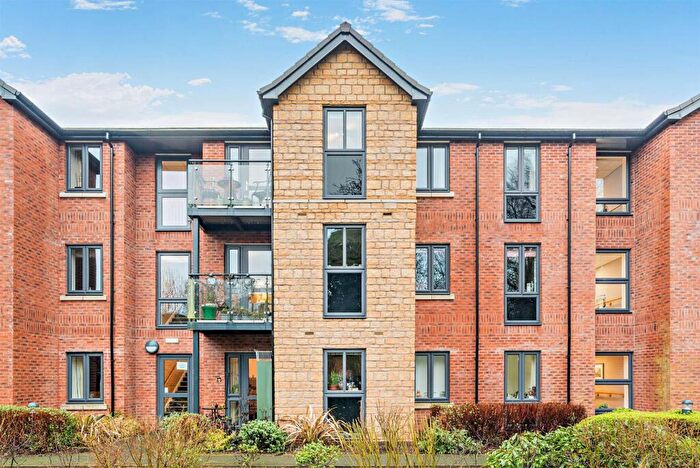
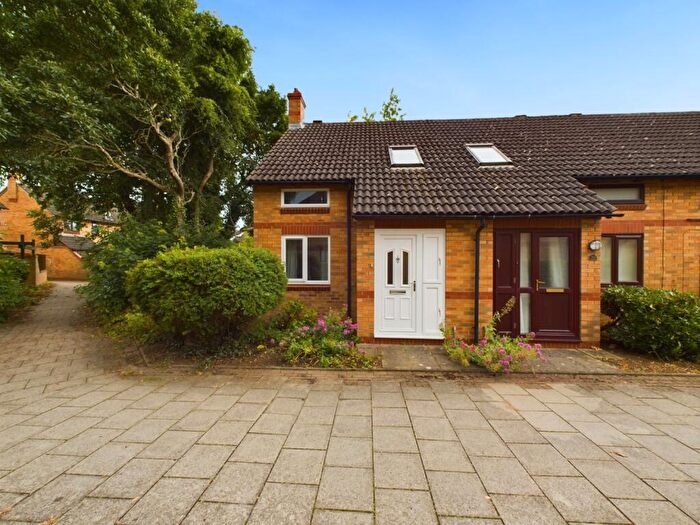
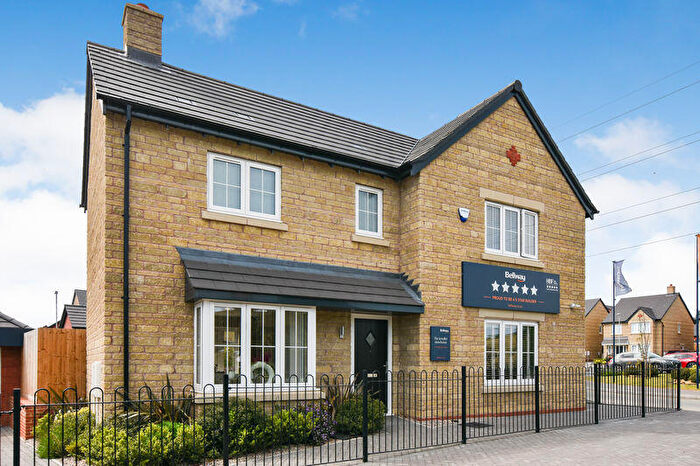
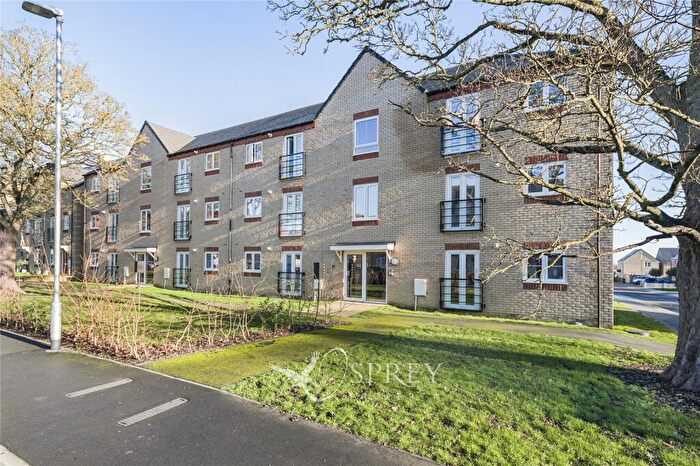
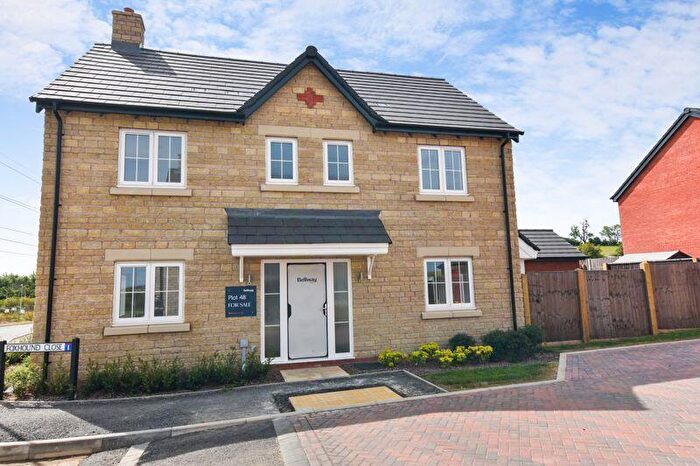
Properties for sale in Oakham North West
Roads and Postcodes in Oakham North West
Navigate through our locations to find the location of your next house in Oakham North West, Oakham for sale or to rent.
| Streets | Postcodes |
|---|---|
| Aintree Avenue | LE15 7TR |
| Alexander Crescent | LE15 6LA LE15 6LB |
| Alpine Close | LE15 6NP |
| Ascot Close | LE15 7TS |
| Barleythorpe Road | LE15 6NR |
| Blacksmiths Avenue | LE15 7TD |
| Braunston Road | LE15 6LE LE15 6LF LE15 6LG LE15 8UH |
| Bridle Close | LE15 7TG |
| Browning Road | LE15 6LQ |
| Cheviot Close | LE15 6NS |
| Chiltern Close | LE15 6NW |
| Churchill Road | LE15 6LH |
| Clock House Court | LE15 7FD |
| Cold Overton Road | LE15 6NT LE15 6NU LE15 8DA |
| Coleridge Way | LE15 6GA |
| Coltsfoot Close | LE15 7GB |
| Cotswold Walk | LE15 6NH |
| Digby Drive | LE15 6LJ |
| Ferrers Close | LE15 6PW |
| Finch Avenue | LE15 6NB |
| Glebe Way | LE15 6LX |
| Grampian Way | LE15 6NL LE15 6NX |
| Grooms Close | LE15 7GJ |
| Hanbury Close | LE15 6LY |
| Hawthorn Close | LE15 7UB |
| Hectors Way | LE15 6JZ |
| Hill Road | LE15 6PA |
| Hilltop Drive | LE15 6NF |
| Horseshoe Close | LE15 7GL |
| Hudson Close | LE15 6NA |
| Huntsmans Drive | LE15 6RP |
| John Clare Close | LE15 6GH |
| Kempton Drive | LE15 7QL |
| Kennedy Close | LE15 6LL |
| Kings Close | LE15 6RD |
| Kings Road | LE15 6PB LE15 6PD |
| Lands End Way | LE15 6US |
| Long Row | LE15 6LN LE15 6RR |
| Lonsdale Way | LE15 6LP LE15 6LR |
| Main Road | LE15 7EE |
| Mallard Court | LE15 6RQ |
| Malvern Walk | LE15 6NJ |
| Manor Lane | LE15 7EG |
| Martingale Mews | LE15 7TH |
| Mendip Road | LE15 6NN |
| Mountbatten Road | LE15 6LS |
| Paddock Avenue | LE15 7GU |
| Park Lane | LE15 6PG |
| Parkfield Road | LE15 6PE LE15 6PF |
| Pasture Lane | LE15 7EQ |
| Pelham Court | LE15 7FX LE15 7GP |
| Pentland Court | LE15 6NQ |
| Pillings Road | LE15 6QF |
| Princess Avenue | LE15 6PQ |
| Racecourse Road | LE15 7TF |
| Redland Road | LE15 6PH LE15 6PJ |
| Sandown Close | LE15 7FU |
| Snowdon Avenue | LE15 6PL |
| Stud Road | LE15 7GD |
| Warn Crescent | LE15 6LZ |
| West Road | LE15 6BF LE15 6LT LE15 6LU |
| Westfield Avenue | LE15 6PN |
| Willoughby Gardens | LE15 6HA |
Transport near Oakham North West
- FAQ
- Price Paid By Year
- Property Type Price
Frequently asked questions about Oakham North West
What is the average price for a property for sale in Oakham North West?
The average price for a property for sale in Oakham North West is £264,739. This amount is 36% lower than the average price in Oakham. There are 698 property listings for sale in Oakham North West.
What streets have the most expensive properties for sale in Oakham North West?
The streets with the most expensive properties for sale in Oakham North West are Pillings Road at an average of £420,000, Aintree Avenue at an average of £410,000 and Pasture Lane at an average of £404,500.
What streets have the most affordable properties for sale in Oakham North West?
The streets with the most affordable properties for sale in Oakham North West are Hill Road at an average of £140,000, Pelham Court at an average of £145,833 and Pentland Court at an average of £178,333.
Which train stations are available in or near Oakham North West?
Some of the train stations available in or near Oakham North West are Oakham, Melton Mowbray and Stamford.
Property Price Paid in Oakham North West by Year
The average sold property price by year was:
| Year | Average Sold Price | Price Change |
Sold Properties
|
|---|---|---|---|
| 2025 | £283,456 | 8% |
58 Properties |
| 2024 | £261,873 | 4% |
69 Properties |
| 2023 | £250,420 | 5% |
62 Properties |
| 2022 | £236,918 | -13% |
89 Properties |
| 2021 | £267,338 | 18% |
91 Properties |
| 2020 | £220,263 | - |
63 Properties |
| 2019 | £220,257 | -6% |
77 Properties |
| 2018 | £233,736 | 19% |
95 Properties |
| 2017 | £190,182 | -14% |
87 Properties |
| 2016 | £216,706 | 1% |
116 Properties |
| 2015 | £213,847 | 6% |
132 Properties |
| 2014 | £200,747 | 10% |
179 Properties |
| 2013 | £180,776 | 11% |
125 Properties |
| 2012 | £160,326 | 6% |
82 Properties |
| 2011 | £150,229 | -8% |
50 Properties |
| 2010 | £162,463 | 6% |
49 Properties |
| 2009 | £151,939 | -19% |
43 Properties |
| 2008 | £181,254 | 10% |
31 Properties |
| 2007 | £162,272 | -4% |
86 Properties |
| 2006 | £167,981 | 14% |
92 Properties |
| 2005 | £145,246 | -14% |
89 Properties |
| 2004 | £166,251 | 20% |
76 Properties |
| 2003 | £132,535 | 20% |
77 Properties |
| 2002 | £105,443 | 16% |
79 Properties |
| 2001 | £89,051 | 18% |
77 Properties |
| 2000 | £73,448 | 5% |
78 Properties |
| 1999 | £69,587 | 16% |
89 Properties |
| 1998 | £58,190 | 2% |
63 Properties |
| 1997 | £57,266 | -5% |
82 Properties |
| 1996 | £60,283 | 16% |
57 Properties |
| 1995 | £50,489 | - |
50 Properties |
Property Price per Property Type in Oakham North West
Here you can find historic sold price data in order to help with your property search.
The average Property Paid Price for specific property types in the last three years are:
| Property Type | Average Sold Price | Sold Properties |
|---|---|---|
| Semi Detached House | £256,961.00 | 58 Semi Detached Houses |
| Detached House | £351,761.00 | 57 Detached Houses |
| Terraced House | £219,522.00 | 58 Terraced Houses |
| Flat | £146,837.00 | 16 Flats |

