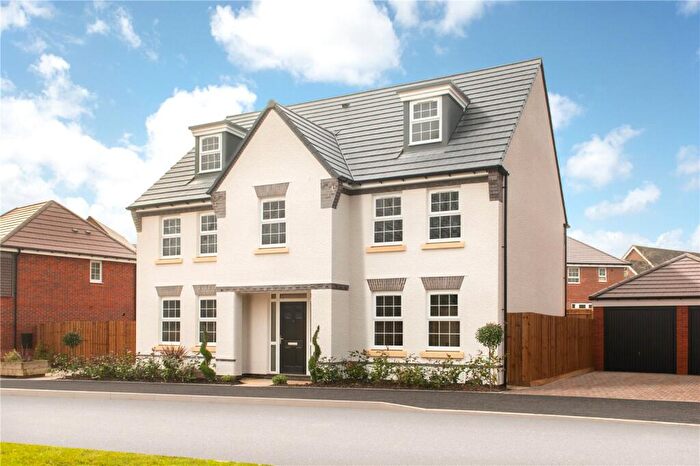
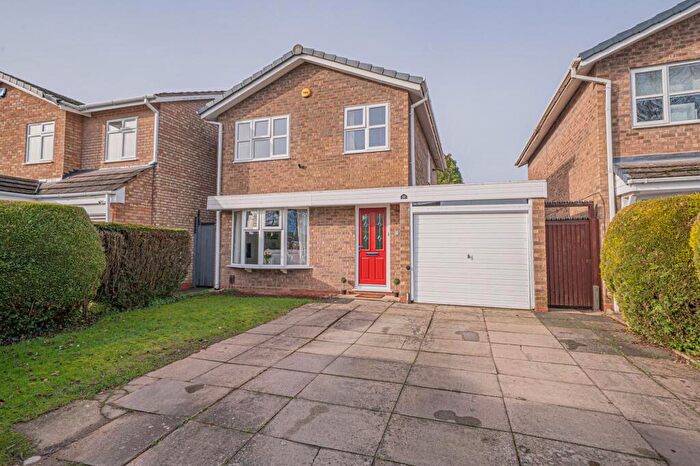
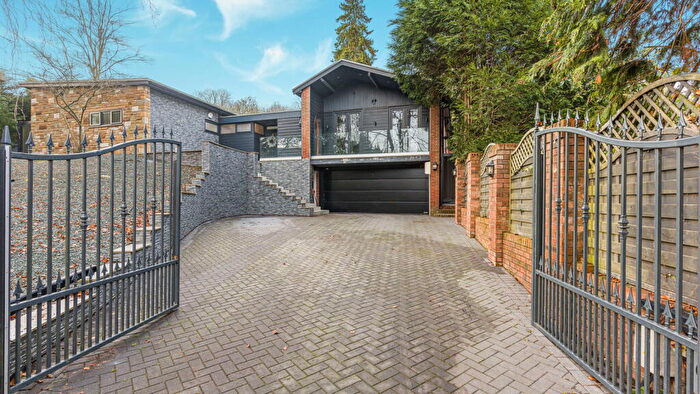
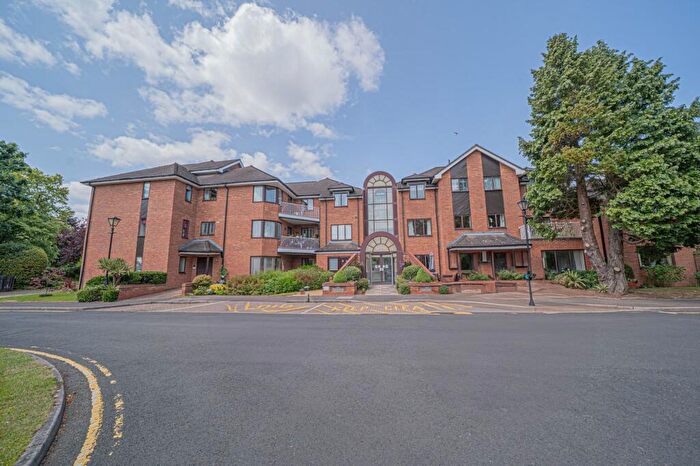
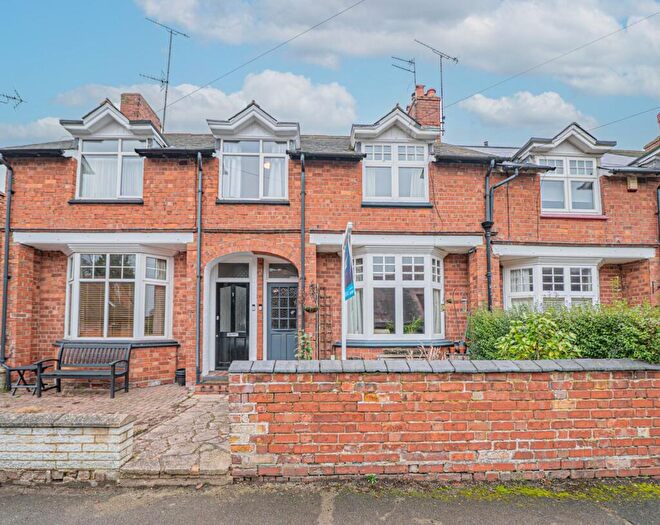
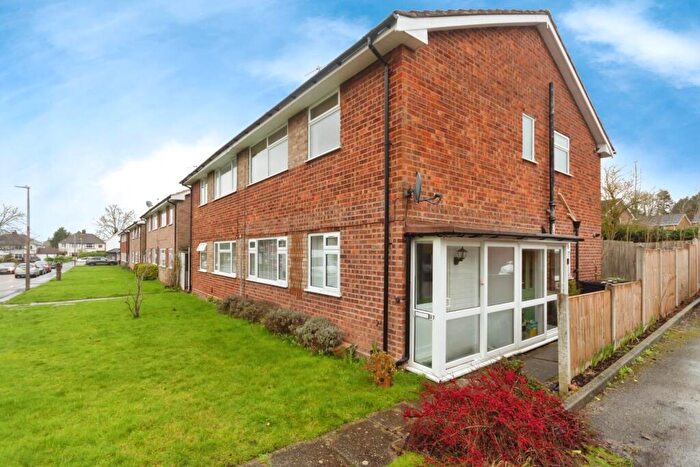
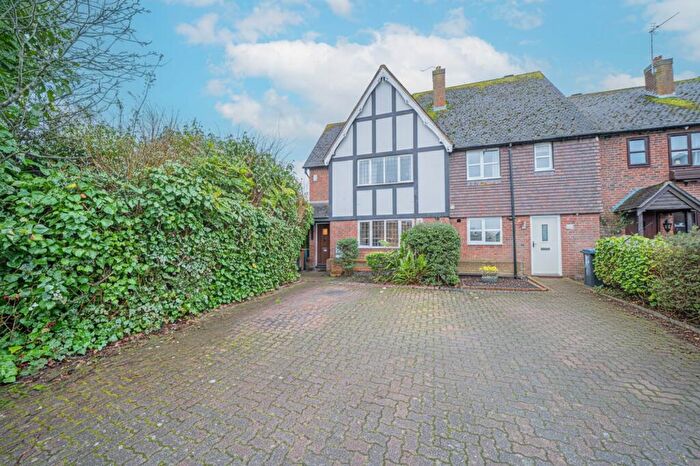
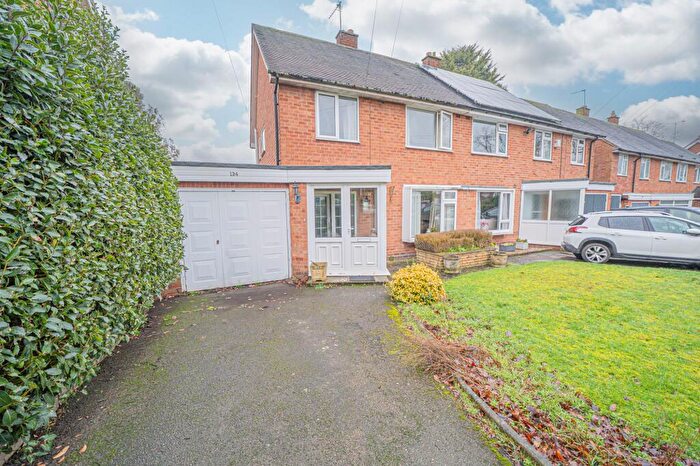
Houses for sale & to rent in Bickenhill, Solihull
House Prices in Bickenhill
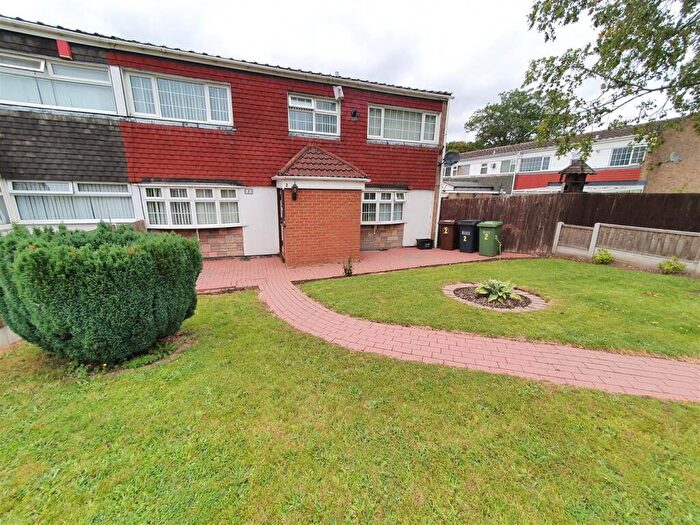
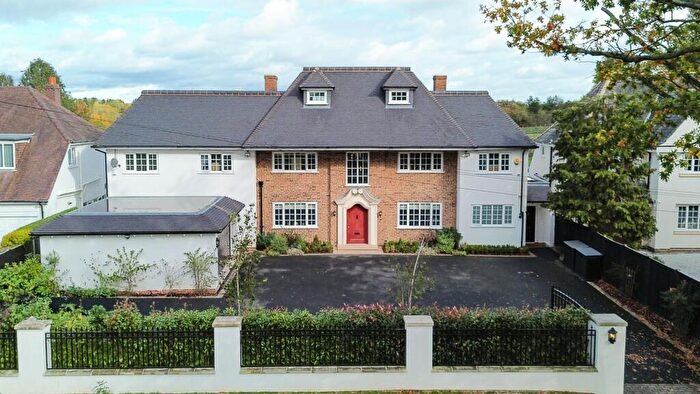
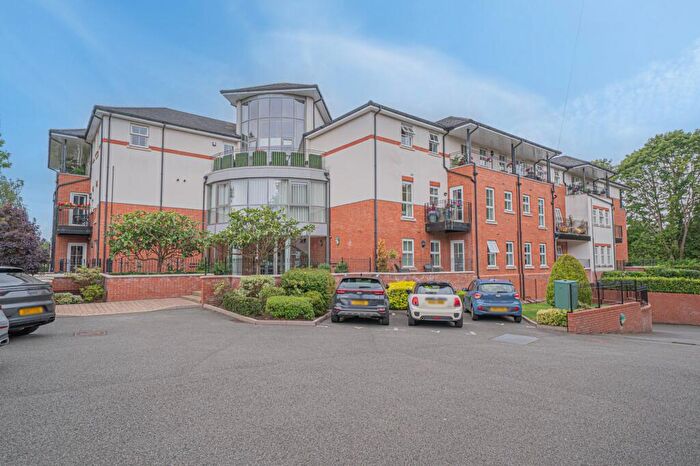
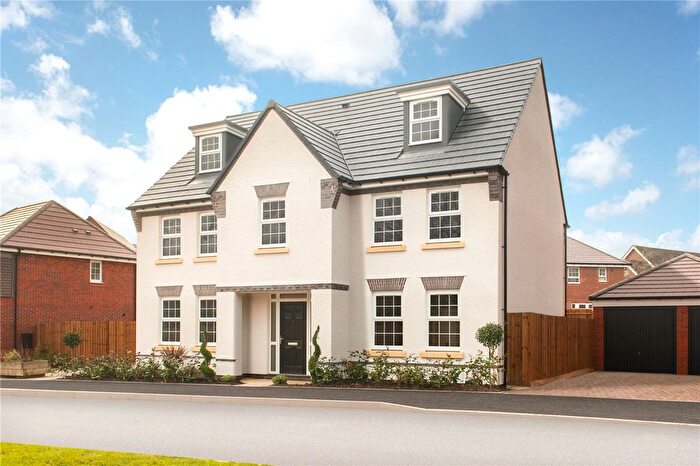
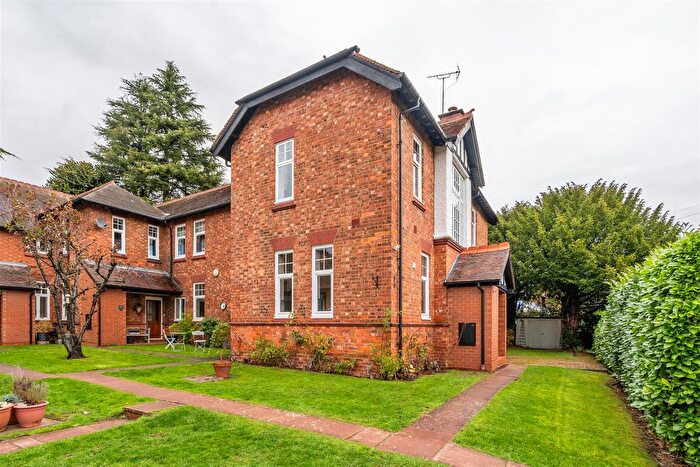
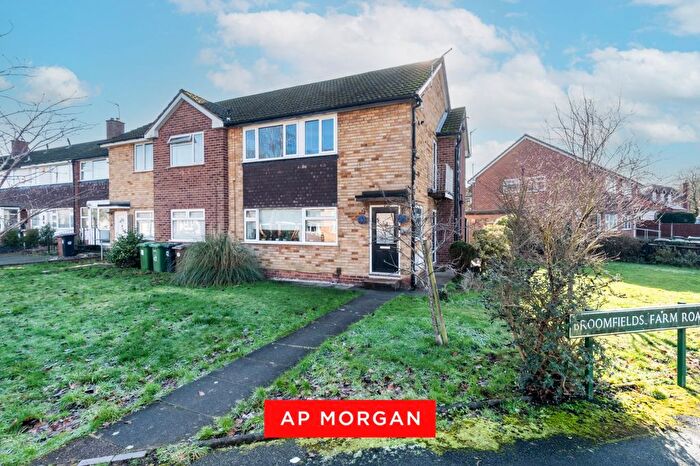
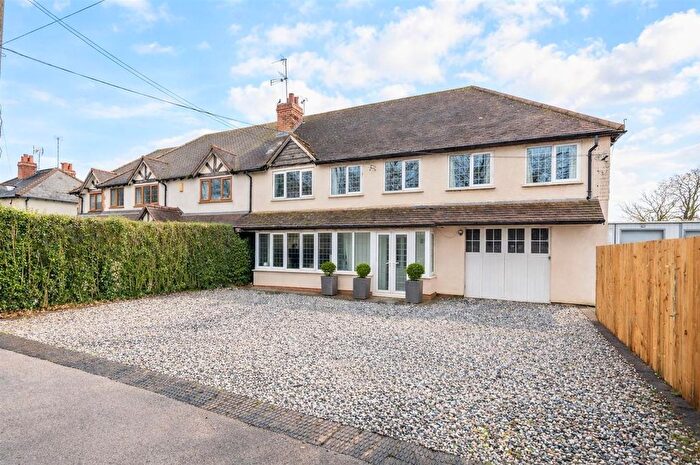
Properties in Bickenhill have an average house price of £543,084.00 and had 125 Property Transactions within the last 3 years¹.
Bickenhill is an area in Solihull, Solihull with 1,422 households², where the most expensive property was sold for £2,600,000.00.
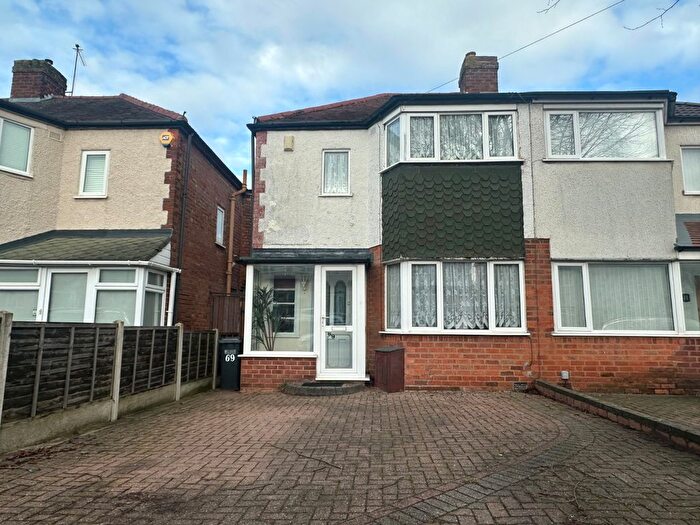
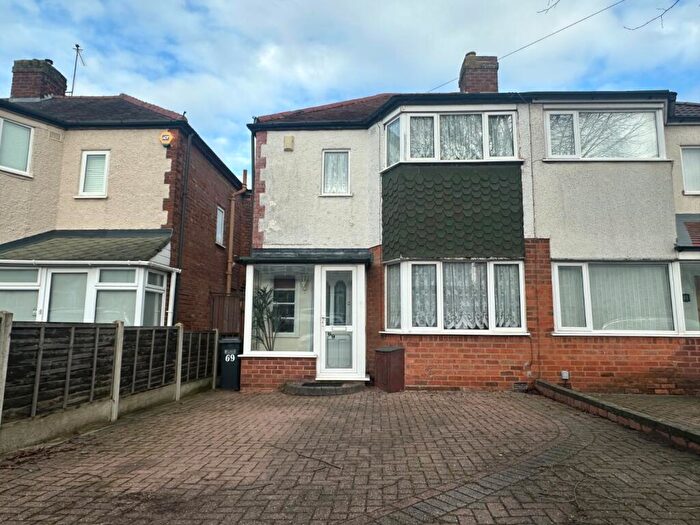
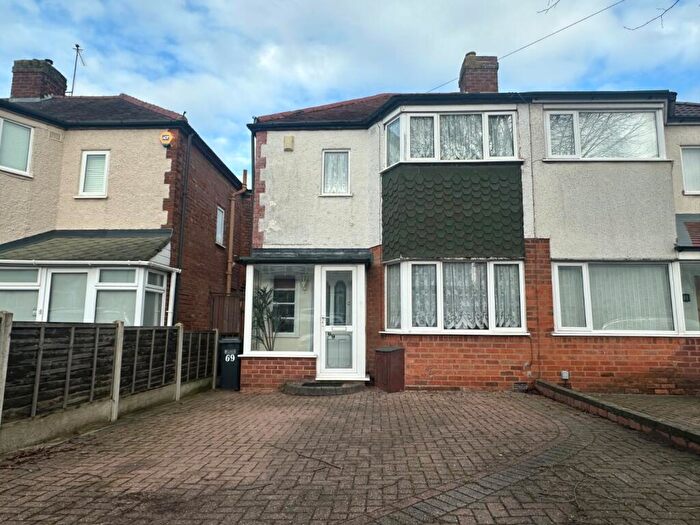
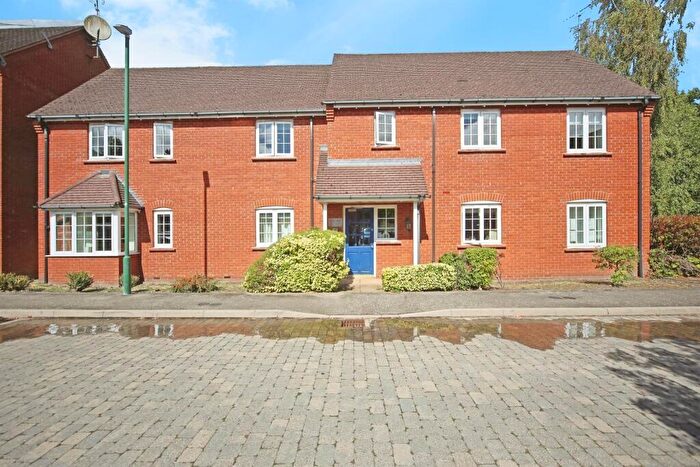
Properties for sale in Bickenhill
Roads and Postcodes in Bickenhill
Navigate through our locations to find the location of your next house in Bickenhill, Solihull for sale or to rent.
| Streets | Postcodes |
|---|---|
| Appletree Close | B91 2TQ |
| Arden Court | B92 0BH |
| Barbers Lane | B92 0DH |
| Barston Lane | B91 2SX B92 0HR B92 0HS B92 0JJ B92 0JN B92 0JP B92 0JU B92 0JY B92 0JZ B91 2TA |
| Belle Vue Terrace | B92 0AR |
| Bellemere Road | B92 0AN B92 0AP |
| Berry Hall Lane | B91 2RY |
| Bickenhill Lane | B92 0DE B92 0DF |
| Bransford Rise | B91 2TP |
| Brook Green Lane | B92 0JW |
| Butchers Road | B92 0AB |
| Carters Close | B37 7AX |
| Catherine De Barnes Lane | B92 0DB B92 0DJ |
| Catherines Close | B91 2SZ |
| Church Lane | B92 0DN B92 0DT |
| Clock Lane | B92 0DX |
| Corbetts Close | B92 0BU |
| Coventry Road | B92 0DY B92 0EB B92 0EH B92 0EJ B92 0HH |
| Damson Parkway | B92 8PS |
| Diddington Lane | B92 0BY B92 0BZ B92 0FE |
| Eastcote Lane | B92 0AS B92 0JE |
| Eastway | B92 0EP |
| Elm Lodge | B92 0BG |
| Elm Tree Rise | B92 0AG |
| Engine Mews | B92 0AZ |
| Fentham Close | B92 0BE |
| Fentham Green | B92 0DD |
| Fentham Road | B92 0AY B92 0BB |
| Fiddlers Green | B92 0EZ |
| Field Lane | B91 2RT |
| Foxley Drive | B91 2TX |
| Friday Lane | B92 0HY B92 0HT B92 0HZ |
| Gables Close | B92 9EE |
| Hampton Gate | B92 0JF |
| Hampton Green | B92 0BW B92 0BX |
| Hampton Lane | B91 2PZ B91 2QD B91 2RR B91 2RS B91 2TD B91 2TJ B92 0JB B92 0JD |
| Hampton Road | B93 0PA |
| Henwood Lane | B91 2SY B91 2TH |
| High Street | B92 0AA B92 0AD B92 0AE |
| Hob Lane | B92 0JS B92 0JT |
| Knowle Road | B92 0JA B92 0JG |
| Lapwing Drive | B92 0BF |
| Lugtrout Lane | B91 2RU B91 2RX B91 2TL B91 2TN B91 2TW |
| Marsh House Farm Lane | B92 0LB |
| Marsh Lane | B92 0AH B92 0AJ B92 0AX B92 0EW |
| Meadow Drive | B92 0BD |
| Meriden Road | B92 0BL B92 0BS B92 0BT B92 0LT |
| Middle Bickenhill Lane | B92 0HJ |
| Nesfield Grove | B92 0BQ |
| Oak Lane | B92 0JR |
| Oakfields Way | B91 2TR |
| Old Damson Lane | B92 9ED |
| Old Station Road | B92 0EY B92 0HA B92 0HE B92 0HF B92 0HQ B92 0HB B92 0HG |
| Peace Court | B92 0AW |
| Peel Close | B92 0AL |
| Pitt Lane | B92 0DS |
| Ravenshaw Way | B91 2TB |
| Ryton End Lane | B92 0LA |
| Shadow Brook Lane | B92 0DL B92 0DQ B92 0DG B92 0EN |
| Shadowbrook Lane | B92 0DU |
| Solihull Road | B92 0AT B92 0EU B92 0EX B92 0ES B92 0ET B92 0FD |
| St Peters Lane | B92 0DP B92 0DR B92 0ED |
| Station Road | B92 0BJ |
| The Crescent | B92 0BN B92 0BP |
| The Grove | B92 0HD |
| Walsal End Lane | B92 0HU B92 0HX |
| Wellmeadow Grove | B92 0AU |
| Wood Lane | B92 0JL |
Transport near Bickenhill
-
Hampton-In-Arden Station
-
Birmingham International Station
-
Solihull Station
-
Widney Manor Station
-
Marston Green Station
-
Berkswell Station
-
Olton Station
-
Dorridge Station
-
Acocks Green Station
-
Lea Hall Station
- FAQ
- Price Paid By Year
- Property Type Price
Frequently asked questions about Bickenhill
What is the average price for a property for sale in Bickenhill?
The average price for a property for sale in Bickenhill is £543,084. This amount is 33% higher than the average price in Solihull. There are 3,084 property listings for sale in Bickenhill.
What streets have the most expensive properties for sale in Bickenhill?
The streets with the most expensive properties for sale in Bickenhill are Meriden Road at an average of £1,271,250, The Crescent at an average of £1,150,000 and Station Road at an average of £1,025,000.
What streets have the most affordable properties for sale in Bickenhill?
The streets with the most affordable properties for sale in Bickenhill are Arden Court at an average of £175,000, Foxley Drive at an average of £248,000 and Meadow Drive at an average of £248,850.
Which train stations are available in or near Bickenhill?
Some of the train stations available in or near Bickenhill are Hampton-In-Arden, Birmingham International and Solihull.
Property Price Paid in Bickenhill by Year
The average sold property price by year was:
| Year | Average Sold Price | Price Change |
Sold Properties
|
|---|---|---|---|
| 2025 | £467,062 | -20% |
40 Properties |
| 2024 | £562,612 | -6% |
45 Properties |
| 2023 | £597,137 | 2% |
40 Properties |
| 2022 | £584,365 | -2% |
62 Properties |
| 2021 | £597,841 | 5% |
84 Properties |
| 2020 | £570,559 | 8% |
53 Properties |
| 2019 | £522,975 | 10% |
64 Properties |
| 2018 | £472,344 | 1% |
66 Properties |
| 2017 | £469,054 | 17% |
73 Properties |
| 2016 | £391,651 | -4% |
100 Properties |
| 2015 | £407,213 | 10% |
59 Properties |
| 2014 | £366,743 | -21% |
56 Properties |
| 2013 | £442,587 | 18% |
60 Properties |
| 2012 | £364,152 | -19% |
46 Properties |
| 2011 | £434,866 | 4% |
54 Properties |
| 2010 | £417,119 | 7% |
46 Properties |
| 2009 | £386,798 | 12% |
36 Properties |
| 2008 | £339,166 | 7% |
33 Properties |
| 2007 | £316,093 | -16% |
97 Properties |
| 2006 | £365,711 | 1% |
105 Properties |
| 2005 | £361,098 | 12% |
55 Properties |
| 2004 | £316,954 | 7% |
68 Properties |
| 2003 | £293,649 | 25% |
63 Properties |
| 2002 | £221,056 | 1% |
84 Properties |
| 2001 | £218,200 | 4% |
78 Properties |
| 2000 | £209,187 | 17% |
75 Properties |
| 1999 | £173,590 | -1% |
81 Properties |
| 1998 | £175,313 | 9% |
61 Properties |
| 1997 | £159,771 | 10% |
144 Properties |
| 1996 | £143,631 | 3% |
78 Properties |
| 1995 | £139,435 | - |
65 Properties |
Property Price per Property Type in Bickenhill
Here you can find historic sold price data in order to help with your property search.
The average Property Paid Price for specific property types in the last three years are:
| Property Type | Average Sold Price | Sold Properties |
|---|---|---|
| Semi Detached House | £480,627.00 | 26 Semi Detached Houses |
| Detached House | £786,072.00 | 55 Detached Houses |
| Terraced House | £369,546.00 | 16 Terraced Houses |
| Flat | £222,946.00 | 28 Flats |

