
Houses for sale & to rent in Meriden, Solihull
House Prices in Meriden
Properties in Meriden have an average house price of £441k and had 5 Property Transactions within the last 3 years¹.
Meriden is an area in Solihull, Solihull with 98 households², where the most expensive property was sold for £960k.
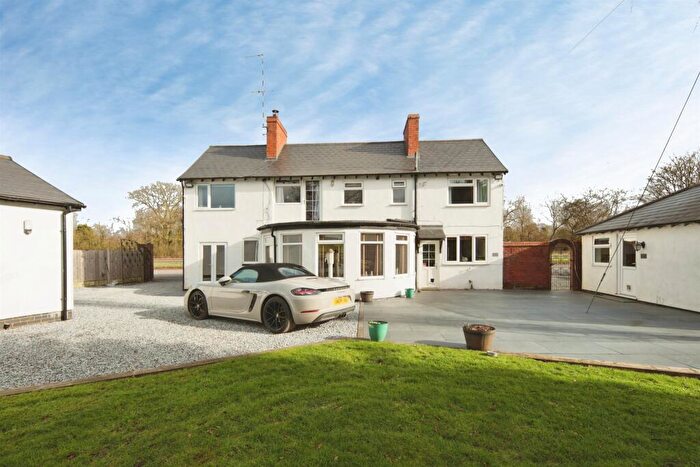
Properties for sale in Meriden
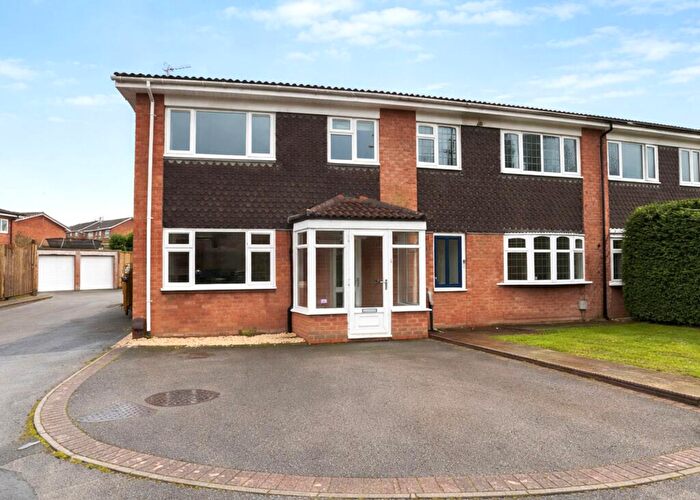
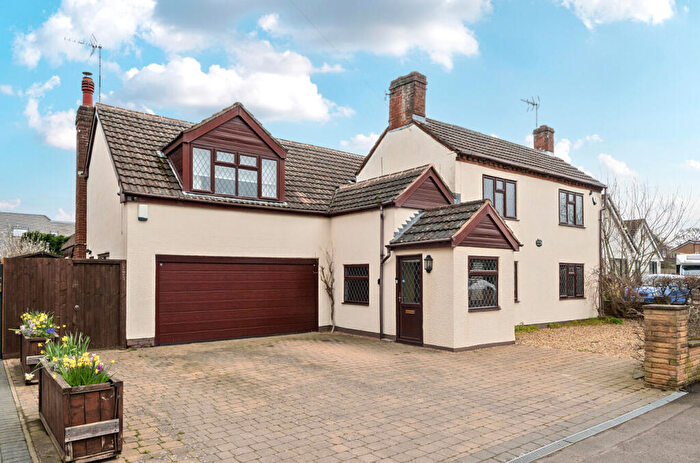
![]()
If you are looking to sell your house, let it out, or receive a property valuation, an expert can help you.
Click the button below to get started.

Roads and Postcodes in Meriden
Navigate through our locations to find the location of your next house in Meriden, Solihull for sale or to rent.
| Streets | Postcodes |
|---|---|
| Barston Lane | B92 0LD |
| Bradnocks Marsh Lane | B92 0LH B92 0LL |
| Fen End Road West | B93 0AN |
| Kenilworth Road | B92 0LR B92 0LS B92 0LW B92 0LX B92 0LN B92 0LP B92 0LU B93 0AL |
| Marsh House Farm Lane | B92 0LJ |
| Marsh Lane | B92 0LG B92 0LQ |
Transport near Meriden
-
 Hampton-In-Arden Station
 -
Berkswell Station
-
Birmingham International Station
-
Tile Hill Station
-
Dorridge Station
-
Widney Manor Station
-
Solihull Station
- FAQ
- Price Paid By Year
- Property Type Price
Frequently asked questions about Meriden
What is the average price for a property for sale in Meriden?
The average price for a property for sale in Meriden is £440,906. This amount is 8% higher than the average price in Solihull. There are 338 property listings for sale in Meriden.
Which train stations are available in or near Meriden?
Some of the train stations available in or near Meriden are Hampton-In-Arden, Berkswell and Birmingham International.
Property Price Paid in Meriden by Year
The average sold property price by year was:
| Year | Average Sold Price | Price Change |
Sold Properties
|
|---|---|---|---|
| 2025 | £230,000 | -44% |
1 Property |
| 2024 | £332,265 | -97% |
2 Properties |
| 2023 | £655,000 | -39% |
2 Properties |
| 2022 | £913,500 | 45% |
2 Properties |
| 2021 | £500,000 | 6% |
1 Property |
| 2020 | £470,000 | 13% |
1 Property |
| 2019 | £407,500 | 29% |
2 Properties |
| 2018 | £288,000 | -39% |
1 Property |
| 2017 | £400,000 | -19% |
1 Property |
| 2016 | £475,833 | -13% |
3 Properties |
| 2015 | £536,000 | 41% |
1 Property |
| 2014 | £313,666 | -19% |
3 Properties |
| 2013 | £371,833 | -3% |
3 Properties |
| 2012 | £381,500 | 11% |
4 Properties |
| 2011 | £340,000 | 5% |
1 Property |
| 2010 | £322,666 | -52% |
3 Properties |
| 2008 | £489,249 | 27% |
2 Properties |
| 2007 | £357,500 | -14% |
2 Properties |
| 2006 | £408,333 | 25% |
3 Properties |
| 2005 | £305,666 | -45% |
3 Properties |
| 2003 | £442,500 | 28% |
2 Properties |
| 2001 | £320,000 | 7% |
1 Property |
| 2000 | £298,333 | -61% |
3 Properties |
| 1999 | £480,000 | 68% |
1 Property |
| 1998 | £152,500 | -37% |
2 Properties |
| 1997 | £208,166 | 76% |
3 Properties |
| 1995 | £50,000 | - |
1 Property |
Property Price per Property Type in Meriden
Here you can find historic sold price data in order to help with your property search.
The average Property Paid Price for specific property types in the last three years are:
| Property Type | Average Sold Price | Sold Properties |
|---|---|---|
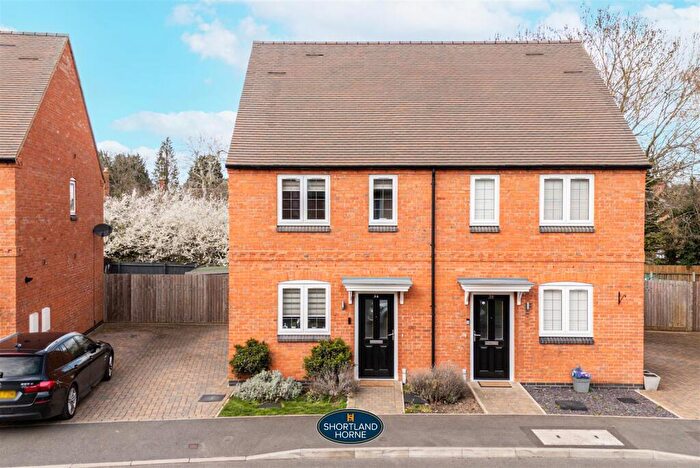
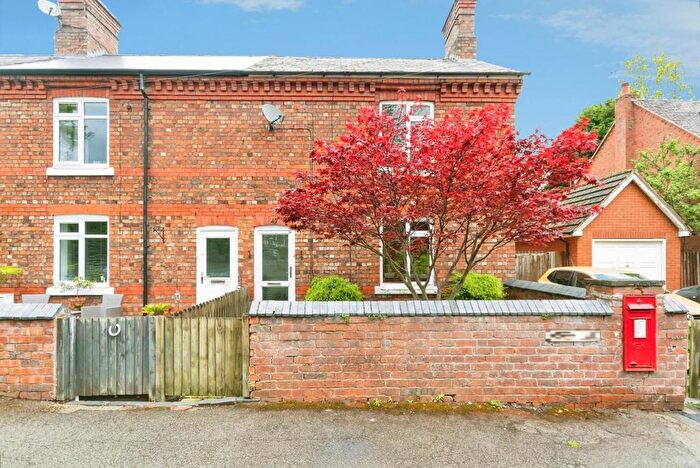
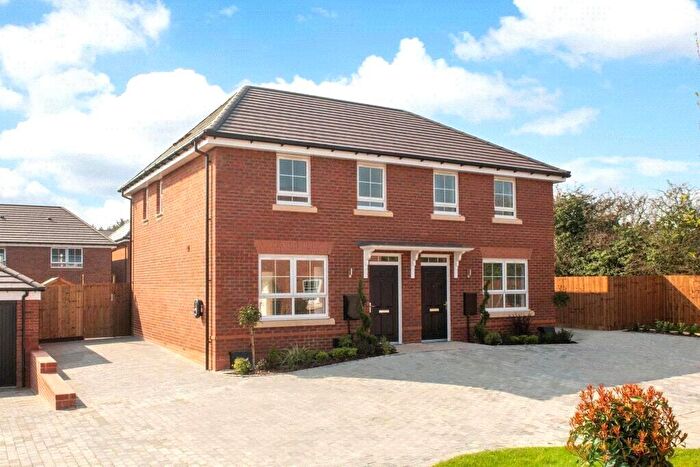
| Semi Detached House | £298,176.00 | 3 Semi Detached Houses |
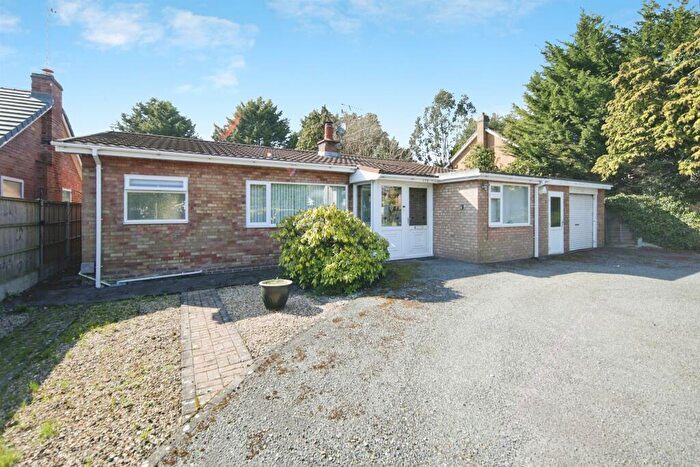
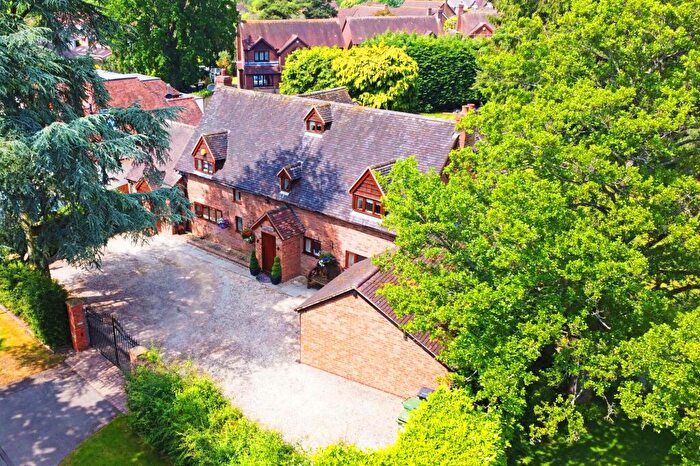
| Detached House | £655,000.00 | 2 Detached Houses |