
Houses for sale & to rent in Knowle, Solihull
House Prices in Knowle
Properties in Knowle have an average house price of £606k and had 415 Property Transactions within the last 3 years¹.
Knowle is an area in Solihull, Solihull with 4,284 households², where the most expensive property was sold for £15M.
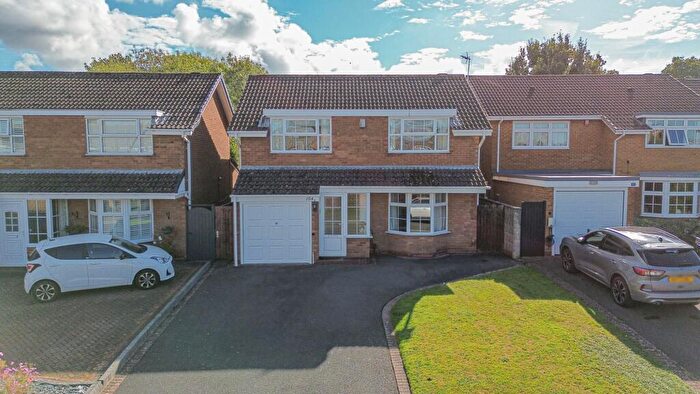
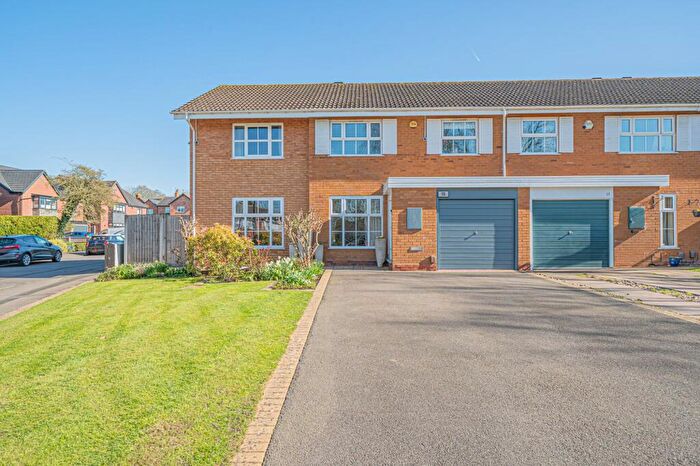
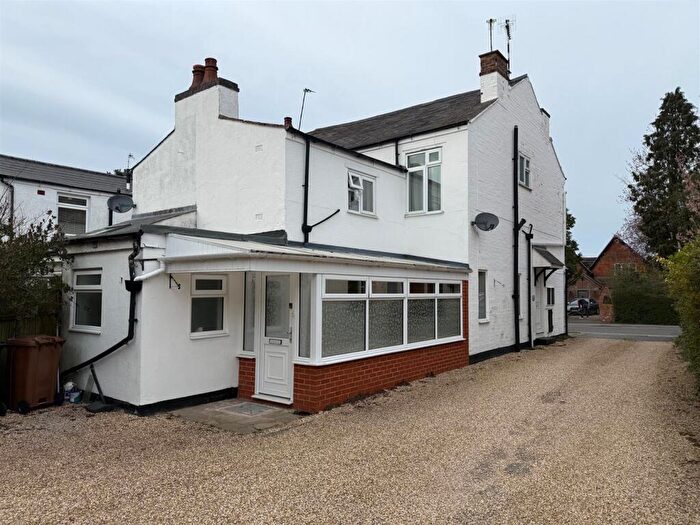
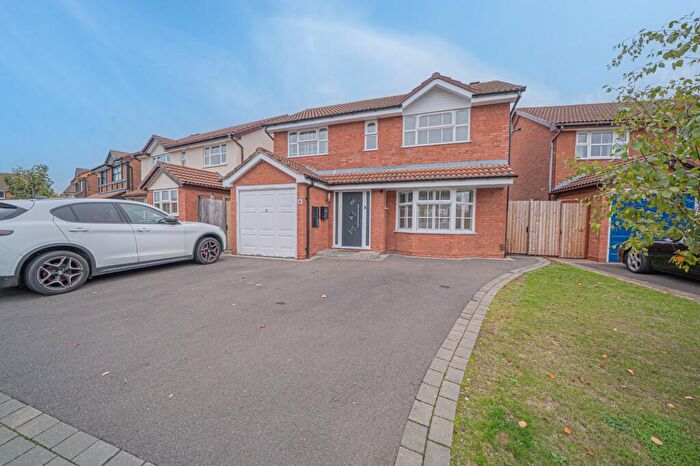
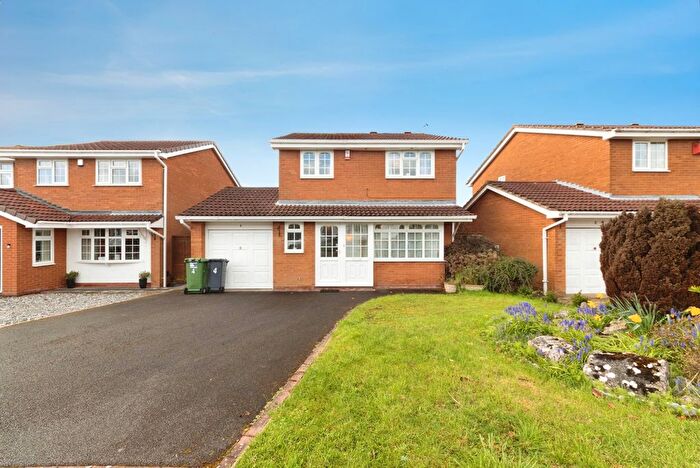
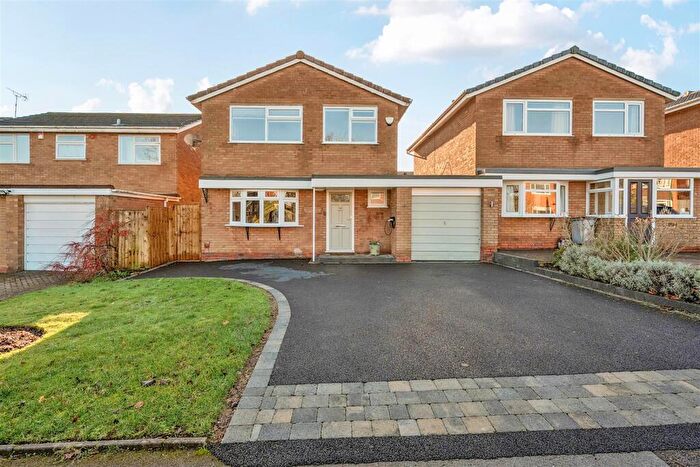
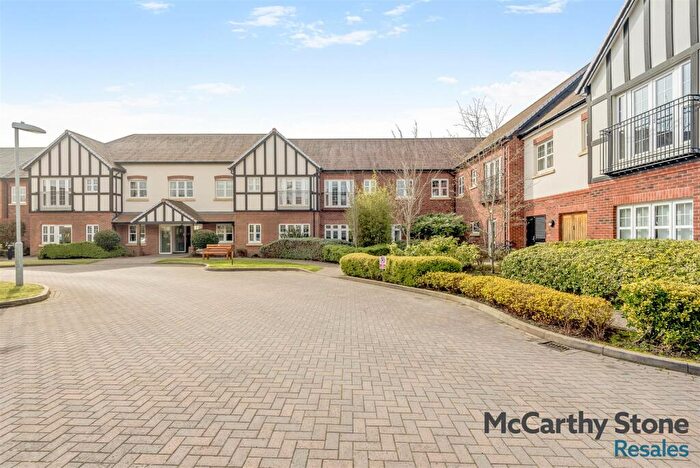
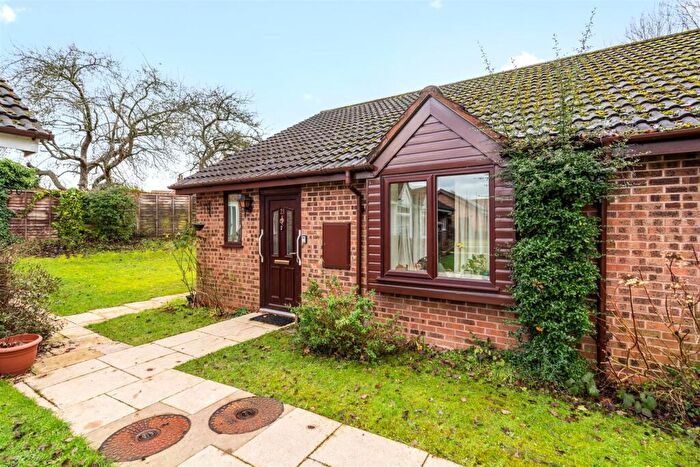
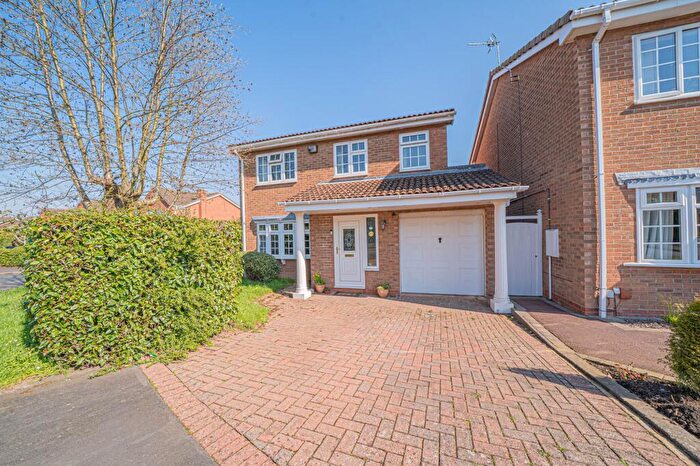
Properties for sale in Knowle
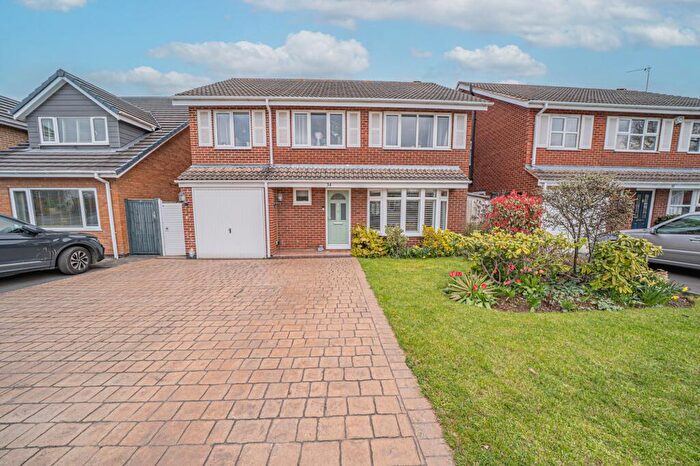
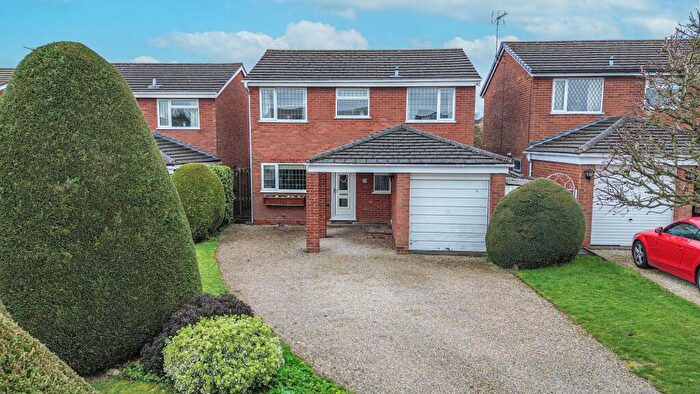
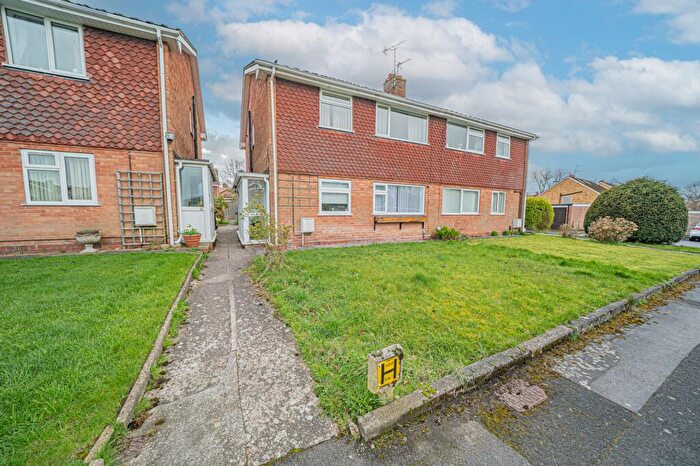
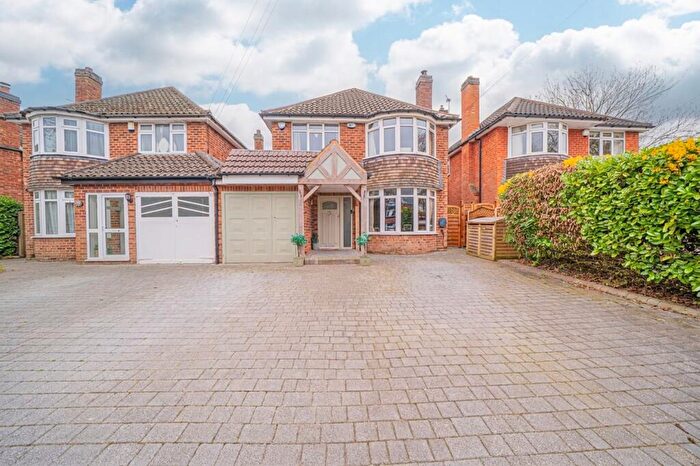
![]()
If you are looking to sell your house, let it out, or receive a property valuation, an expert can help you.
Click the button below to get started.


Roads and Postcodes in Knowle
Navigate through our locations to find the location of your next house in Knowle, Solihull for sale or to rent.
Transport near Knowle

- FAQ
- Price Paid By Year
- Property Type Price
Frequently asked questions about Knowle
What is the average price for a property for sale in Knowle?
The average price for a property for sale in Knowle is £605,851. This amount is 48% higher than the average price in Solihull. There are 5,193 property listings for sale in Knowle.
What streets have the most expensive properties for sale in Knowle?
The streets with the most expensive properties for sale in Knowle are Lady Byron Lane at an average of £1,895,666, Grove Road at an average of £1,368,750 and Warwick Road at an average of £1,064,535.
What streets have the most affordable properties for sale in Knowle?
The streets with the most affordable properties for sale in Knowle are Downing Close at an average of £128,900, Mockley Wood Road at an average of £220,750 and Pool Meadow Close at an average of £237,666.
Which train stations are available in or near Knowle?
Some of the train stations available in or near Knowle are Dorridge, Widney Manor and Solihull.
Property Price Paid in Knowle by Year
The average sold property price by year was:
| Year | Average Sold Price | Price Change |
Sold Properties
|
|---|---|---|---|
| 2026 | £631,000 | 7% |
4 Properties |
| 2025 | £585,255 | -9% |
133 Properties |
| 2024 | £639,505 | 8% |
140 Properties |
| 2023 | £590,829 | 5% |
138 Properties |
| 2022 | £559,423 | 8% |
196 Properties |
| 2021 | £516,808 | 4% |
240 Properties |
| 2020 | £495,209 | -4% |
157 Properties |
| 2019 | £516,398 | 8% |
164 Properties |
| 2018 | £473,524 | - |
201 Properties |
| 2017 | £473,349 | 9% |
205 Properties |
| 2016 | £432,126 | 4% |
182 Properties |
| 2015 | £415,498 | 11% |
251 Properties |
| 2014 | £370,857 | 7% |
209 Properties |
| 2013 | £344,637 | -2% |
161 Properties |
| 2012 | £351,274 | -4% |
135 Properties |
| 2011 | £364,059 | 5% |
134 Properties |
| 2010 | £346,297 | 10% |
144 Properties |
| 2009 | £311,923 | -10% |
149 Properties |
| 2008 | £341,995 | -9% |
120 Properties |
| 2007 | £373,709 | 11% |
210 Properties |
| 2006 | £331,021 | 3% |
224 Properties |
| 2005 | £321,663 | 8% |
163 Properties |
| 2004 | £294,950 | -4% |
219 Properties |
| 2003 | £305,583 | 20% |
171 Properties |
| 2002 | £244,276 | 19% |
240 Properties |
| 2001 | £198,728 | 4% |
215 Properties |
| 2000 | £190,141 | 22% |
218 Properties |
| 1999 | £148,108 | 1% |
234 Properties |
| 1998 | £146,425 | 15% |
171 Properties |
| 1997 | £124,204 | 1% |
261 Properties |
| 1996 | £123,087 | - |
224 Properties |
| 1995 | £123,043 | - |
208 Properties |
Property Price per Property Type in Knowle
Here you can find historic sold price data in order to help with your property search.
The average Property Paid Price for specific property types in the last three years are:
| Property Type | Average Sold Price | Sold Properties |
|---|---|---|
| Flat | £295,860.00 | 94 Flats |
| Semi Detached House | £532,343.00 | 85 Semi Detached Houses |
| Detached House | £871,533.00 | 181 Detached Houses |
| Terraced House | £374,919.00 | 55 Terraced Houses |