
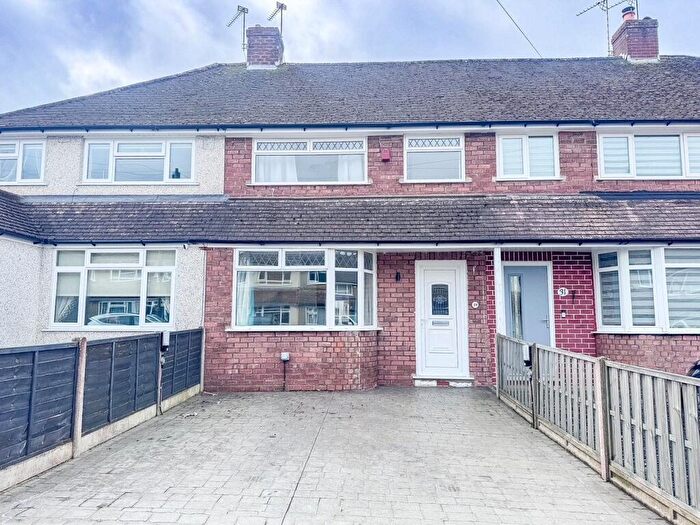
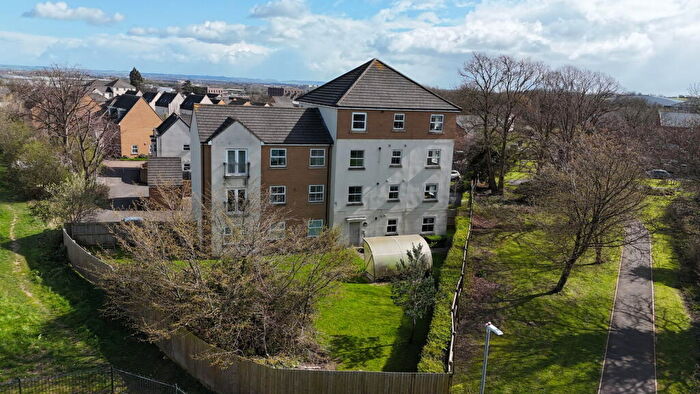
Houses for sale & to rent in BS34 5LH, Coniston Road, Patchway, Bristol
House Prices in BS34 5LH, Coniston Road, Patchway
Properties in BS34 5LH have no sales history available within the last 3 years. BS34 5LH is a postcode in Coniston Road located in Patchway, an area in Bristol, South Gloucestershire, with 10 households².
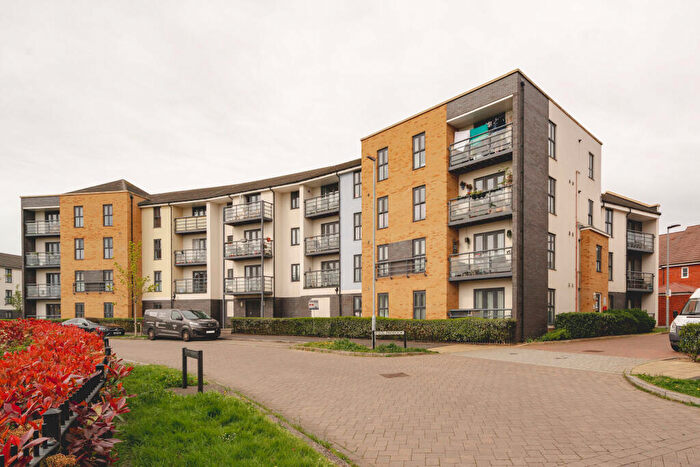
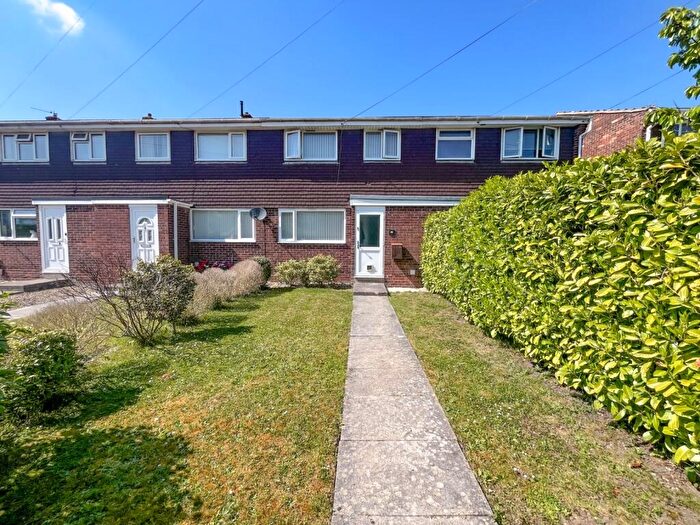
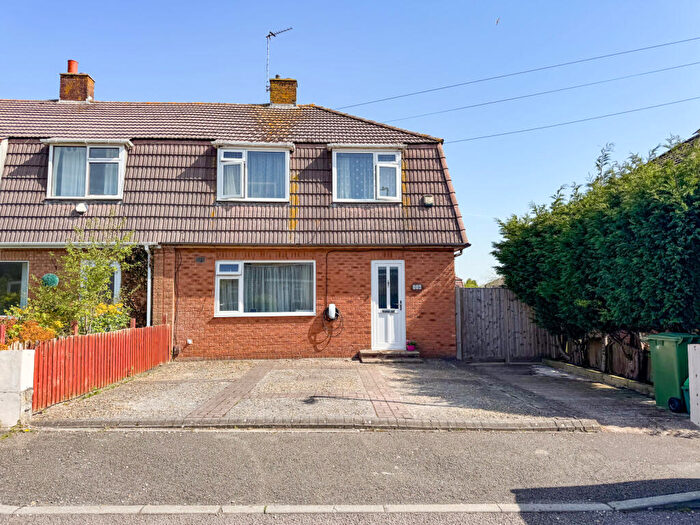
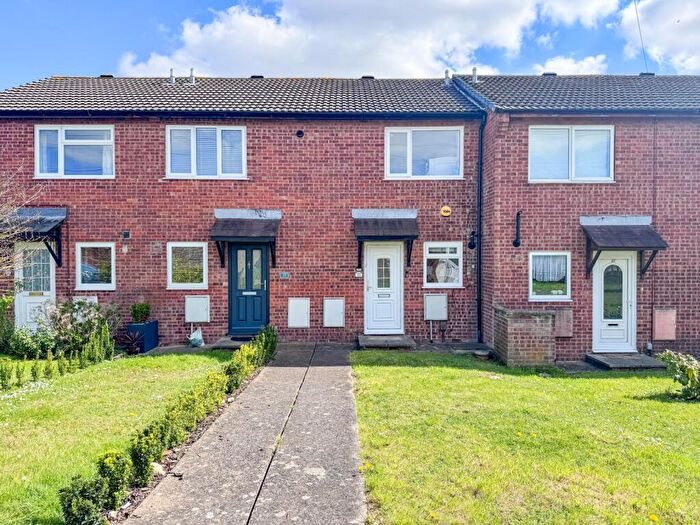
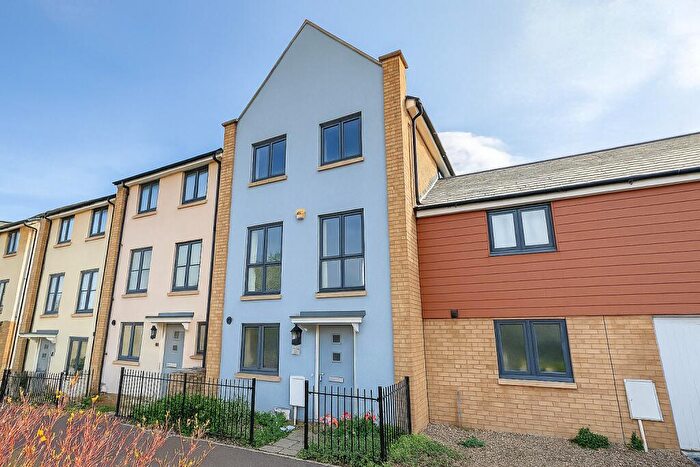
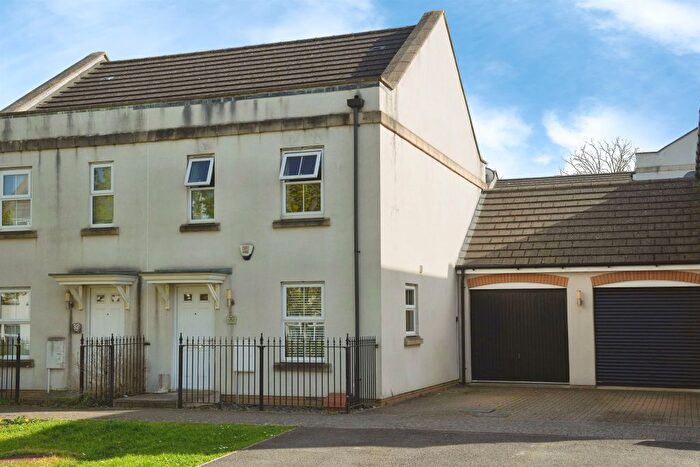
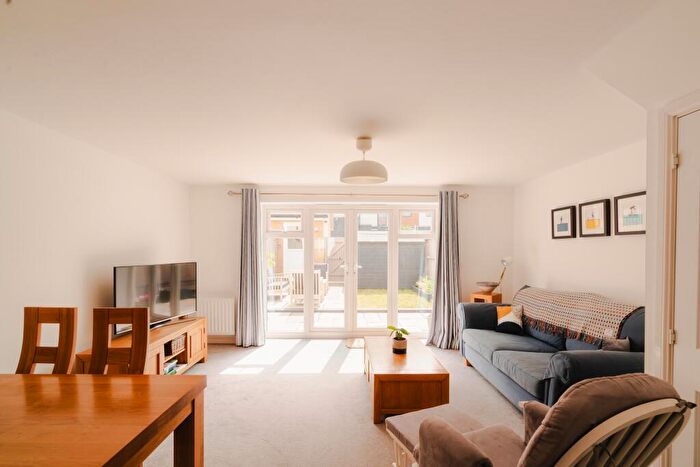
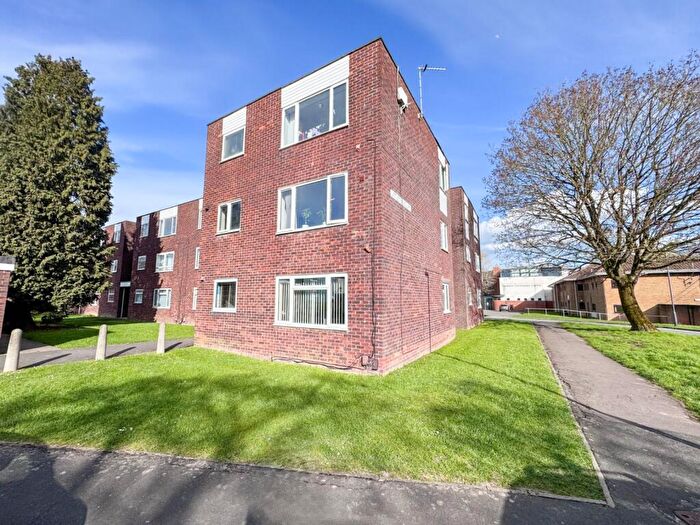
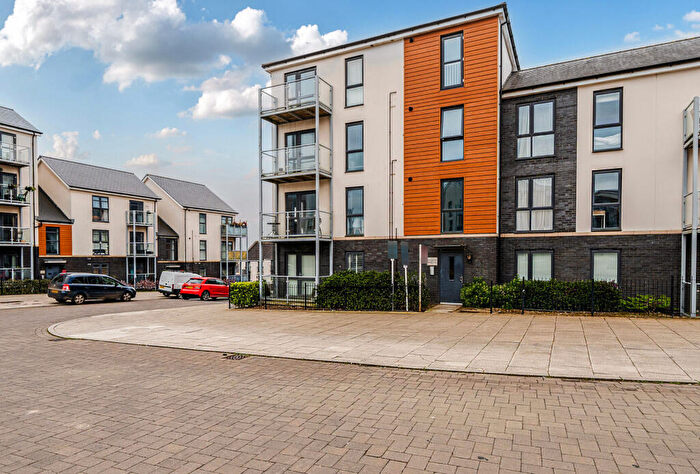
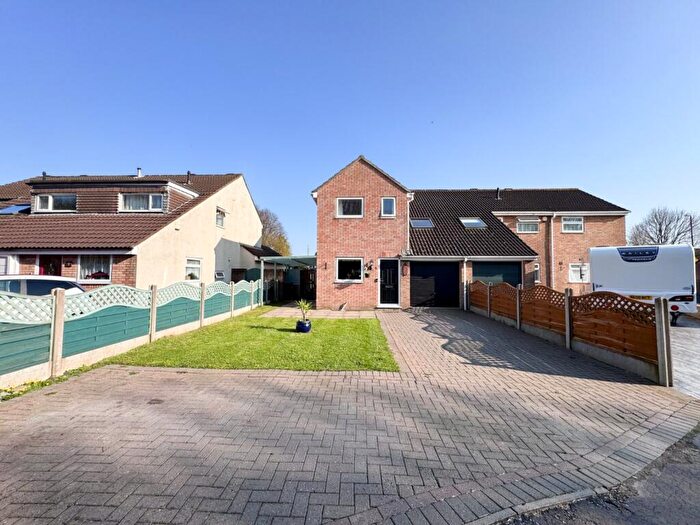
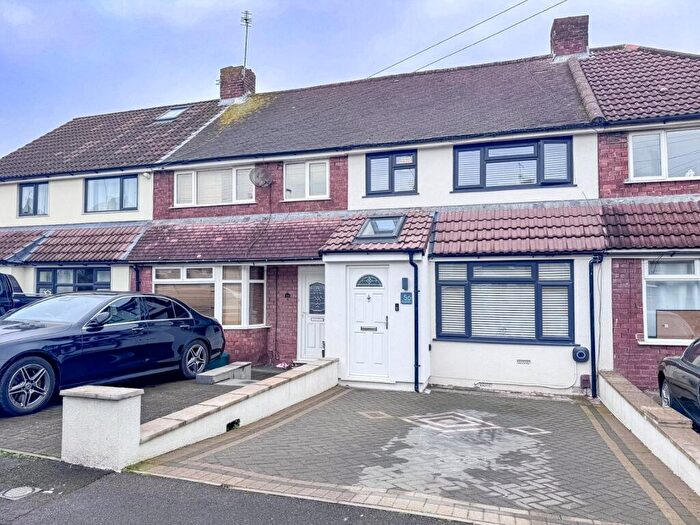
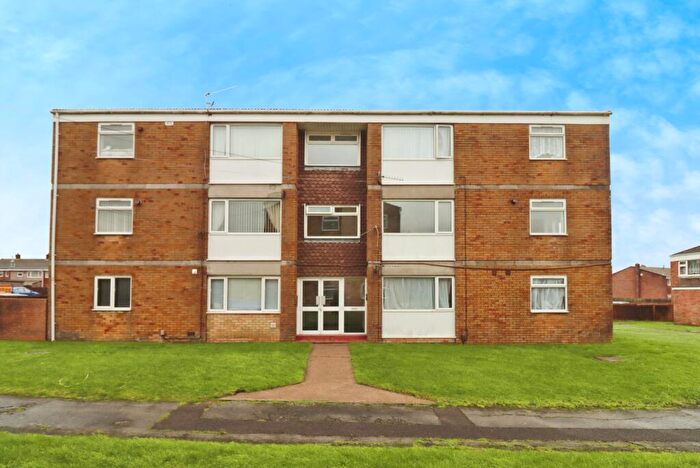
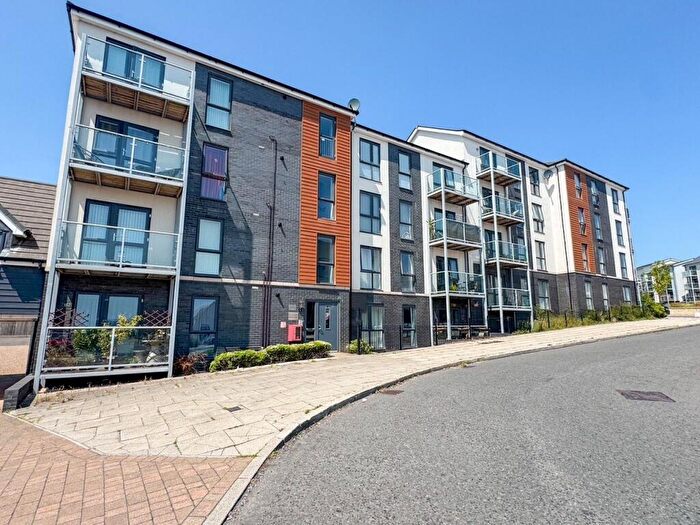
Properties for sale near BS34 5LH, Coniston Road
![]()
If you are looking to sell your house, let it out, or receive a property valuation, an expert can help you.
Click the button below to get started.


Price Paid in Coniston Road, BS34 5LH, Patchway
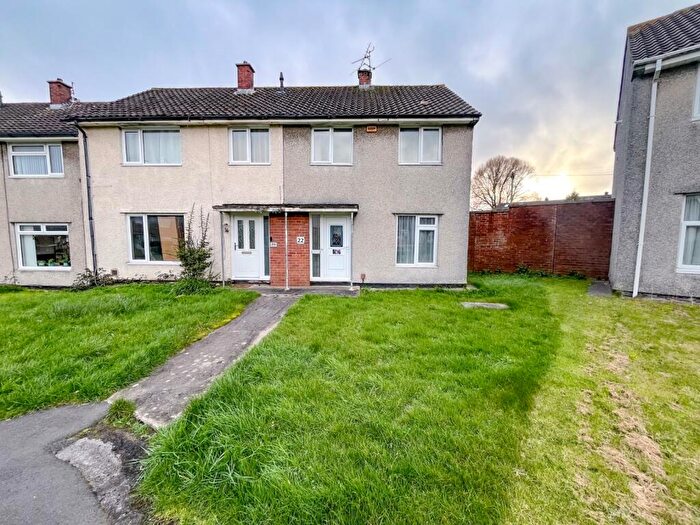
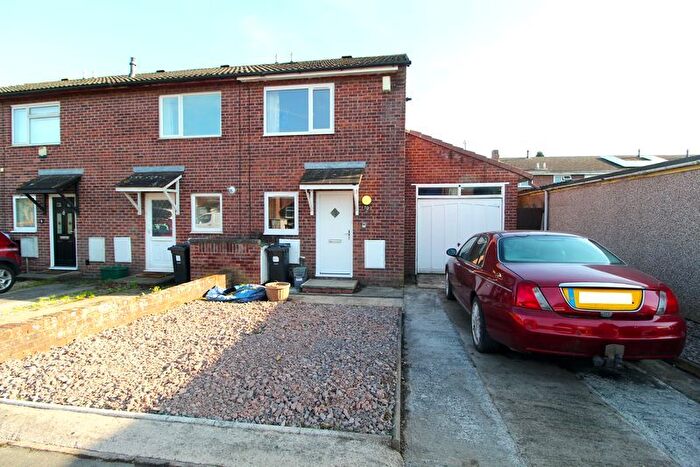
299 Coniston Road, BS34 5LH, Patchway Bristol
Property 299 has been sold 3 times. The last time it was sold was in 16/11/2022 and the sold price was £310,000.00.
This terraced house, sold as a freehold on 16/11/2022, is a 77 sqm mid-terrace house with an EPC rating of D.
| Date | Price | Property Type | Tenure | Classification |
|---|---|---|---|---|
| 16/11/2022 | £310,000.00 | Terraced House | freehold | Established Building |
| 17/11/2017 | £221,000.00 | Terraced House | freehold | Established Building |
| 31/05/2016 | £181,500.00 | Terraced House | freehold | Established Building |
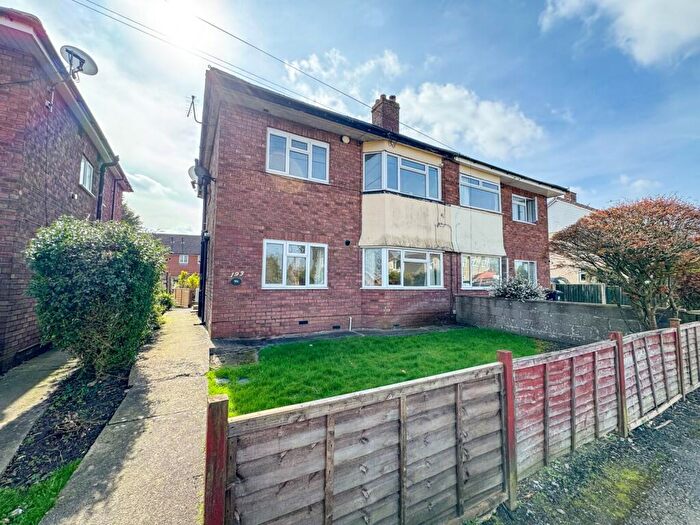
295 Coniston Road, BS34 5LH, Patchway Bristol
Property 295 has been sold 3 times. The last time it was sold was in 22/03/2019 and the sold price was £220,000.00.
This terraced house, sold as a freehold on 22/03/2019, is a 90 sqm mid-terrace house with an EPC rating of D.
| Date | Price | Property Type | Tenure | Classification |
|---|---|---|---|---|
| 22/03/2019 | £220,000.00 | Terraced House | freehold | Established Building |
| 28/02/2011 | £120,000.00 | Terraced House | freehold | Established Building |
| 13/06/1997 | £40,500.00 | Terraced House | freehold | Established Building |
Postcodes in Coniston Road, Patchway
Navigate through other locations in Coniston Road, Patchway, Bristol to see more property listings for sale or to rent.
Transport near BS34 5LH, Coniston Road

House price paid reports for BS34 5LH, Coniston Road
Click on the buttons below to see price paid reports by year or property price:
- Price Paid By Year
Property Price Paid in BS34 5LH, Coniston Road by Year
The average sold property price by year was:
| Year | Average Sold Price | Price Change |
Sold Properties
|
|---|---|---|---|
| 2022 | £310,000 | 29% |
1 Property |
| 2019 | £220,000 | -0,5% |
1 Property |
| 2017 | £221,000 | 18% |
1 Property |
| 2016 | £181,500 | 34% |
1 Property |
| 2011 | £120,000 | 66% |
1 Property |
| 1997 | £40,500 | - |
1 Property |