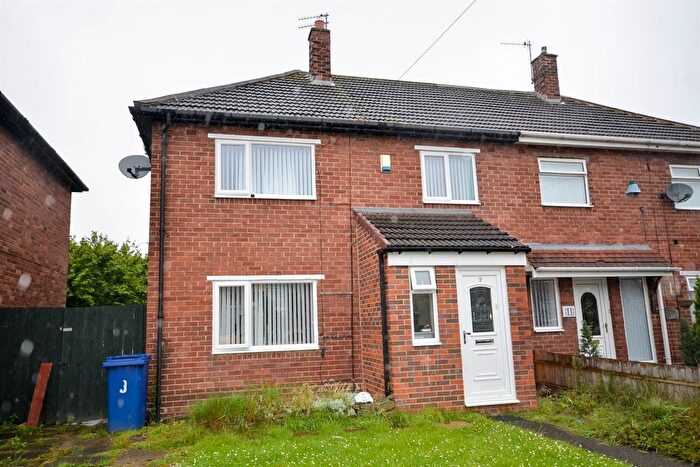
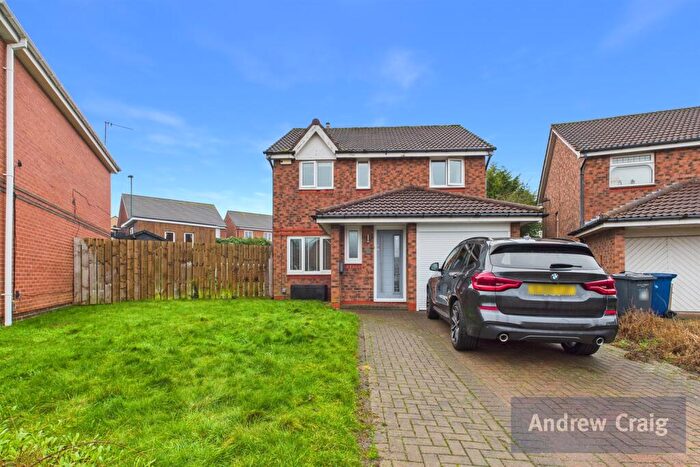
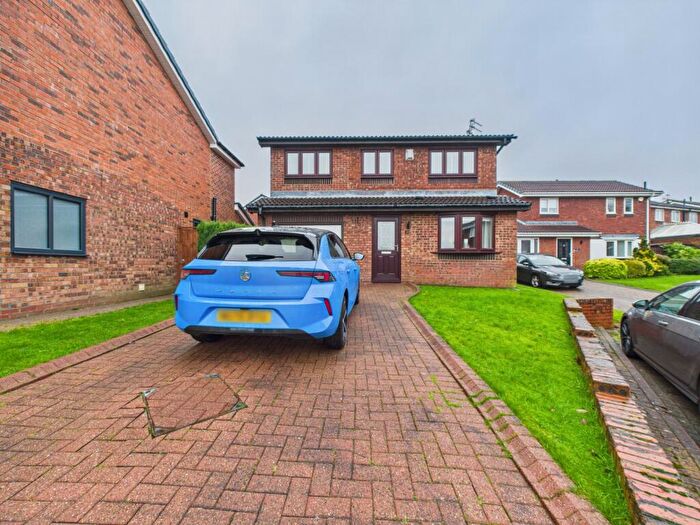
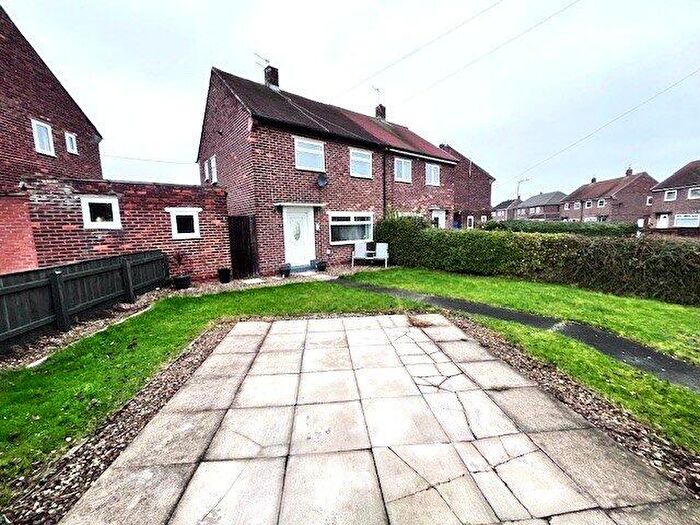
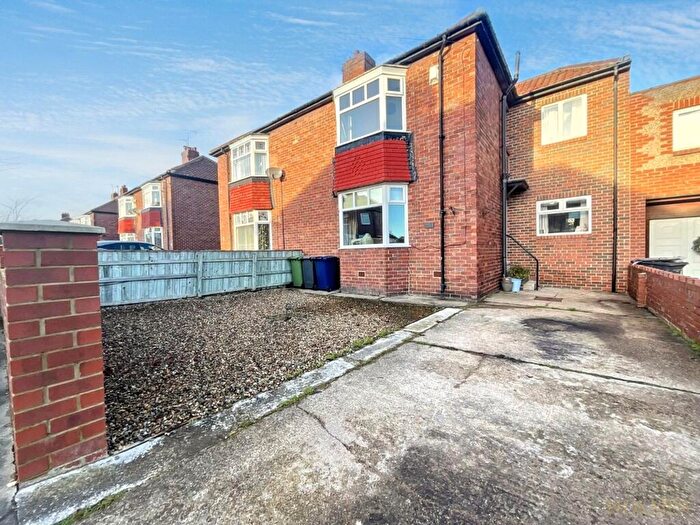
Houses for sale & to rent in Hebburn South, Hebburn
House Prices in Hebburn South
Properties in Hebburn South have an average house price of £202,785.00 and had 384 Property Transactions within the last 3 years¹.
Hebburn South is an area in Hebburn, South Tyneside with 3,470 households², where the most expensive property was sold for £460,000.00.
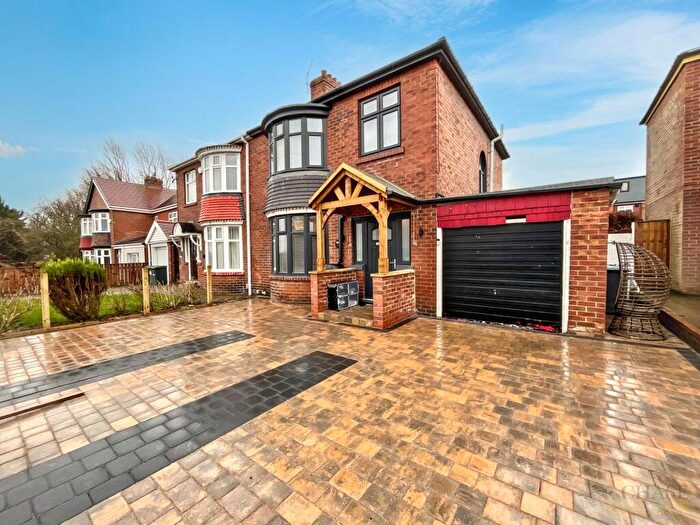
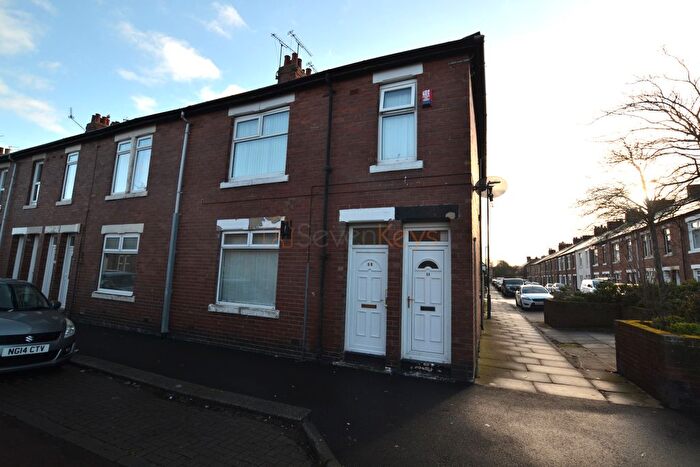
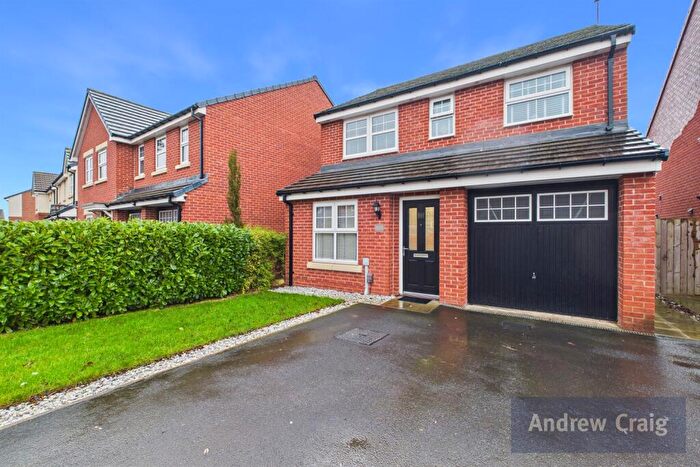
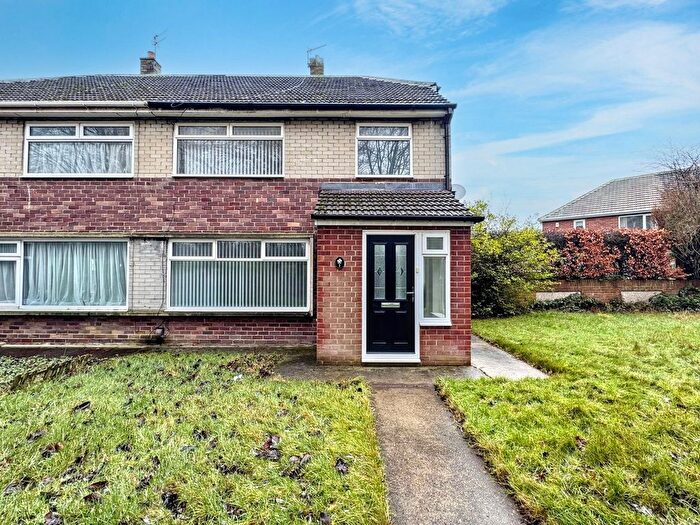
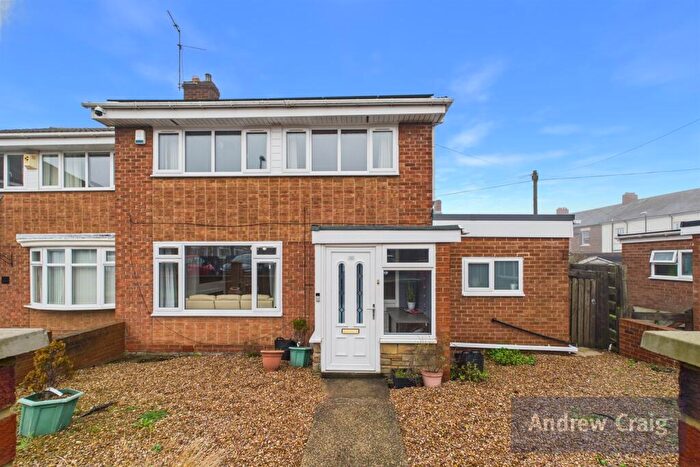
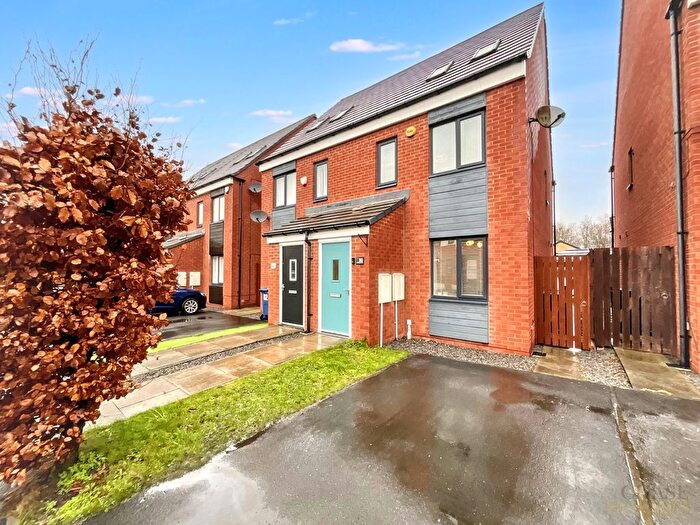
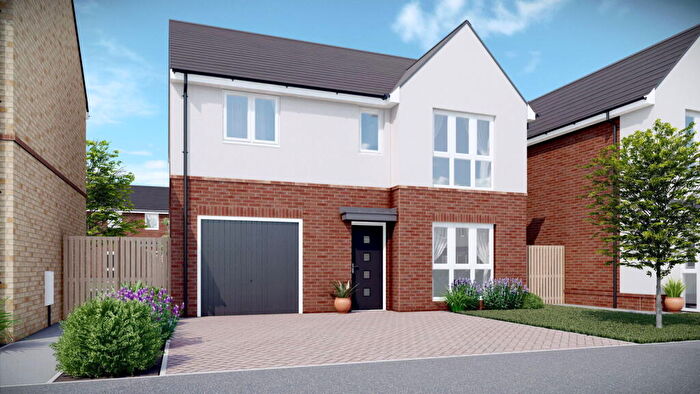
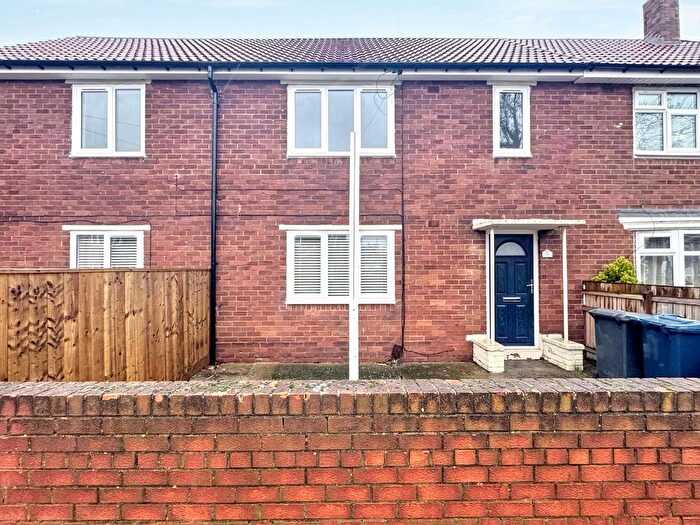
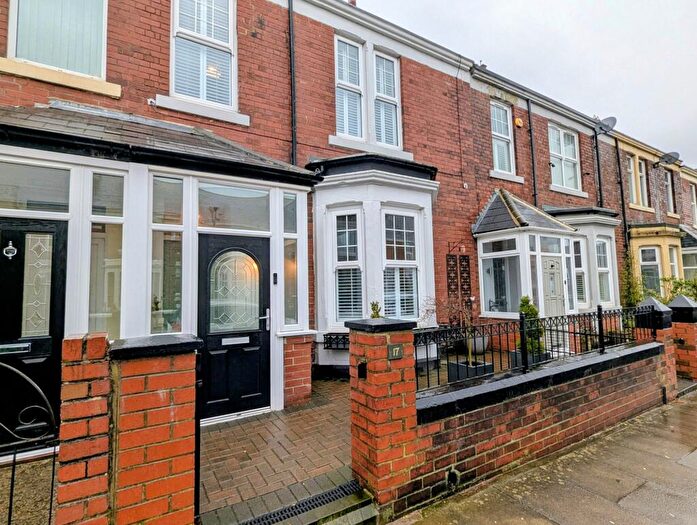
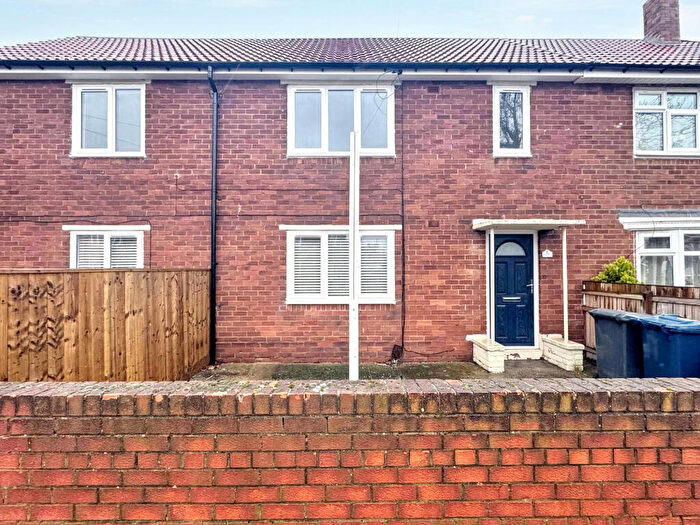
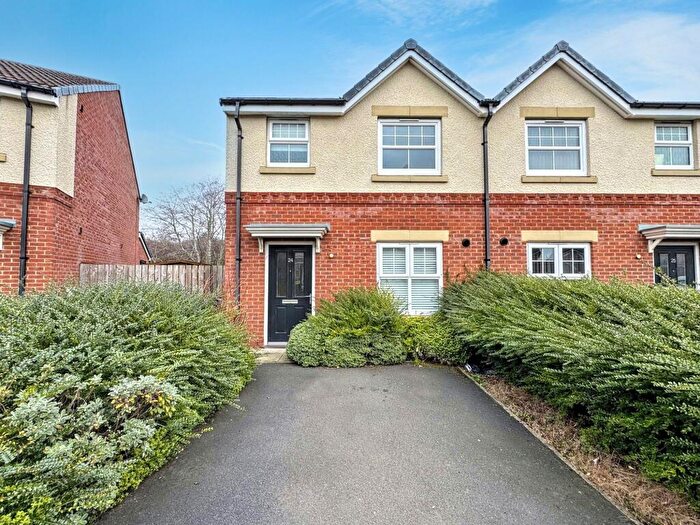
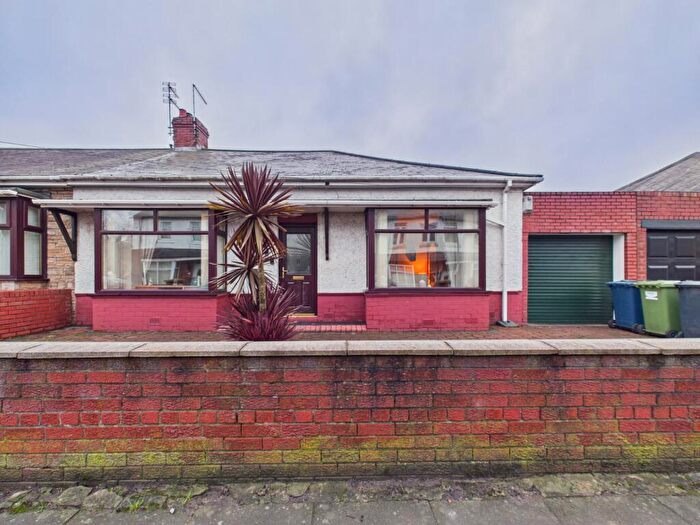
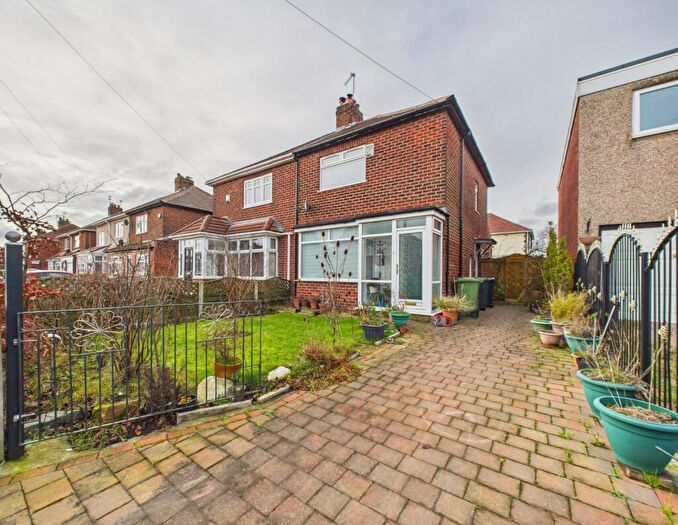
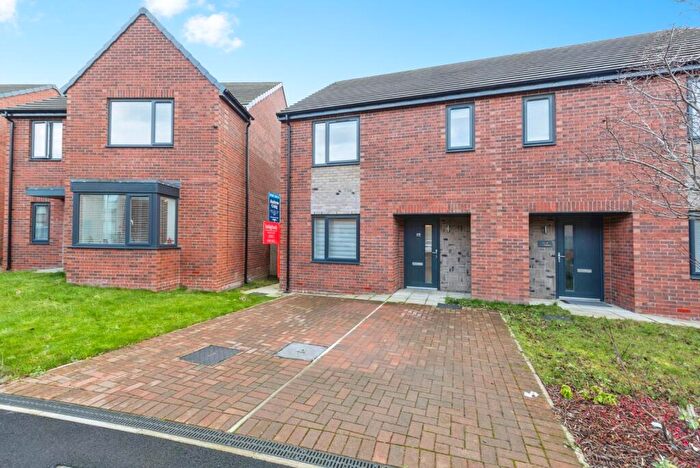
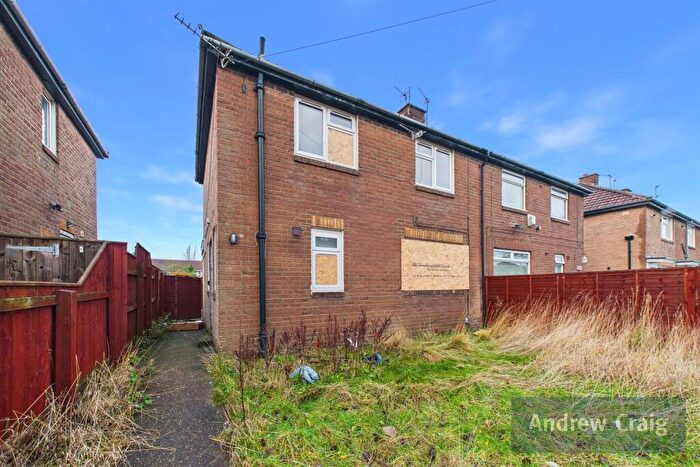
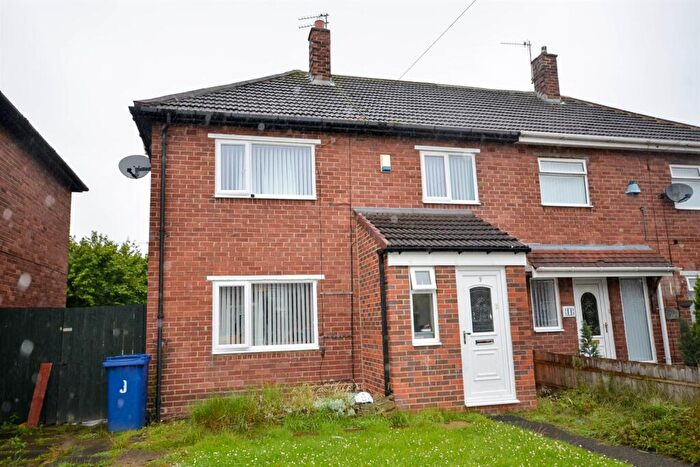
Properties for sale in Hebburn South
Roads and Postcodes in Hebburn South
Navigate through our locations to find the location of your next house in Hebburn South, Hebburn for sale or to rent.
| Streets | Postcodes |
|---|---|
| Acacia Grove | NE31 2QB |
| Alanbrooke Row | NE31 1UE |
| Alfred Street | NE31 1LZ |
| Arlington Road | NE31 2EB |
| Armstrong Court | NE31 2EE |
| Avon Road | NE31 2BU |
| Bath Road | NE31 2HZ |
| Beanley Avenue | NE31 2NH |
| Bedeswell Close | NE31 2GB |
| Begonia Close | NE31 2HY |
| Benedict Lane | NE31 2GA |
| Beresford Avenue | NE31 2PQ |
| Birtwhistle Avenue | NE31 2LQ |
| Blue House Road | NE31 2NB |
| Branton Avenue | NE31 2LR |
| Bruce Drive | NE31 2BH |
| Burn Heads Road | NE31 2TA NE31 2TB NE31 2TD |
| Campbell Park Road | NE31 2SL NE31 2ED NE31 2QU |
| Canning Street | NE31 2UE NE31 2UH NE31 2UP |
| Carr Ellison Park | NE31 2UJ |
| Cedar Grove | NE31 2PU |
| Chaffinch Drive | NE31 1BF |
| Cherry Tree Walk | NE31 2PY NE31 2PZ NE31 2QA NE31 2QL |
| Clennel Avenue | NE31 2TW |
| Cloverhill Avenue | NE31 2LS |
| Clyde Avenue | NE31 2DG NE31 2DN NE31 2JN NE31 2JP NE31 2JW |
| College Road | NE31 2LY NE31 2LZ |
| Cornwall Road | NE31 2DP |
| Cradock Avenue | NE31 2TJ |
| Crawley Avenue | NE31 2LN NE31 2LP NE31 2LT NE31 2LU |
| Crawley Square | NE31 2LW |
| Dahlia Way | NE31 2QF NE31 2QH NE31 2QJ |
| Dee Road | NE31 2DQ |
| Derby Crescent | NE31 2TP |
| Derwent Avenue | NE31 2JR |
| Devon Road | NE31 2DW |
| Dukes Avenue | NE31 2TG |
| East View | NE31 2TQ |
| Ebba Point | NE31 2GF |
| Elmfield Road | NE31 2DY |
| Elmfield Terrace | NE31 2DZ |
| Finchale Road | NE31 2BN NE31 2BT NE31 2BW NE31 2DA NE31 2HR NE31 2JB NE31 2JS NE31 2JT NE31 2HP |
| Fire Station Houses | NE31 1UD |
| Fountains Crescent | NE31 2HS NE31 2HT |
| Fuschia Gardens | NE31 2PX |
| Garden Drive | NE31 1LU |
| Goldcrest Way | NE31 1AL |
| Gresford Close | NE31 2BL |
| Grosvenor Crescent | NE31 2EA |
| Hall Road | NE31 2UG |
| Hartleyburn Avenue | NE31 2NE NE31 2NJ |
| Hexham Avenue | NE31 2DL NE31 2HN NE31 2HW NE31 2JG NE31 2JH NE31 2JQ |
| High Croft Close | NE31 1EP |
| Hollyhock Gardens | NE31 2PT |
| Holmes Drive | NE31 2BE NE31 2BF |
| Hospital Drive | NE31 2TH |
| Johnston Avenue | NE31 2LF NE31 2LG NE31 2LH NE31 2LJ NE31 2PG |
| Kellsway | NE31 2GG |
| Kelly Road | NE31 2PJ NE31 2QN |
| Kent Avenue | NE31 1LY |
| Laburnum Grove | NE31 2PL |
| Lake View | NE31 2NX |
| Lambley Crescent | NE31 2ND NE31 2NF |
| Land Associated With | NE31 1UF |
| Lavender Walk | NE31 2PS |
| Leslie Avenue | NE31 1XN |
| Liffey Road | NE31 2DH |
| Lilac Walk | NE31 2PR NE31 2PW |
| Lindisfarne Road | NE31 2HU NE31 2JA |
| Lobban Avenue | NE31 2LL |
| Longdean Close | NE31 1NZ |
| Lukes Lane | NE31 2BJ |
| Medway Avenue | NE31 2JL |
| Melrose Avenue | NE31 2JD NE31 2JF |
| Mersey Road | NE31 2DJ |
| Mill Crescent | NE31 1UG NE31 1UQ |
| Mill Lane | NE31 2ET NE31 2EU NE31 2EW NE31 2EY |
| Mimosa Drive | NE31 2HX NE31 2PP |
| Monkton Business Park North | NE31 2JZ |
| Monkton Lane | NE31 2HB |
| Mountbatten Avenue | NE31 2PH NE31 2QD NE31 2QE NE31 2QP NE31 2QT |
| Nightingale Avenue | NE31 1FL |
| North Drive | NE31 1ER NE31 1ES NE31 1EW |
| North Farm Road | NE31 1LX |
| Park Road | NE31 2UL |
| Parkside | NE31 1RP |
| Penrose Place | NE31 2AY |
| Penshaw View | NE31 2PB |
| Poplar Close | NE31 2PN |
| Prendwick Avenue | NE31 2NG |
| Prendwick Court | NE31 2NQ |
| Quarry Road | NE31 2UN NE31 2UW |
| Queens Crescent | NE31 2TE NE31 2TF |
| Redwing Walk | NE31 1AP |
| Regent Drive | NE31 2EF |
| Reyburn Wynd | NE31 1AH |
| Robin Close | NE31 1AJ |
| Ronald Gardens | NE31 2TL |
| Rutland Road | NE31 2DU |
| Severn Avenue | NE31 2JJ |
| Solway Road | NE31 2BP |
| Somerset Road | NE31 2DS |
| South Drive | NE31 1UN |
| St Close | NE31 2BG |
| St Johns Avenue | NE31 2TY NE31 2TZ NE31 2UB |
| St Johns Walk | NE31 2UR |
| St Josephs Court | NE31 2EN |
| St Rollox Street | NE31 1LW |
| Stanegate | NE31 2GH |
| Suffolk Road | NE31 2DX |
| Sullivan Walk | NE31 1YN NE31 1YW |
| Surrey Road | NE31 2DR |
| Swallow Drive | NE31 1AE |
| Swift Grove | NE31 1FA |
| Tees Road | NE31 2DD |
| Thames Road | NE31 2BX |
| Tharsis Road | NE31 1LT |
| The Willows | NE31 2QG |
| Titlington Grove | NE31 2LX |
| Toner Avenue | NE31 2PA NE31 2PD NE31 2PE NE31 2QR NE31 2QS |
| Trent Avenue | NE31 2DE |
| Victoria Road East | NE31 1XG NE31 1XL |
| Victoria Road West | NE31 1LP NE31 1LR NE31 1UH NE31 1UJ NE31 1UL NE31 1UT NE31 1UU NE31 1UX NE31 1UY NE31 1UZ NE31 1BX NE31 1LS NE31 1UB NE31 1UR NE31 2EG |
| Victoria Walk | NE31 2BQ |
| Warwick Road | NE31 2DT |
| Wear Road | NE31 2DB |
| Wellington Street | NE31 2UQ |
| West Parade | NE31 2TN |
| Westminster Crescent | NE31 2JE |
| Wilkinson Avenue | NE31 2PF |
| Witham Road | NE31 2BY |
| Wollaston Way | NE31 2BR |
| Woodvale Drive | NE31 1RA NE31 1RB |
| Wye Road | NE31 2DF |
Transport near Hebburn South
- FAQ
- Price Paid By Year
- Property Type Price
Frequently asked questions about Hebburn South
What is the average price for a property for sale in Hebburn South?
The average price for a property for sale in Hebburn South is £202,785. This amount is 19% higher than the average price in Hebburn. There are 1,046 property listings for sale in Hebburn South.
What streets have the most expensive properties for sale in Hebburn South?
The streets with the most expensive properties for sale in Hebburn South are St Close at an average of £365,000, Ebba Point at an average of £340,000 and Nightingale Avenue at an average of £314,444.
What streets have the most affordable properties for sale in Hebburn South?
The streets with the most affordable properties for sale in Hebburn South are Suffolk Road at an average of £55,000, Wellington Street at an average of £73,562 and Cornwall Road at an average of £81,166.
Which train stations are available in or near Hebburn South?
Some of the train stations available in or near Hebburn South are Heworth, Manors and Newcastle.
Property Price Paid in Hebburn South by Year
The average sold property price by year was:
| Year | Average Sold Price | Price Change |
Sold Properties
|
|---|---|---|---|
| 2025 | £214,396 | 6% |
121 Properties |
| 2024 | £202,226 | 6% |
153 Properties |
| 2023 | £190,789 | 0,4% |
110 Properties |
| 2022 | £190,040 | -3% |
165 Properties |
| 2021 | £195,411 | 8% |
199 Properties |
| 2020 | £179,437 | -7% |
144 Properties |
| 2019 | £192,410 | -2% |
214 Properties |
| 2018 | £195,715 | 3% |
217 Properties |
| 2017 | £190,206 | 16% |
208 Properties |
| 2016 | £159,532 | 7% |
181 Properties |
| 2015 | £148,177 | 2% |
147 Properties |
| 2014 | £144,685 | 25% |
115 Properties |
| 2013 | £108,261 | -1% |
70 Properties |
| 2012 | £109,380 | -3% |
60 Properties |
| 2011 | £113,164 | 2% |
58 Properties |
| 2010 | £110,784 | -3% |
53 Properties |
| 2009 | £114,245 | 2% |
41 Properties |
| 2008 | £111,660 | -5% |
56 Properties |
| 2007 | £117,548 | -3% |
102 Properties |
| 2006 | £120,606 | 6% |
108 Properties |
| 2005 | £113,086 | -6% |
103 Properties |
| 2004 | £119,565 | 31% |
130 Properties |
| 2003 | £82,435 | 24% |
106 Properties |
| 2002 | £62,892 | 17% |
99 Properties |
| 2001 | £52,355 | -5% |
90 Properties |
| 2000 | £54,808 | 13% |
81 Properties |
| 1999 | £47,795 | -1% |
80 Properties |
| 1998 | £48,414 | 8% |
92 Properties |
| 1997 | £44,757 | 1% |
71 Properties |
| 1996 | £44,423 | 2% |
82 Properties |
| 1995 | £43,543 | - |
70 Properties |
Property Price per Property Type in Hebburn South
Here you can find historic sold price data in order to help with your property search.
The average Property Paid Price for specific property types in the last three years are:
| Property Type | Average Sold Price | Sold Properties |
|---|---|---|
| Flat | £73,509.00 | 25 Flats |
| Semi Detached House | £181,909.00 | 184 Semi Detached Houses |
| Detached House | £302,865.00 | 108 Detached Houses |
| Terraced House | £147,027.00 | 67 Terraced Houses |

